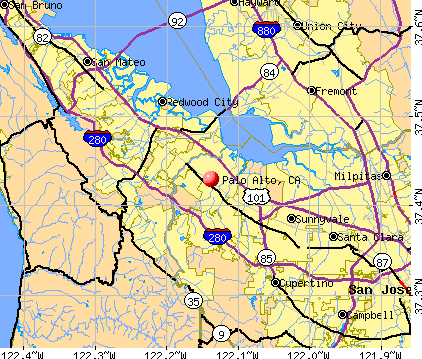
Palo Alto, California
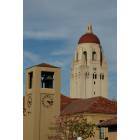
Palo Alto: Hoover Tower from Stanford University
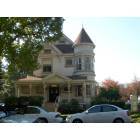
Palo Alto: Cowper House
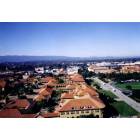
Palo Alto: View from Hoover Tower at Stanford University
Palo Alto: My favorite picture of the train pulling into the Palo Alto, Ca depot.
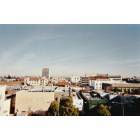
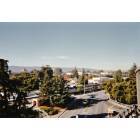
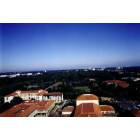
Palo Alto: Picture of the city from a higher view
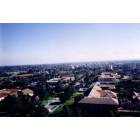
Palo Alto: View from Hoover Tower at Stanford University
Palo Alto: Downtown Palo Alto
Palo Alto: El Camino Real Palo Alto
Palo Alto: View from Hoover Tower at Stanford University
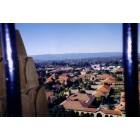
Palo Alto: View from Hoover Tower at Stanford University
- add
your
Submit your own pictures of this city and show them to the world
- OSM Map
- General Map
- Google Map
- MSN Map
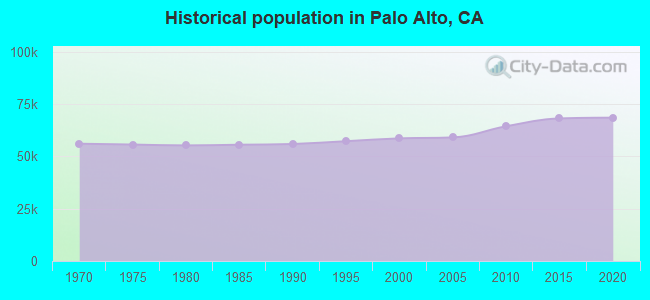
Population change since 2000: +12.6%
 |
| Males: 32,584 | |
| Females: 33,426 |
| Median resident age: | 47.6 years |
| California median age: | 37.9 years |
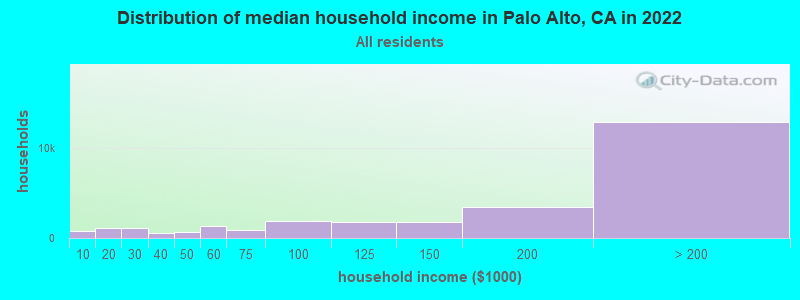
| Palo Alto: | $179,707 |
| CA: | $91,551 |
Estimated per capita income in 2022: $123,933 (it was $56,257 in 2000)
Palo Alto city income, earnings, and wages data
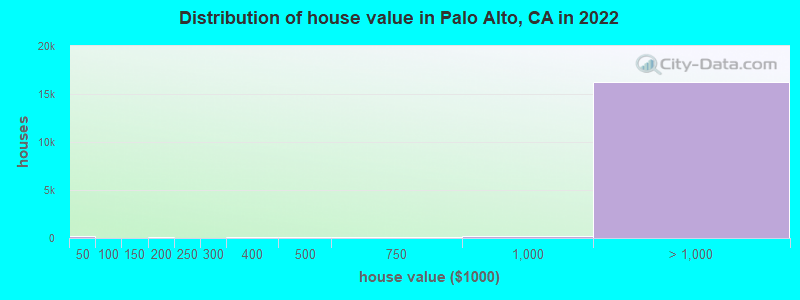
Estimated median house or condo value in 2022: over $1,000,000 (it was $776,000 in 2000)
| Palo Alto: | over $1,000,000 |
| CA: | $715,900 |
Mean prices in 2022: all housing units: over $1,000,000; detached houses: over $1,000,000; townhouses or other attached units: over $1,000,000; in 2-unit structures: over $1,000,000; in 3-to-4-unit structures: over $1,000,000; in 5-or-more-unit structures: over $1,000,000; mobile homes: $134,570
Median gross rent in 2022: $3,140.
(4.1% for White Non-Hispanic residents, 3.9% for Black residents, 17.4% for Hispanic or Latino residents, 27.8% for American Indian residents, 4.3% for Native Hawaiian and other Pacific Islander residents, 33.6% for other race residents, 3.4% for two or more races residents)
Detailed information about poverty and poor residents in Palo Alto, CA


Compare current foreclosures in Palo Alto, CA:
| Photo | Address | Area | Beds / Baths | Price | Details |
|---|---|---|---|---|---|

|
#1
Saratoga Ave
Palo Alto, CA 94303
|
750 sq. feet
|
1 baths 3 beds |
show details | |

|
#2
Euclid Ave
Palo Alto, CA 94303
|
1,600 sq. feet
|
2 baths 4 beds |
show details | |

|
#3
Verbena Dr
Palo Alto, CA 94303
|
1,100 sq. feet
|
1 baths 3 beds |
show details | |

|
#4
Gloria Way
Palo Alto, CA 94303
|
1,095 sq. feet
|
2 baths 3 beds |
show details | |

|
#5
Gloria Way
Palo Alto, CA 94303
|
1,100 sq. feet
|
2 baths 3 beds |
show details | |

|
#6
Bryant St
Palo Alto, CA 94301
|
1,458 sq. feet
|
2 baths 3 beds |
show details | |

|
#7
Weeks St
Palo Alto, CA 94303
|
1,500 sq. feet
|
2 baths 3 beds |
show details | |

|
#8
Wisteria Dr
Palo Alto, CA 94303
|
1,110 sq. feet
|
1 baths 3 beds |
show details | |

|
#9
Addison Ave
Palo Alto, CA 94303
|
1,000 sq. feet
|
1 baths 2 beds |
show details | |

|
#10
Pomona Ave
Palo Alto, CA 94306
|
2,468 sq. feet
|
3 baths 4 beds |
show details |
| Photo | Address | Area | Beds / Baths | Price | Details |
|---|---|---|---|---|---|

|
#11
Hazelwood Way
Palo Alto, CA 94303
|
1,100 sq. feet
|
2 baths 3 beds |
show details | |

|
#12
Weeks St
Palo Alto, CA 94303
|
1,500 sq. feet
|
2 baths 3 beds |
show details | |

|
#13
Hazelwood Way
Palo Alto, CA 94303
|
1,100 sq. feet
|
2 baths 3 beds |
show details | |

|
#14
Fulton St
Palo Alto, CA 94301
|
1,584 sq. feet
|
2 baths 3 beds |
show details | |

|
#15
Poplar Ave
Palo Alto, CA 94303
|
1,020 sq. feet
|
1 baths 3 beds |
show details | |

|
#16
Park Blvd
Palo Alto, CA 94306
|
- sq. feet
|
- baths - beds |
show details | |

|
#17
E Okeefe St Apt L
Palo Alto, CA 94303
|
- sq. feet
|
- baths - beds |
show details | |

|
#18
Park Blvd
Palo Alto, CA 94306
|
- sq. feet
|
- baths - beds |
show details | |

|
#19
Hillview Ave
Palo Alto, CA 94304
|
- sq. feet
|
- baths - beds |
show details | |

|
#20
Durand Way
Palo Alto, CA 94304
|
- sq. feet
|
- baths - beds |
show details |
| Photo | Address | Area | Beds / Baths | Price | Details |
|---|---|---|---|---|---|

|
#21
Hillview Ave
Palo Alto, CA 94304
|
- sq. feet
|
- baths - beds |
show details | |

|
#22
Tinsley St Apt D207
Palo Alto, CA 94303
|
- sq. feet
|
- baths - beds |
show details | |

|
#23
Poe St Apt 3
Palo Alto, CA 94301
|
- sq. feet
|
- baths - beds |
show details | |

|
#24
Colorado Ave
Palo Alto, CA 94303
|
- sq. feet
|
- baths - beds |
show details | |

|
#25
Everett Ave
Palo Alto, CA 94301
|
- sq. feet
|
- baths - beds |
show details | |

|
#26
El Camino Real
Palo Alto, CA 94306
|
- sq. feet
|
- baths - beds |
show details | |

|
#27
Bell St
Palo Alto, CA 94303
|
- sq. feet
|
- baths - beds |
show details | |

|
#28
Park Blvd
Palo Alto, CA 94306
|
- sq. feet
|
- baths - beds |
show details | |

|
#29
Ramona St Apt 721
Palo Alto, CA 94301
|
- sq. feet
|
- baths - beds |
show details | |

|
#30
Roosevelt Cir
Palo Alto, CA 94306
|
- sq. feet
|
- baths - beds |
show details |
| Photo | Address | Area | Beds / Baths | Price | Details |
|---|---|---|---|---|---|

|
#31
Illinois St
Palo Alto, CA 94303
|
- sq. feet
|
- baths - beds |
show details | |

|
#32
Ventura Ave
Palo Alto, CA 94306
|
- sq. feet
|
- baths - beds |
show details | |

|
#33
Bell St
Palo Alto, CA 94303
|
- sq. feet
|
- baths - beds |
show details | |

|
#34
San Antonio Rd Apt 109
Palo Alto, CA 94306
|
- sq. feet
|
- baths - beds |
show details | |

|
#35
Bay Rd
Palo Alto, CA 94303
|
- sq. feet
|
- baths - beds |
show details | |

|
Check over 1 million property listings on Foreclosure.com!
|
browse all offers | |||


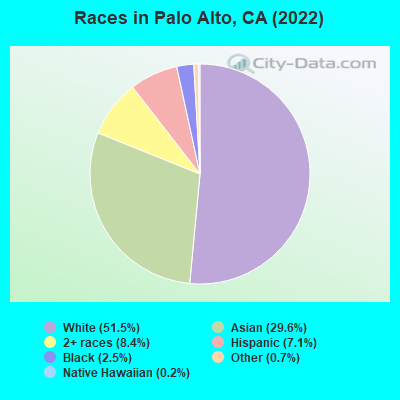
- 33,98151.5%White alone
- 19,52429.6%Asian alone
- 5,5198.4%Two or more races
- 4,7167.1%Hispanic
- 1,6712.5%Black alone
- 4420.7%Other race alone
- 1380.2%Native Hawaiian and Other
Pacific Islander alone - 300.05%American Indian alone
According to our research of California and other state lists, there were 14 registered sex offenders living in Palo Alto, California as of April 26, 2024.
The ratio of all residents to sex offenders in Palo Alto is 4,847 to 1.
The ratio of registered sex offenders to all residents in this city is much lower than the state average.
The City-Data.com crime index weighs serious crimes and violent crimes more heavily. Higher means more crime, U.S. average is 246.1. It adjusts for the number of visitors and daily workers commuting into cities.
- means the value is smaller than the state average.- means the value is about the same as the state average.
- means the value is bigger than the state average.
- means the value is much bigger than the state average.
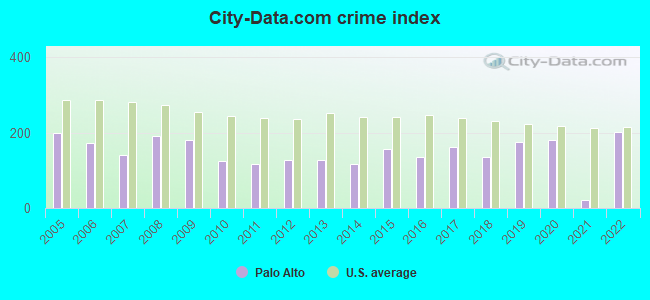
Crime rate in Palo Alto detailed stats: murders, rapes, robberies, assaults, burglaries, thefts, arson
Full-time law enforcement employees in 2021, including police officers: 114 (70 officers - 61 male; 9 female).
| Officers per 1,000 residents here: | 1.04 |
| California average: | 2.30 |
 Recent articles from our blog. Our writers, many of them Ph.D. graduates or candidates, create easy-to-read articles on a wide variety of topics.


Latest news from Palo Alto, CA collected exclusively by city-data.com from local newspapers, TV, and radio stations
Ancestries: German (4.5%), American (3.8%), English (3.6%), European (3.4%), Irish (2.1%), Iranian (1.9%).
Current Local Time: PST time zone
Elevation: 23 feet
Land area: 23.7 square miles.
Population density: 2,788 people per square mile (average).
23,326 residents are foreign born (22.0% Asia, 7.2% Europe).
| This city: | 35.2% |
| California: | 26.5% |
Median real estate property taxes paid for housing units with mortgages in 2022: $10,001 (0.5%)
Median real estate property taxes paid for housing units with no mortgage in 2022: $10,001 (0.5%)
Nearest city with pop. 200,000+: Fremont, CA  (11.6 miles , pop. 203,413).
Nearest city with pop. 1,000,000+: Los Angeles, CA (313.1 miles , pop. 3,694,820).
Nearest cities:
), ), ), Latitude: 37.43 N, Longitude: 122.14 W
Daytime population change due to commuting: +46,200 (+70.0%)
Workers who live and work in this city: 17,482 (51.8%)
Area code: 650
Palo Alto tourist attractions:
- The Westin Palo Alto
- Leland Stanford Junior University Museum of Art
- Hoover Tower
- Iris and B. Gerald Cantor Center for Visual Arts
- Professorville
- Sheraton Palo Alto Hotel
- Palo Alto Research Center (PARC)
- Stanford Linear Accelerator Center
- Steve Jobs' Garage
- The Memorial Church of Stanford University
- Crowne Plaza Palo Alto
Palo Alto, California accommodation & food services, waste management - Economy and Business Data
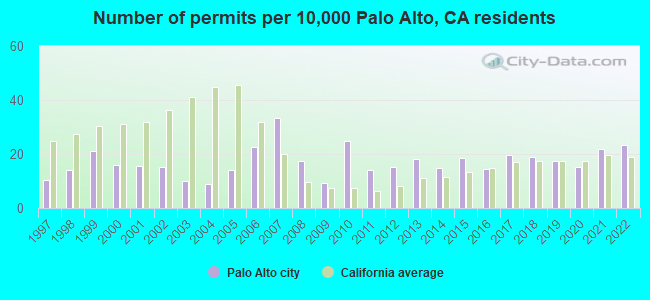
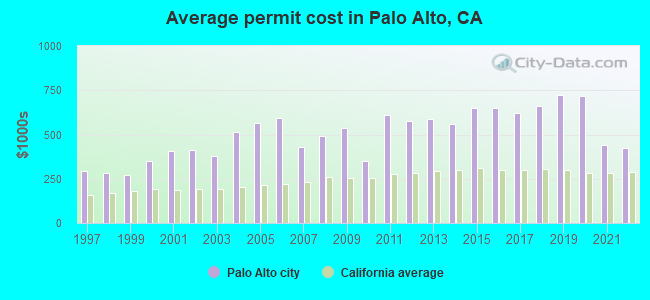
Single-family new house construction building permits:
- 2022: 137 buildings, average cost: $424,000
- 2021: 127 buildings, average cost: $438,900
- 2020: 90 buildings, average cost: $715,200
- 2019: 102 buildings, average cost: $723,200
- 2018: 110 buildings, average cost: $659,700
- 2017: 115 buildings, average cost: $623,800
- 2016: 85 buildings, average cost: $649,600
- 2015: 109 buildings, average cost: $648,300
- 2014: 87 buildings, average cost: $561,500
- 2013: 106 buildings, average cost: $586,100
- 2012: 89 buildings, average cost: $574,500
- 2011: 82 buildings, average cost: $610,600
- 2010: 146 buildings, average cost: $349,100
- 2009: 55 buildings, average cost: $538,400
- 2008: 102 buildings, average cost: $489,400
- 2007: 195 buildings, average cost: $430,400
- 2006: 132 buildings, average cost: $591,100
- 2005: 82 buildings, average cost: $565,100
- 2004: 53 buildings, average cost: $514,500
- 2003: 58 buildings, average cost: $379,100
- 2002: 88 buildings, average cost: $412,200
- 2001: 92 buildings, average cost: $405,700
- 2000: 94 buildings, average cost: $351,000
- 1999: 124 buildings, average cost: $270,500
- 1998: 82 buildings, average cost: $282,300
- 1997: 61 buildings, average cost: $295,500
| Here: | 3.2% |
| California: | 5.1% |
Population change in the 1990s: +2,783 (+5.0%).
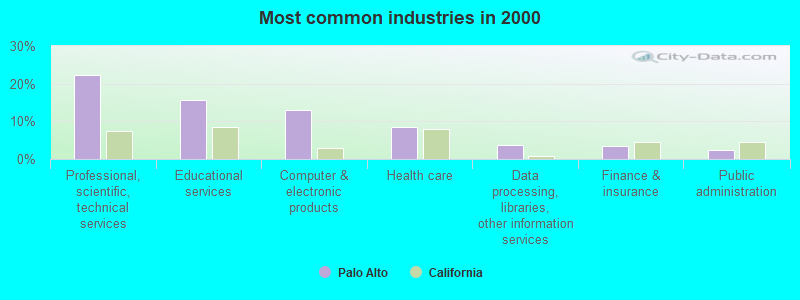
- Professional, scientific, technical services (22.4%)
- Educational services (15.7%)
- Computer & electronic products (12.9%)
- Health care (8.6%)
- Data processing, libraries, other information services (3.8%)
- Finance & insurance (3.3%)
- Public administration (2.3%)
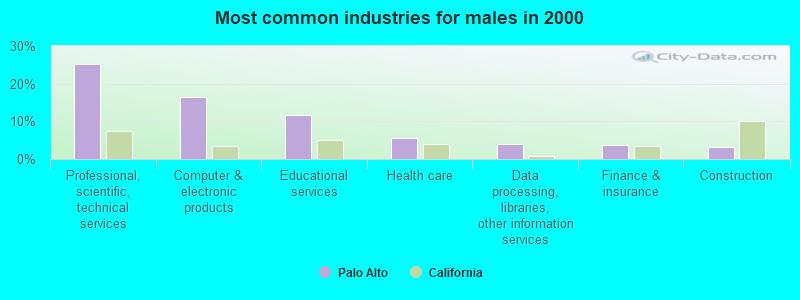
- Professional, scientific, technical services (25.3%)
- Computer & electronic products (16.5%)
- Educational services (11.7%)
- Health care (5.5%)
- Data processing, libraries, other information services (4.1%)
- Finance & insurance (3.6%)
- Construction (3.1%)
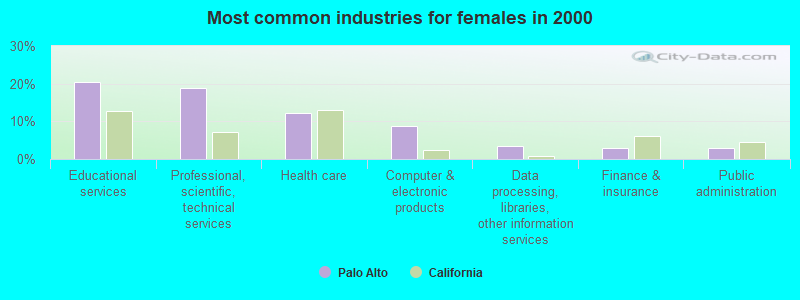
- Educational services (20.5%)
- Professional, scientific, technical services (18.9%)
- Health care (12.3%)
- Computer & electronic products (8.7%)
- Data processing, libraries, other information services (3.4%)
- Finance & insurance (3.0%)
- Public administration (2.9%)
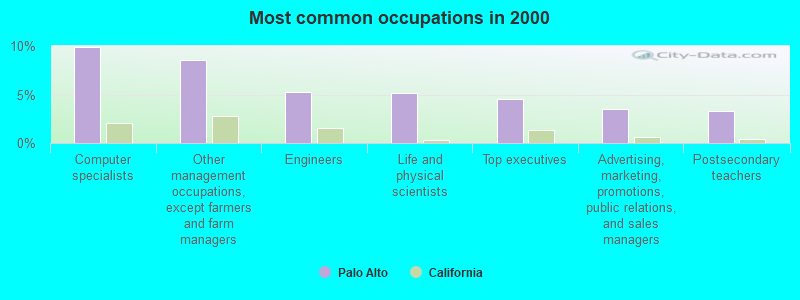
- Computer specialists (9.9%)
- Other management occupations, except farmers and farm managers (8.6%)
- Engineers (5.3%)
- Life and physical scientists (5.2%)
- Top executives (4.6%)
- Advertising, marketing, promotions, public relations, and sales managers (3.5%)
- Postsecondary teachers (3.3%)
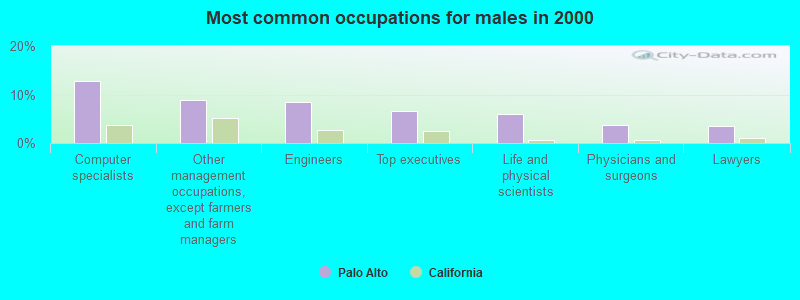
- Computer specialists (12.7%)
- Other management occupations, except farmers and farm managers (8.8%)
- Engineers (8.5%)
- Top executives (6.6%)
- Life and physical scientists (6.1%)
- Physicians and surgeons (3.7%)
- Lawyers (3.6%)
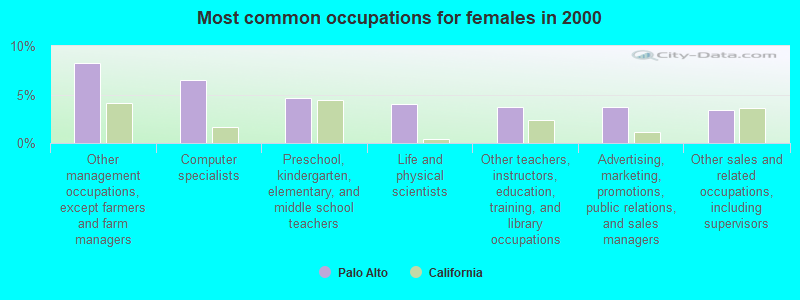
- Other management occupations, except farmers and farm managers (8.3%)
- Computer specialists (6.5%)
- Preschool, kindergarten, elementary, and middle school teachers (4.6%)
- Life and physical scientists (4.1%)
- Other teachers, instructors, education, training, and library occupations (3.7%)
- Advertising, marketing, promotions, public relations, and sales managers (3.7%)
- Other sales and related occupations, including supervisors (3.4%)
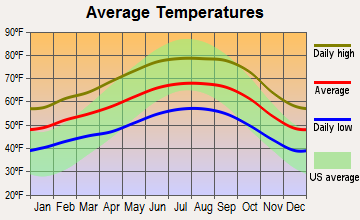
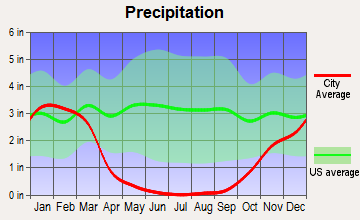
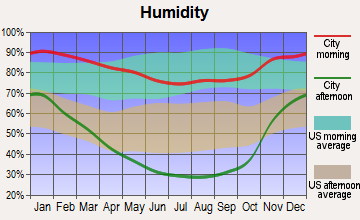
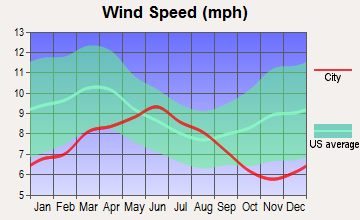
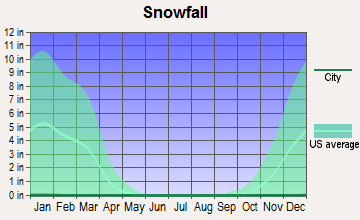
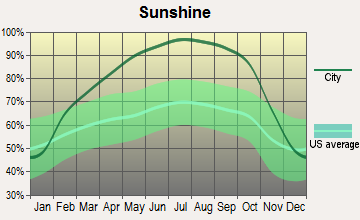
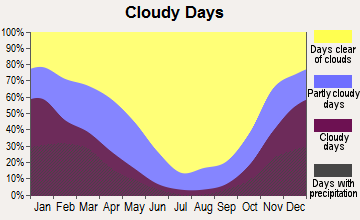
Average climate in Palo Alto, California
Based on data reported by over 4,000 weather stations
|
|

(lower is better)
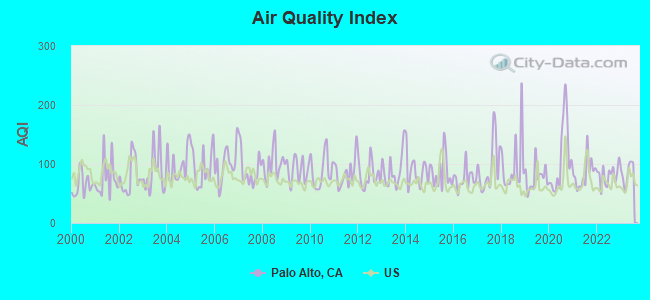
Air Quality Index (AQI) level in 2023 was 85.6. This is about average.
| City: | 85.6 |
| U.S.: | 72.6 |
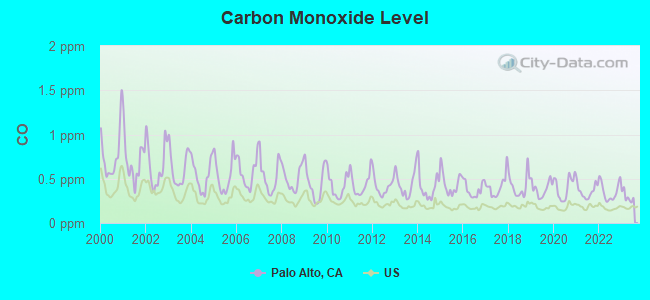
Carbon Monoxide (CO) [ppm] level in 2023 was 0.297. This is about average. Closest monitor was 5.2 miles away from the city center.
| City: | 0.297 |
| U.S.: | 0.251 |
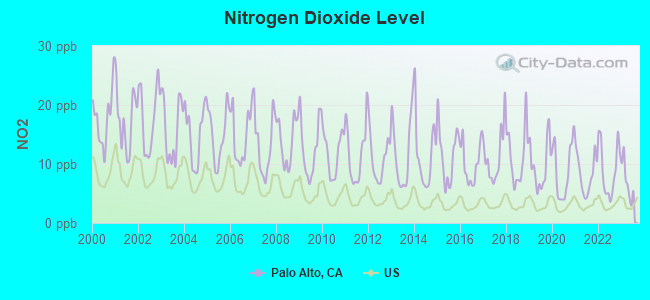
Nitrogen Dioxide (NO2) [ppb] level in 2023 was 7.08. This is worse than average. Closest monitor was 5.2 miles away from the city center.
| City: | 7.08 |
| U.S.: | 5.11 |
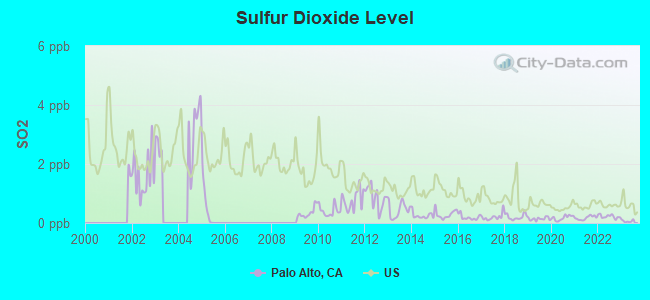
Sulfur Dioxide (SO2) [ppb] level in 2023 was 0.0660. This is significantly better than average. Closest monitor was 8.5 miles away from the city center.
| City: | 0.0660 |
| U.S.: | 1.5147 |
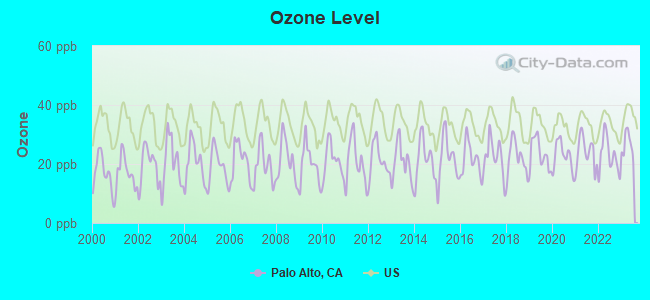
Ozone [ppb] level in 2023 was 26.5. This is better than average. Closest monitor was 5.1 miles away from the city center.
| City: | 26.5 |
| U.S.: | 33.3 |
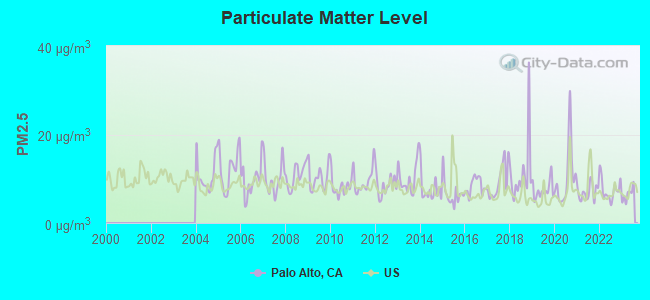
Particulate Matter (PM2.5) [µg/m3] level in 2023 was 6.43. This is better than average. Closest monitor was 5.2 miles away from the city center.
| City: | 6.43 |
| U.S.: | 8.11 |
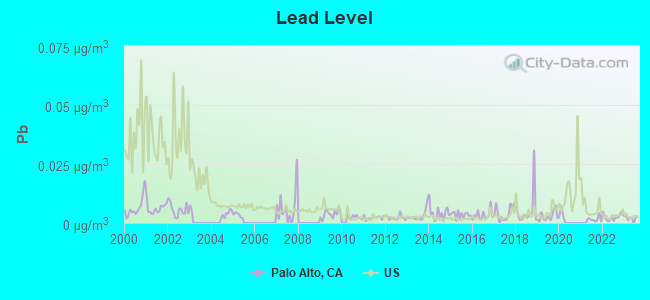
Lead (Pb) [µg/m3] level in 2023 was 0.00228. This is significantly better than average. Closest monitor was 5.2 miles away from the city center.
| City: | 0.00228 |
| U.S.: | 0.00931 |
Earthquake activity:
Palo Alto-area historical earthquake activity is significantly above California state average. It is 7510% greater than the overall U.S. average.On 4/18/1906 at 13:12:21, a magnitude 7.9 (7.9 UK, Class: Major, Intensity: VIII - XII) earthquake occurred 61.5 miles away from Palo Alto center, causing $524,000,000 total damage
On 10/18/1989 at 00:04:15, a magnitude 7.1 (6.5 MB, 7.1 MS, 6.9 MW, 7.0 ML) earthquake occurred 30.0 miles away from Palo Alto center, causing 62 deaths (62 shaking deaths) and 3757 injuries, causing $1,305,032,704 total damage
On 11/4/1927 at 13:51:53, a magnitude 7.5 (7.5 UK) earthquake occurred 184.6 miles away from the city center
On 7/21/1952 at 11:52:14, a magnitude 7.7 (7.7 UK) earthquake occurred 242.7 miles away from Palo Alto center, causing $50,000,000 total damage
On 1/31/1922 at 13:17:28, a magnitude 7.6 (7.6 UK) earthquake occurred 291.2 miles away from Palo Alto center
On 4/25/1992 at 18:06:04, a magnitude 7.2 (6.3 MB, 7.1 MS, 7.2 MW, 7.1 MW, Depth: 9.4 mi) earthquake occurred 227.2 miles away from Palo Alto center, causing $75,000,000 total damage
Magnitude types: body-wave magnitude (MB), local magnitude (ML), surface-wave magnitude (MS), moment magnitude (MW)
Natural disasters:
The number of natural disasters in Santa Clara County (19) is greater than the US average (15).Major Disasters (Presidential) Declared: 10
Emergencies Declared: 3
Causes of natural disasters: Floods: 9, Fires: 5, Winter Storms: 5, Storms: 4, Mudslides: 3, Landslides: 2, Drought: 1, Earthquake: 1, Freeze: 1, Hurricane: 1, Tornado: 1, Other: 1 (Note: some incidents may be assigned to more than one category).
Main business address for: CV THERAPEUTICS INC (BIOLOGICAL PRODUCTS (NO DIAGNOSTIC SUBSTANCES)), COMMUNICATIONS & POWER INDUSTRIES INC (ELECTRONIC COMPONENTS & ACCESSORIES), VYYO INC (COMMUNICATIONS EQUIPMENT, NEC), TIBCO SOFTWARE INC (SERVICES-PREPACKAGED SOFTWARE), COPPER MOUNTAIN NETWORKS INC (TELEPHONE & TELEGRAPH APPARATUS), STEMCELLS INC (BIOLOGICAL PRODUCTS (NO DIAGNOSTIC SUBSTANCES)), ECHELON CORP (COMPUTER COMMUNICATIONS EQUIPMENT), ESSEX PORTFOLIO LP (REAL ESTATE INVESTMENT TRUSTS) and 12 other public companies.
Hospitals and medical centers in Palo Alto:
- LUCILE SALTER PACKARD CHILDREN'S HSP AT STANFORD (Voluntary non-profit - Private, provides emergency services, 725 WELCH ROAD)
- PALO ALTO VA MEDICAL CENTER (Government Federal, 3801 MIRANDA AVENUE)
- SURGECENTER OF PALO ALTO (795 EL CAMINO REAL)
- BAY HEALTHCARE - PALO ALTO (4277 MIRANDA AVE)
- CASA OLGA INTERMEDIATE HEALTH CARE FACILITY (180 HAMILTON AVENUE)
- LYTTON GARDENS HEALTH CARE CENTER (437 WEBSTER STREET)
- PALO ALTO NURSING CENTER (911 BRYANT STREET)
- VI AT PALO ALTO (600 SAND HILL ROAD)
- LUCILE PACKARD STANFORD PEDIATRIC DIALYSIS (725 WELCH ROAD PEDIATRIC DIALYSIS RM 1229)
- STANFORD HOME CARE (1520 PAGE MILL ROAD)
Airports and heliports located in Palo Alto:
- Palo Alto Airport (PAO) (Runways: 1, Air Taxi Ops: 105, Itinerant Ops: 76,509, Local Ops: 115,083)
- Stanford University Hospital Center Heliport (15CA)
Amtrak stations near Palo Alto:
- 12 miles: SANTA CLARA-GREAT AMERICA (SANTA CLARA, FOOT OF STARS & STRIPES DR.) . Services: partially wheelchair accessible, free short-term parking.
- 12 miles: FREMONT (CENTERVILLE, FREMONT & PERALTA BLVDS.) . Services: fully wheelchair accessible, enclosed waiting area, public restrooms, public payphones, snack bar, free short-term parking, free long-term parking, call for car rental service, call for taxi service, public transit connection.
- 15 miles: FREEMONT-MISSION SAN JOSE (FREMONT, MISSION BLVD. & I-680) - Bus Station . Services: fully wheelchair accessible, public payphones, free short-term parking, call for taxi service, public transit connection.
Colleges/Universities in Palo Alto:
- Palo Alto University (Full-time enrollment: 803; Location: 1791 Arastradero Rd; Private, not-for-profit; Website: www.paloaltou.edu; Offers Doctor's degree)
- Sofia University (Full-time enrollment: 380; Location: 1069 East Meadow Cr; Private, not-for-profit; Website: www.sofia.edu; Offers Doctor's degree)
Colleges/universities with over 2000 students nearest to Palo Alto:
- Stanford University (about 3 miles; Stanford, CA; Full-time enrollment: 14,410)
- Foothill College (about 5 miles; Los Altos Hills, CA; FT enrollment: 9,635)
- Canada College (about 8 miles; Redwood City, CA; FT enrollment: 3,446)
- Mission College (about 9 miles; Santa Clara, CA; FT enrollment: 5,625)
- De Anza College (about 10 miles; Cupertino, CA; FT enrollment: 16,729)
- Santa Clara University (about 13 miles; Santa Clara, CA; FT enrollment: 7,640)
- Wyotech-Fremont (about 13 miles; Fremont, CA; FT enrollment: 2,383)
Public high schools in Palo Alto:
- HENRY M. GUNN HIGH (Students: 1,377, Location: 780 ARASTRADERO RD., Grades: 9-12)
- PACKARD CHILDREN'S HOSPITAL/STANFORD (Students: 6, Location: 725 WELCH RD., Grades: KG-12)
- PALO ALTO HIGH (Location: 50 EMBARCADERO RD., Grades: 9-12)
Private high schools in Palo Alto:
- CASTILLEJA SCHOOL (Students: 435, Location: 1310 BRYANT ST, Grades: 6-12, Girls only)
- KEHILLAH JEWISH HIGH SCHOOL (Students: 154, Location: 3900 FABIAN WAY, Grades: 9-12)
- PALO ALTO PREP (Students: 60, Location: 4000 MIDDLEFIELD RD STE H2, Grades: 8-12)
- ESTHER B CLARK SCHOOL-CHILDRENS HEALTH COUNCIL (Students: 48, Location: 650 CLARK WAY, Grades: 3-10)
Biggest public elementary/middle schools in Palo Alto:
- DAVID STARR JORDAN MIDDLE (Students: 914, Location: 750 N. CALIFORNIA AVE., Grades: 6-8)
- JANE LATHROP STANFORD MIDDLE (Students: 863, Location: 480 E. MEADOW DR., Grades: 6-8)
- TERMAN MIDDLE (Students: 630, Location: 655 ARASTRADERO RD., Grades: 6-8)
- WALTER HAYS ELEMENTARY (Students: 340, Location: 1525 MIDDLEFIELD RD., Grades: KG-5)
- DUVENECK ELEMENTARY (Students: 326, Location: 705 ALESTER AVE., Grades: KG-5)
- ADDISON ELEMENTARY (Students: 291, Location: 650 ADDISON AVE., Grades: KG-5)
- HERBERT HOOVER ELEMENTARY (Students: 250, Location: 445 E. CHARLESTON RD., Grades: KG-5)
- PALO VERDE ELEMENTARY (Students: 246, Location: 3450 LOUIS RD., Grades: KG-5)
- FAIRMEADOW ELEMENTARY (Students: 245, Location: 500 E. MEADOW DR., Grades: KG-5)
- EL CARMELO ELEMENTARY (Students: 242, Location: 3024 BRYANT ST., Grades: KG-5)
Biggest private elementary/middle schools in Palo Alto:
- INTERNATIONAL SCHOOL OF THE PENINSULA (Students: 579, Location: 151 LAURA LN, Grades: PK-8)
- GIDEON HAUSNER JEWISH DAY SCHOOL (Students: 374, Location: 450 SAN ANTONIO RD, Grades: KG-8)
- STRATFORD SCHOOL - PALO ALTO (Students: 300, Location: 870 N CALIFORNIA AVE, Grades: PK-5)
- KEYS SCHOOL (Students: 289, Location: 2890 MIDDLEFIELD RD, Grades: KG-8)
- ST ELIZABETH SETON SCHOOL (Students: 265, Location: 1095 CHANNING AVE, Grades: KG-8)
- BOWMAN INTERNATIONAL SCHOOL (Students: 245, Location: 4000 TERMAN DR, Grades: KG-8)
- GIRLS' MIDDLE SCHOOL (Students: 166, Location: 3400 W BAYSHORE RD, Grades: 6-8, Girls only)
- HOPE TECHNOLOGY SCHOOL (Students: 94, Location: 2525 E BAYSHORE RD, Grades: KG-8)
- LIVING WISDOM SCHOOL OF PALO ALTO (Students: 71, Location: 456 COLLEGE AVE, Grades: PK-8)
- HELIOS NEW SCHOOL (Students: 28, Location: 3921 FABIAN WAY BLDG C, Grades: KG-4)
Library in Palo Alto:
Points of interest:
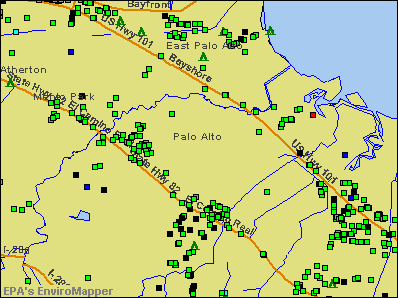
Notable locations in Palo Alto: Regional Water Quality Control Plant (A), Shotgun Bend (B), Palo Alto City Landfill (C), Foothills Park Nature Interpretive Center (D), Palo Alto Yacht Club (E), Los Altos Sewage Disposal Plant (F), Palo Alto Office Center (G), Stanford Industrial Park (H), Welch Road Professional Center (I), Palo Alto Municipal Golf Course (J), Palo Alto Hills Golf and Country Club (K), Womens Club of Palo Alto (L), Palo Alto Fire Department Station 1 (M), Palo Alto Fire Department Station 3 (N), Palo Alto Railroad Station (O), Palo Alto Main Library (P), Palo Alto Downtown Library (Q), Palo Alto Club (R), Palo Alto City Hall (S), Palo Alto Childrens Library (T). Display/hide their locations on the map
Shopping Centers: Edgewood Plaza Shopping Center (1), Charleston Shopping Center (2), Palo Alto Square Shopping Center (3), Stanford Shopping Center (4), Town and Country Shopping Center (5). Display/hide their locations on the map
Main business address in Palo Alto include: CV THERAPEUTICS INC (A), COMMUNICATIONS & POWER INDUSTRIES INC (B), VYYO INC (C), TIBCO SOFTWARE INC (D), COPPER MOUNTAIN NETWORKS INC (E), STEMCELLS INC (F), ECHELON CORP (G), ESSEX PORTFOLIO LP (H). Display/hide their locations on the map
Churches in Palo Alto include: Saint Marks Episcopal Church (A), Peninsula Bible Church (B), Palo Alto Church of Christ (C), Kingdom Hall of Jehovahs Witnesses (D), Grace Lutheran Church (E), First Christian Church (F), Covenant Presbyterian Church (G), Wesley United Methodist Church (H), University Lutheran Church (I). Display/hide their locations on the map
Cemetery: Alta Mesa Cemetery (1). Display/hide its location on the map
Reservoir: Borondo Lake (A). Display/hide its location on the map
Creeks: Gold Mine Creek (A), Indian Cabin Creek (B), Indian Creek (C), Matadero Creek (D), Barron Creek (E), Deer Creek (F), San Francisquito Creek (G), Adobe Creek (H), Bay Creek (I). Display/hide their locations on the map
Parks in Palo Alto include: Mitchell Park (1), Cameron Park (2), Berkeley Park (3), Peers Park (4), Rinconada Park (5), Werry Park (6), Bowden Park (7), Cogswell Plaza (8), Doctor E E Johnson Park (9). Display/hide their locations on the map
Tourist attractions: Classical Archives LLC (Cultural Attractions- Events- & Facilities; 200 Sheridan Avenue Suite 403) (1), Agilent Technologies (Cultural Attractions- Events- & Facilities; 395 Page Mill Road) (2). Display/hide their approximate locations on the map
Hotel: Barker Hotel (439 Emerson Street) (1). Display/hide its approximate location on the map
Birthplace of: Rick Nowels - Record producer, Bill McKibben - Environmentalist, Lindsey Buckingham - (born 1949), of Fleetwood Mac, James Franco - Film actor, Alan Cranston - (1914-2000), politician, Amy Irving - Actor, Lisa Graham Keegan - Politician, Katie Hoff - Swimmer, Elaine Pagels - Theologian, Joe Locke - Jazz vibraphonist.
| This city: | 2.4 people |
| California: | 2.9 people |
| This city: | 62.2% |
| Whole state: | 68.7% |
| This city: | 4.4% |
| Whole state: | 7.2% |
Likely homosexual households (counted as self-reported same-sex unmarried-partner households)
- Lesbian couples: 0.3% of all households
- Gay men: 0.4% of all households
People in group quarters in Palo Alto in 2010:
- 323 people in nursing facilities/skilled-nursing facilities
- 147 people in other noninstitutional facilities
- 35 people in mental (psychiatric) hospitals and psychiatric units in other hospitals
- 19 people in group homes intended for adults
- 17 people in in-patient hospice facilities
- 15 people in residential treatment centers for adults
- 12 people in emergency and transitional shelters (with sleeping facilities) for people experiencing homelessness
- 12 people in workers' group living quarters and job corps centers
- 3 people in group homes for juveniles (non-correctional)
People in group quarters in Palo Alto in 2000:
- 343 people in nursing homes
- 209 people in other noninstitutional group quarters
- 47 people in orthopedic wards and institutions for the physically handicapped
- 23 people in institutions for the blind
- 21 people in homes for the mentally ill
- 20 people in wards in general hospitals for patients who have no usual home elsewhere
- 5 people in other group homes
Banks with most branches in Palo Alto (2011 data):
- Bank of America, National Association: Palo Alto Private Banking Branch, Palo Alto Branch, Stanford Financial Square Branch, Stanford Branch. Info updated 2009/11/18: Bank assets: $1,451,969.3 mil, Deposits: $1,077,176.8 mil, headquarters in Charlotte, NC, positive income, 5782 total offices, Holding Company: Bank Of America Corporation
- Wells Fargo Bank, National Association: Palo Alto Branch, Palo Alto Pcs Branch, Stanford Shopping Center, Stanford Industrial Park Branch. Info updated 2011/04/05: Bank assets: $1,161,490.0 mil, Deposits: $905,653.0 mil, headquarters in Sioux Falls, SD, positive income, 6395 total offices, Holding Company: Wells Fargo & Company
- JPMorgan Chase Bank, National Association: Middlefield Road Branch at 2846 Middlefield Road, branch established on 1919/01/01; 300 Hamilton Avenue Branch at 300 Hamilton Avenue, branch established on 1892/01/01. Info updated 2011/11/10: Bank assets: $1,811,678.0 mil, Deposits: $1,190,738.0 mil, headquarters in Columbus, OH, positive income, International Specialization, 5577 total offices, Holding Company: Jpmorgan Chase & Co.
- Citibank, National Association: 2401 El Camino Real Branch at 2401 El Camino Real, branch established on 1935/08/01; Palo Alto Branch at 250 University Avenue, branch established on 1991/08/26. Info updated 2012/01/10: Bank assets: $1,288,658.0 mil, Deposits: $882,541.0 mil, headquarters in Sioux Falls, SD, positive income, International Specialization, 1048 total offices, Holding Company: Citigroup Inc.
- Comerica Bank: Messenger Service Branch at 250 Lytton Avenue, branch established on 1993/08/23; Palo Alto Branch at 250 Lytton Avenue, branch established on 1980/05/13. Info updated 2011/07/29: Bank assets: $60,970.5 mil, Deposits: $48,300.9 mil, headquarters in Dallas, TX, positive income, Commercial Lending Specialization, 497 total offices, Holding Company: Comerica Incorporated
- Union Bank, National Association: Palo Alto Branch at 4291 El Camino Real, branch established on 1969/09/12; Mid Peninsula Branch at 400 University Avenue, branch established on 1964/03/31. Info updated 2011/09/01: Bank assets: $88,967.5 mil, Deposits: $65,286.4 mil, headquarters in San Francisco, CA, positive income, Commercial Lending Specialization, 403 total offices, Holding Company: Mitsubishi Ufj Financial Group, Inc.
- Boston Private Bank & Trust Company: Palo Alto Branch at 245 Lytton Avenue, branch established on 2002/10/07. Info updated 2011/06/08: Bank assets: $5,848.9 mil, Deposits: $4,643.9 mil, headquarters in Boston, MA, positive income, Commercial Lending Specialization, 24 total offices, Holding Company: Boston Private Financial Holdings, Inc.
- E*TRADE Savings Bank: Palo Alto Branch at 124 University Avenue, branch established on 2007/01/29. Info updated 2011/07/21: Bank assets: $1,677.9 mil, Deposits: $1,504.6 mil, headquarters in Arlington, VA, positive income, Mortgage Lending Specialization, 25 total offices
- Bridge Bank, National Association: Palo Alto Branch at 525 University Avenue, branch established on 2002/01/28. Info updated 2009/10/13: Bank assets: $1,157.0 mil, Deposits: $1,014.7 mil, headquarters in San Jose, CA, positive income, Commercial Lending Specialization, 2 total offices, Holding Company: Scj, Inc.
- 8 other banks with 8 local branches
For population 15 years and over in Palo Alto:
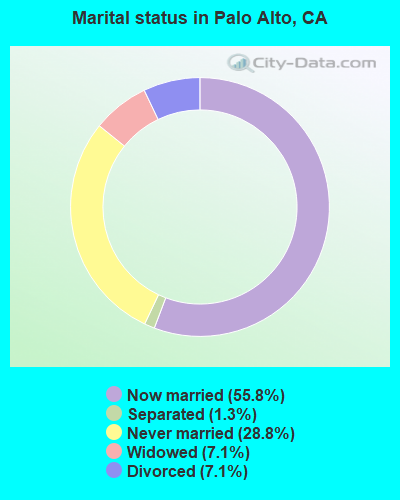
- Never married: 28.8%
- Now married: 55.8%
- Separated: 1.3%
- Widowed: 7.1%
- Divorced: 7.1%
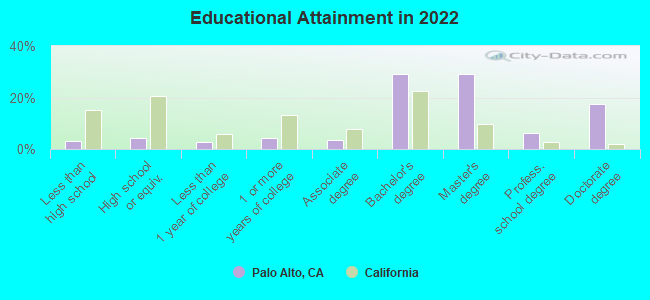
For population 25 years and over in Palo Alto:
- High school or higher: 96.8%
- Bachelor's degree or higher: 82.3%
- Graduate or professional degree: 53.0%
- Unemployed: 1.9%
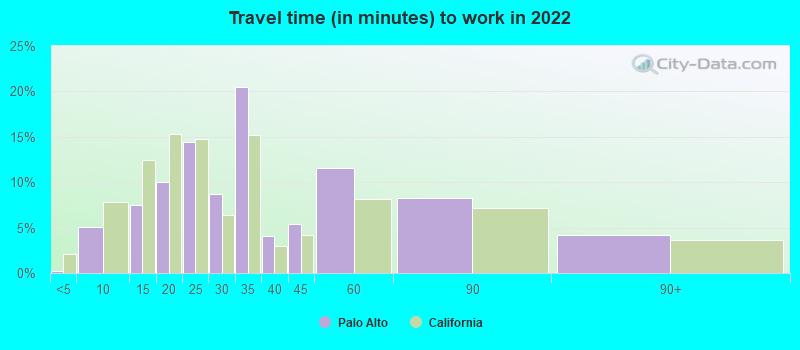
- Mean travel time to work (commute): 15.3 minutes
| Here: | 10.0 |
| California average: | 15.5 |
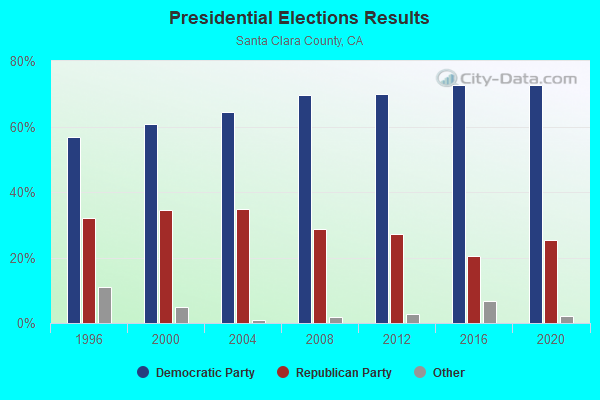
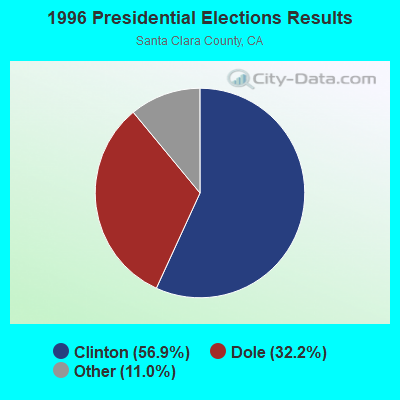
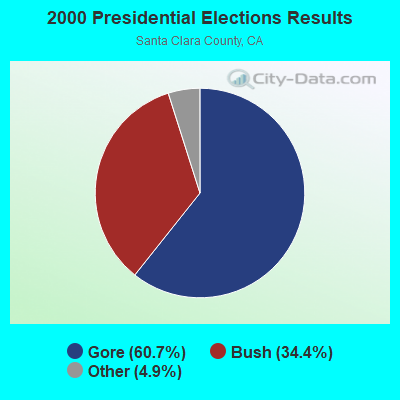

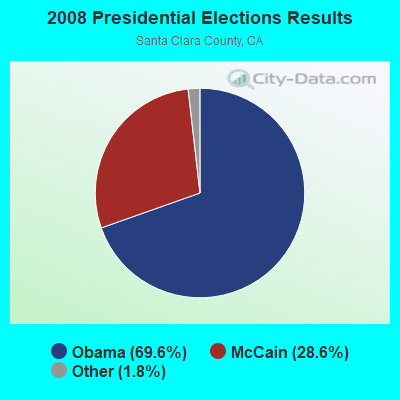
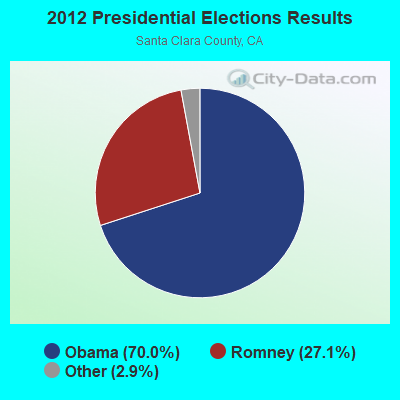
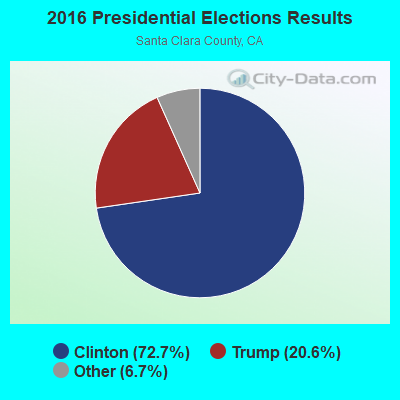
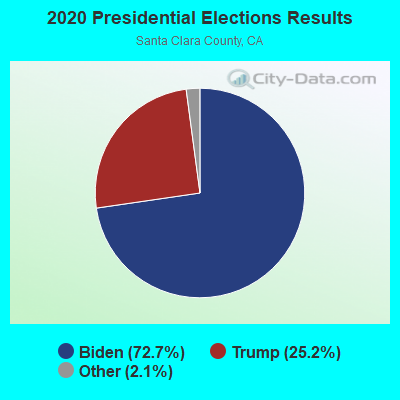
Graphs represent county-level data. Detailed 2008 Election Results
Neighborhoods in Palo Alto:
(Palo Alto, California Neighborhood Map)- Barron Park neighborhood
- Charleston Meadows neighborhood
- Charleston Terrace neighborhood
- College Terrace neighborhood
- Community Center neighborhood
- Crescent Park neighborhood
- Downtown (Downtown North) neighborhood
- Duveneck (St Francis) neighborhood
- Evergreen Park neighborhood
- Fairmeadow neighborhood
- Garland (Leland Manor) neighborhood
- Green Acres neighborhood
- Greenmeadow neighborhood
- Midtown (Midtown West) neighborhood
- Oak Creek neighborhood
- Old Palo Alto neighborhood
- Palo Alto Hills neighborhood
- Palo Verde neighborhood
- Professorville neighborhood
- Research Park neighborhood
- Southgate neighborhood
- University Park neighborhood
- University South neighborhood
- Ventura neighborhood
Religion statistics for Palo Alto, CA (based on Santa Clara County data)
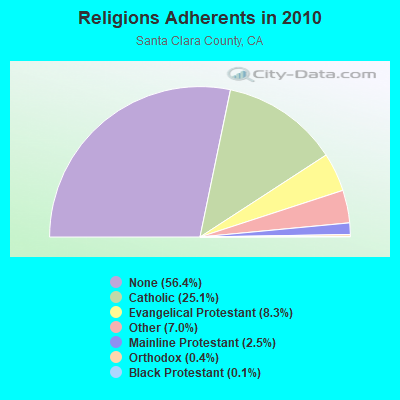
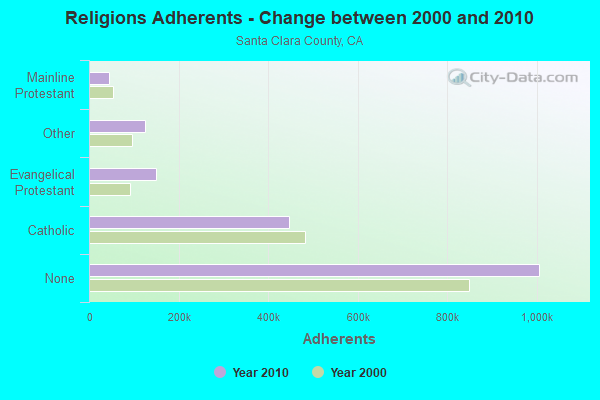
| Religion | Adherents | Congregations |
|---|---|---|
| Catholic | 447,369 | 56 |
| Evangelical Protestant | 148,599 | 481 |
| Other | 125,165 | 221 |
| Mainline Protestant | 44,623 | 132 |
| Orthodox | 7,720 | 17 |
| Black Protestant | 2,552 | 20 |
| None | 1,005,614 | - |
Food Environment Statistics:
| Santa Clara County: | 1.99 / 10,000 pop. |
| California: | 2.14 / 10,000 pop. |
| Santa Clara County: | 0.04 / 10,000 pop. |
| California: | 0.04 / 10,000 pop. |
| Santa Clara County: | 0.68 / 10,000 pop. |
| California: | 0.62 / 10,000 pop. |
| Santa Clara County: | 1.38 / 10,000 pop. |
| California: | 1.49 / 10,000 pop. |
| This county: | 8.59 / 10,000 pop. |
| California: | 7.42 / 10,000 pop. |
| Santa Clara County: | 7.1% |
| State: | 7.3% |
| Santa Clara County: | 19.0% |
| California: | 21.3% |
| Here: | 16.6% |
| State: | 17.9% |
Health and Nutrition:
| Palo Alto: | 55.3% |
| State: | 49.4% |
| Palo Alto: | 53.3% |
| State: | 48.0% |
| This city: | 27.5 |
| State: | 28.1 |
| Palo Alto: | 17.8% |
| California: | 20.2% |
| Palo Alto: | 10.9% |
| California: | 11.2% |
| Palo Alto: | 6.9 |
| State: | 6.8 |
| Here: | 31.2% |
| California: | 31.5% |
| This city: | 60.6% |
| California: | 56.4% |
| Palo Alto: | 80.5% |
| State: | 80.9% |
More about Health and Nutrition of Palo Alto, CA Residents
| Local government employment and payroll (March 2022) | |||||
| Function | Full-time employees | Monthly full-time payroll | Average yearly full-time wage | Part-time employees | Monthly part-time payroll |
|---|---|---|---|---|---|
| Water Supply | 104 | $490,927 | $56,645 | 0 | $0 |
| Firefighters | 102 | $1,700,171 | $200,020 | 0 | $0 |
| Police Protection - Officers | 100 | $1,523,715 | $182,846 | 2 | $1,061 |
| Parks and Recreation | 99 | $871,518 | $105,639 | 11 | $73,378 |
| Electric Power | 91 | $1,117,810 | $147,404 | 4 | $12,227 |
| Financial Administration | 88 | $977,197 | $133,254 | 4 | $16,031 |
| Housing and Community Development (Local) | 69 | $714,157 | $124,201 | 4 | $12,621 |
| Streets and Highways | 61 | $489,223 | $96,241 | 3 | $8,004 |
| Other Government Administration | 59 | $665,868 | $135,431 | 10 | $25,499 |
| Local Libraries | 43 | $321,039 | $89,592 | 41 | $66,067 |
| Police - Other | 40 | $441,260 | $132,378 | 6 | $17,694 |
| Gas Supply | 31 | $315,475 | $122,119 | 2 | $4,003 |
| Solid Waste Management | 24 | $227,864 | $113,932 | 1 | $2,356 |
| Sewerage | 24 | $220,773 | $110,387 | 3 | $5,597 |
| Judicial and Legal | 9 | $153,483 | $204,644 | 1 | $4,912 |
| Airports | 5 | $55,821 | $133,970 | 2 | $4,359 |
| Natural Resources | 4 | $45,727 | $137,181 | 0 | $0 |
| Fire - Other | 4 | $36,256 | $108,768 | 1 | $933 |
| Other and Unallocable | 3 | $45,600 | $182,400 | 0 | $0 |
| Transit | 2 | $21,369 | $128,214 | 0 | $0 |
| Health | 1 | $7,963 | $95,556 | 0 | $0 |
| Totals for Government | 963 | $10,443,216 | $130,134 | 95 | $254,742 |
Palo Alto government finances - Expenditure in 2021 (per resident):
- Construction - General - Other: $44,111,000 ($668.25)
Regular Highways: $3,895,000 ($59.01)
Police Protection: $63,000 ($0.95)
Parks and Recreation: $27,000 ($0.41)
Housing and Community Development: $18,000 ($0.27)
- Current Operations - Electric Utilities: $117,019,000 ($1772.75)
Police Protection: $43,910,000 ($665.20)
Sewerage: $43,273,000 ($655.55)
Water Utilities: $39,187,000 ($593.65)
Local Fire Protection: $36,712,000 ($556.16)
Parks and Recreation: $31,362,000 ($475.11)
Solid Waste Management: $28,587,000 ($433.07)
Central Staff Services: $26,392,000 ($399.82)
Gas Utilities: $25,442,000 ($385.43)
Libraries: $11,046,000 ($167.34)
Regular Highways: $7,989,000 ($121.03)
Parking Facilities: $3,323,000 ($50.34)
General - Other: $2,174,000 ($32.93)
Transit Utilities: $2,143,000 ($32.46)
Housing and Community Development: $1,354,000 ($20.51)
Air Transportation: $1,330,000 ($20.15)
Health - Other: $1,036,000 ($15.69)
Protective Inspection and Regulation - Other: $20,000 ($0.30)
- Electric Utilities - Interest on Debt: $7,755,000 ($117.48)
- Gas Utilities - Interest on Debt: $136,000 ($2.06)
- General - Interest on Debt: $12,758,000 ($193.27)
- Water Utilities - Interest on Debt: $1,501,000 ($22.74)
Palo Alto government finances - Revenue in 2021 (per resident):
- Charges - Sewerage: $59,028,000 ($894.23)
Solid Waste Management: $30,636,000 ($464.11)
Other: $23,898,000 ($362.04)
Parks and Recreation: $6,650,000 ($100.74)
Housing and Community Development: $5,890,000 ($89.23)
Air Transportation: $2,585,000 ($39.16)
Regular Highways: $382,000 ($5.79)
Parking Facilities: $206,000 ($3.12)
Miscellaneous Commercial Activities: $1,000 ($0.02)
- Federal Intergovernmental - Air Transportation: $5,619,000 ($85.12)
Other: $1,221,000 ($18.50)
Housing and Community Development: $1,026,000 ($15.54)
Water Utilities: $462,000 ($7.00)
- Miscellaneous - General Revenue - Other: $15,606,000 ($236.42)
Rents: $13,366,000 ($202.48)
Interest Earnings: $4,439,000 ($67.25)
Special Assessments: $1,715,000 ($25.98)
Fines and Forfeits: $630,000 ($9.54)
Donations From Private Sources: $153,000 ($2.32)
Sale of Property: $100,000 ($1.51)
- Revenue - Electric Utilities: $158,074,000 ($2394.70)
Water Utilities: $46,813,000 ($709.18)
Gas Utilities: $39,674,000 ($601.03)
- State Intergovernmental - Other: $11,382,000 ($172.43)
Highways: $2,793,000 ($42.31)
General Local Government Support: $138,000 ($2.09)
- Tax - Property: $60,763,000 ($920.51)
General Sales and Gross Receipts: $29,127,000 ($441.25)
Public Utilities Sales: $14,642,000 ($221.81)
Documentary and Stock Transfer: $10,627,000 ($160.99)
Other License: $8,792,000 ($133.19)
Other Selective Sales: $5,179,000 ($78.46)
Occupation and Business License - Other: $15,000 ($0.23)
Palo Alto government finances - Debt in 2021 (per resident):
- Long Term Debt - Outstanding Unspecified Public Purpose: $443,848,000 ($6723.95)
Beginning Outstanding - Unspecified Public Purpose: $254,987,000 ($3862.85)
Issue, Unspecified Public Purpose: $203,010,000 ($3075.44)
Retired Unspecified Public Purpose: $14,150,000 ($214.36)
Palo Alto government finances - Cash and Securities in 2021 (per resident):
- Bond Funds - Cash and Securities: $170,650,000 ($2585.21)
- Other Funds - Cash and Securities: $184,118,000 ($2789.24)
- Sinking Funds - Cash and Securities: $13,043,000 ($197.59)
5.37% of this county's 2021 resident taxpayers lived in other counties in 2020 ($152,550 average adjusted gross income)
| Here: | 5.37% |
| California average: | 5.19% |
0.01% of residents moved from foreign countries ($93 average AGI)
Santa Clara County: 0.01% California average: 0.03%
Top counties from which taxpayers relocated into this county between 2020 and 2021:
| from Alameda County, CA | |
| from San Mateo County, CA | |
| from San Francisco County, CA |
7.70% of this county's 2020 resident taxpayers moved to other counties in 2021 ($201,706 average adjusted gross income)
| Here: | 7.70% |
| California average: | 6.14% |
0.01% of residents moved to foreign countries ($110 average AGI)
Santa Clara County: 0.01% California average: 0.02%
Top counties to which taxpayers relocated from this county between 2020 and 2021:
| to Alameda County, CA | |
| to San Mateo County, CA | |
| to San Francisco County, CA |
| Businesses in Palo Alto, CA | ||||
| Name | Count | Name | Count | |
|---|---|---|---|---|
| 7-Eleven | 2 | Macy's | 1 | |
| ALDO | 1 | MasterBrand Cabinets | 6 | |
| AT&T | 3 | McDonald's | 2 | |
| Abercrombie & Fitch | 1 | Motel 6 | 1 | |
| Ace Hardware | 1 | Motherhood Maternity | 1 | |
| Ann Taylor | 2 | New Balance | 8 | |
| Apple Store | 2 | Nike | 7 | |
| Audi | 1 | Nordstrom | 1 | |
| Baja Fresh Mexican Grill | 1 | Olive Garden | 1 | |
| Banana Republic | 1 | Pac Sun | 1 | |
| Baskin-Robbins | 1 | Penske | 1 | |
| Blockbuster | 1 | Pottery Barn | 1 | |
| Brooks Brothers | 1 | Pottery Barn Kids | 1 | |
| Brookstone | 1 | Quality | 1 | |
| Budget Car Rental | 1 | Quiznos | 1 | |
| CVS | 3 | RadioShack | 1 | |
| Cache | 1 | SAS Shoes | 1 | |
| Chico's | 1 | Safeway | 1 | |
| Chipotle | 1 | Sephora | 1 | |
| Cold Stone Creamery | 1 | Sheraton | 1 | |
| Coldwater Creek | 1 | Sprint Nextel | 1 | |
| Comfort Inn | 1 | Starbucks | 7 | |
| Crate & Barrel | 1 | Subway | 3 | |
| Days Inn | 1 | Super 8 | 1 | |
| Domino's Pizza | 1 | T-Mobile | 4 | |
| Express | 1 | Taco Bell | 3 | |
| FedEx | 15 | Talbots | 1 | |
| Foot Locker | 1 | The Cheesecake Factory | 1 | |
| GNC | 1 | Toyota | 1 | |
| GameStop | 1 | Trader Joe's | 1 | |
| Gap | 2 | Travelodge | 1 | |
| Goodwill | 3 | U-Haul | 1 | |
| Gymboree | 1 | UPS | 11 | |
| H&R Block | 1 | Urban Outfitters | 1 | |
| Haagen-Dazs | 1 | Vans | 5 | |
| Holiday Inn | 1 | Verizon Wireless | 1 | |
| Honda | 1 | Victoria's Secret | 1 | |
| J. Jill | 1 | Vons | 1 | |
| J.Crew | 1 | Walgreens | 3 | |
| Jamba Juice | 4 | Westin | 1 | |
| JoS. A. Bank | 1 | Whole Foods Market | 1 | |
| Jones New York | 4 | YMCA | 2 | |
| Juicy Couture | 1 | |||
Strongest AM radio stations in Palo Alto:
- KGO (810 AM; 50 kW; SAN FRANCISCO, CA; Owner: KGO-AM RADIO, INC.)
- KNBR (680 AM; 50 kW; SAN FRANCISCO, CA; Owner: KNBR LICO, INC.)
- KYCY (1550 AM; 50 kW; SAN FRANCISCO, CA; Owner: INFINITY BROADCASTING OPERATIONS, INC.)
- KSFB (1220 AM; 5 kW; PALO ALTO, CA; Owner: SCA-PALO ALTO, LLC)
- KTCT (1050 AM; 50 kW; SAN MATEO, CA; Owner: SUSQUEHANNA RADIO CORP.)
- KFAX (1100 AM; 50 kW; SAN FRANCISCO, CA; Owner: GOLDEN GATE BROADCASTING CO, INC.)
- KLOK (1170 AM; 50 kW; SAN JOSE, CA; Owner: ENTRAVISION HOLDINGS, LLC)
- KTRB (860 AM; 50 kW; MODESTO, CA; Owner: PAPPAS RADIO OF CALIFORNIA, A CALIFORNIA LIMITED PARTNERSHIP)
- KIQI (1010 AM; 35 kW; SAN FRANCISCO, CA; Owner: RADIO UNICA OF SAN FRANCISCO LICENSE CORP.)
- KSJX (1500 AM; 10 kW; SAN JOSE, CA; Owner: MULTICULTURAL RADIO BROADCASTING INC)
- KCBS (740 AM; 50 kW; SAN FRANCISCO, CA; Owner: INFINITY BROADCASTING OPERATIONS, INC.)
- KNEW (910 AM; 20 kW; OAKLAND, CA; Owner: AMFM RADIO LICENSES, L.L.C.)
- KZSF (1370 AM; 5 kW; SAN JOSE, CA; Owner: CARLOS A. DUHARTE)
Strongest FM radio stations in Palo Alto:
- KFJC (89.7 FM; LOS ALTOS, CA; Owner: FOOTHILL-DE ANZA COMM. COLLEGE DIST.)
- KBAA (94.5 FM; GILROY, CA; Owner: INFINITY RADIO OPERATIONS INC.)
- KZBR-FM2 (95.7 FM; LIVERMORE, ETC., CA; Owner: BONNEVILLE HOLDING COMPANY)
- KSQL (99.1 FM; SANTA CRUZ, CA; Owner: TMS LICENSE CALIFORNIA, INC)
- KKUP (91.5 FM; CUPERTINO, CA; Owner: ASSURANCE SCIENCES FOUNDATION)
- KBRG (100.3 FM; SAN JOSE, CA; Owner: ENTRAVISION HOLDINGS, LLC)
- KKSF-FM1 (103.7 FM; PLEASANTON, ETC., CA; Owner: AMFM RADIO LICENSES, L.L.C.)
- KFRC-FM3 (99.7 FM; WALNUT CREEK, CA; Owner: INFINITY KFRC-FM, INC.)
- KZBR-FM1 (95.7 FM; WALNUT CREEK, CA; Owner: BONNEVILLE HOLDING COMPANY)
- KBLX-FM2 (102.9 FM; PLEASANTON, CA; Owner: ICBC BROADCAST HOLDINGS -CA, INC.)
- KSOL-FM3 (98.9 FM; PLEASANTON, CA; Owner: TMS LICENSE CALIFORNIA, INC)
- KISQ-FM3 (98.1 FM; CONCORD, CA; Owner: AMFM RADIO LICENSES, L.L.C.)
- KFFG (97.7 FM; LOS ALTOS, CA; Owner: KFFG LICO, INC.)
- KMEL-FM1 (106.1 FM; CONCORD, CA; Owner: AMFM RADIO LICENSES, L.L.C.)
- KTEE (93.7 FM; FELTON, CA; Owner: MAPLETON COMMUNICATIONS, L.L.C.)
- KYLD (94.9 FM; SAN FRANCISCO, CA; Owner: AMFM RADIO LICENSES, L.L.C.)
- K238AC (95.5 FM; SALIDA, CA; Owner: FAMILY STATIONS, INC.)
- KFRC-FM (99.7 FM; SAN FRANCISCO, CA; Owner: INFINITY KFRC-FM, INC.)
- KBLX-FM (102.9 FM; BERKELEY, CA; Owner: ICBC BROADCAST HOLDINGS - CA, INC.)
- KZBR (95.7 FM; SAN FRANCISCO, CA; Owner: BONNEVILLE HOLDING COMPANY)
TV broadcast stations around Palo Alto:
- KQED (Channel 9; SAN FRANCISCO, CA; Owner: KQED, INC.)
- KBIT-CA (Channel 28; SAN FRANCISCO, ETC., CA; Owner: POLAR BROADCASTING, INC.)
- KICU-TV (Channel 36; SAN JOSE, CA; Owner: KTVU PARTNERSHIP)
- KGO-TV (Channel 7; SAN FRANCISCO, CA; Owner: KGO TELEVISION, INC.)
- KPIX-TV (Channel 5; SAN FRANCISCO, CA; Owner: CBS BROADCASTING INC.)
- KTVU (Channel 2; OAKLAND, CA; Owner: KTVU PARTNERSHIP)
- KTEH (Channel 54; SAN JOSE, CA; Owner: KTEH FOUNDATION)
- KDTV (Channel 14; SAN FRANCISCO, CA; Owner: KDTV LICENSE PARTNERSHIP, G.P.)
- KSTS (Channel 48; SAN JOSE, CA; Owner: TELEMUNDO OF NORTHERN CALIFORNIA LICENSE CORP.)
- KRON-TV (Channel 4; SAN FRANCISCO, CA; Owner: YOUNG BROADCASTING OF SAN FRANCISCO, INC.)
- KMTP-TV (Channel 32; SAN FRANCISCO, CA; Owner: MINORITY TELEVISION PROJECT)
- KBHK-TV (Channel 44; SAN FRANCISCO, CA; Owner: VIACOM TELEVISION STATIONS GROUP OF SAN FRANCISCO INC.)
- KCSM-TV (Channel 60; SAN MATEO, CA; Owner: SAN MATEO COUNTY COMMUNITY COLLEGE DISTRICT)
- KBWB (Channel 20; SAN FRANCISCO, CA; Owner: KBWB LICENSE, INC.)
- KFSF (Channel 66; VALLEJO, CA; Owner: TELEFUTURA SAN FRANCISCO LLC)
- KCNS (Channel 38; SAN FRANCISCO, CA; Owner: WRAY, INC.)
- National Bridge Inventory (NBI) Statistics
- 74Number of bridges
- 377ft / 115mTotal length
- $3,772,000Total costs
- 2,201,565Total average daily traffic
- 99,908Total average daily truck traffic
- New bridges - historical statistics
- 51910-1919
- 21920-1929
- 41930-1939
- 61940-1949
- 61950-1959
- 321960-1969
- 31970-1979
- 91980-1989
- 21990-1999
- 32000-2009
- 22010-2019
FCC Registered Antenna Towers: 85 (See the full list of FCC Registered Antenna Towers)
FCC Registered Commercial Land Mobile Towers: 1 (See the full list of FCC Registered Commercial Land Mobile Towers in Palo Alto, CA)
FCC Registered Private Land Mobile Towers: 4 (See the full list of FCC Registered Private Land Mobile Towers)
FCC Registered Broadcast Land Mobile Towers: 72 (See the full list of FCC Registered Broadcast Land Mobile Towers)
FCC Registered Microwave Towers: 115 (See the full list of FCC Registered Microwave Towers in this town)
FCC Registered Paging Towers: 15 (See the full list of FCC Registered Paging Towers)
FCC Registered Maritime Coast & Aviation Ground Towers: 3 (See the full list of FCC Registered Maritime Coast & Aviation Ground Towers)
FCC Registered Amateur Radio Licenses: 1,166 (See the full list of FCC Registered Amateur Radio Licenses in Palo Alto)
FAA Registered Aircraft Manufacturers and Dealers: 8 (See the full list of FAA Registered Manufacturers and Dealers in Palo Alto)
FAA Registered Aircraft: 193 (See the full list of FAA Registered Aircraft)
| Home Mortgage Disclosure Act Aggregated Statistics For Year 2009 (Based on 11 full and 8 partial tracts) | ||||||||||||||
| A) FHA, FSA/RHS & VA Home Purchase Loans | B) Conventional Home Purchase Loans | C) Refinancings | D) Home Improvement Loans | E) Loans on Dwellings For 5+ Families | F) Non-occupant Loans on < 5 Family Dwellings (A B C & D) | G) Loans On Manufactured Home Dwelling (A B C & D) | ||||||||
|---|---|---|---|---|---|---|---|---|---|---|---|---|---|---|
| Number | Average Value | Number | Average Value | Number | Average Value | Number | Average Value | Number | Average Value | Number | Average Value | Number | Average Value | |
| LOANS ORIGINATED | 9 | $564,401 | 527 | $712,267 | 3,062 | $512,203 | 73 | $393,424 | 4 | $1,152,422 | 125 | $422,554 | 3 | $72,577 |
| APPLICATIONS APPROVED, NOT ACCEPTED | 0 | $0 | 58 | $657,991 | 384 | $523,157 | 10 | $388,168 | 0 | $0 | 15 | $494,539 | 1 | $112,000 |
| APPLICATIONS DENIED | 1 | $742,000 | 83 | $744,521 | 542 | $637,068 | 20 | $429,914 | 0 | $0 | 42 | $444,203 | 2 | $98,000 |
| APPLICATIONS WITHDRAWN | 2 | $500,395 | 74 | $691,142 | 352 | $570,735 | 21 | $230,997 | 0 | $0 | 19 | $359,557 | 0 | $0 |
| FILES CLOSED FOR INCOMPLETENESS | 2 | $726,500 | 13 | $623,549 | 111 | $527,551 | 6 | $431,190 | 0 | $0 | 4 | $461,100 | 0 | $0 |
Detailed mortgage data for all 19 tracts in Palo Alto, CA
| Private Mortgage Insurance Companies Aggregated Statistics For Year 2009 (Based on 2 full and 4 partial tracts) | ||||
| A) Conventional Home Purchase Loans | B) Refinancings | |||
|---|---|---|---|---|
| Number | Average Value | Number | Average Value | |
| LOANS ORIGINATED | 5 | $407,818 | 0 | $0 |
| APPLICATIONS APPROVED, NOT ACCEPTED | 5 | $195,428 | 1 | $412,000 |
| APPLICATIONS DENIED | 3 | $497,770 | 0 | $0 |
| APPLICATIONS WITHDRAWN | 2 | $307,500 | 0 | $0 |
| FILES CLOSED FOR INCOMPLETENESS | 0 | $0 | 0 | $0 |
2007 - 2018 National Fire Incident Reporting System (NFIRS) incidents
- Fire incident types reported to NFIRS in Palo Alto, CA
- 39640.0%Structure Fires
- 34434.7%Outside Fires
- 13613.7%Mobile Property/Vehicle Fires
- 11511.6%Other
 According to the data from the years 2007 - 2018 the average number of fires per year is 82. The highest number of reported fire incidents - 142 took place in 2016, and the least - 16 in 2008. The data has an increasing trend.
 When looking into fire subcategories, the most incidents belonged to: Structure Fires (40.0%), and Outside Fires (34.7%).
Fire-safe hotels and motels in Palo Alto, California:
- Quality Inn Palo Alto, 3901 El Camino Real, Palo Alto, California 94306 , Phone: (650) 493-2760, Fax: (650) 494-7833
- Comfort Inn Palo Alto, 3945 El Camino Real, Palo Alto, California 94306 , Phone: (650) 493-3141, Fax: (650) 493-6313
- Crowne Plaza Cabana Hotel Palo Alto, 4290 El Camino Real, Palo Alto, California 94306 , Phone: (650) 857-0787, Fax: (650) 628-0195
- Palo Alto Travelodge, 3255 El Camino Real, Palo Alto, California 94306 , Phone: (650) 493-6340, Fax: (650) 424-9535
- Dinah's Garden Hotel, 4261 El Camino Real, Palo Alto, California 94306 , Phone: (650) 493-2844, Fax: (650) 856-4713
- Creekside Inn Hotel, 3400 El Camino Real, Palo Alto, California 94306 , Phone: (650) 493-2411, Fax: (650) 493-6787
- Americas Best Value Sky Ranch Inn, 4234 El Camino Real, Palo Alto, California 94306 , Phone: (650) 493-7221, Fax: (650) 493-0858
- Hotel Keen, 425 High St, Palo Alto, California 94301 , Phone: (650) 327-2775, Fax: (650) 327-1012
- 4 other hotels and motels
| Most common first names in Palo Alto, CA among deceased individuals | ||
| Name | Count | Lived (average) |
|---|---|---|
| John | 478 | 74.3 years |
| Mary | 434 | 79.9 years |
| William | 367 | 74.3 years |
| James | 322 | 73.2 years |
| Robert | 317 | 72.3 years |
| Helen | 261 | 82.8 years |
| George | 258 | 77.5 years |
| Margaret | 213 | 82.1 years |
| Ruth | 206 | 81.5 years |
| Charles | 201 | 75.9 years |
| Most common last names in Palo Alto, CA among deceased individuals | ||
| Last name | Count | Lived (average) |
|---|---|---|
| Smith | 181 | 76.8 years |
| Johnson | 133 | 76.8 years |
| Williams | 118 | 70.5 years |
| Miller | 91 | 76.6 years |
| Brown | 90 | 78.1 years |
| Jones | 87 | 71.6 years |
| Anderson | 83 | 77.9 years |
| Davis | 80 | 77.2 years |
| Wilson | 74 | 77.2 years |
| Thomas | 71 | 75.1 years |
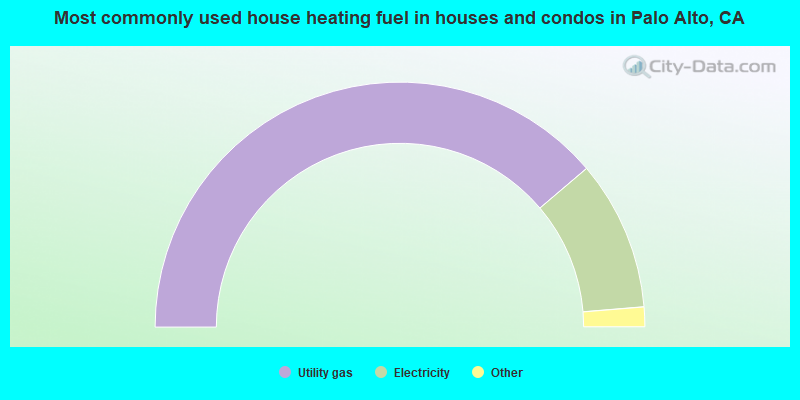
- 77.6%Utility gas
- 19.8%Electricity
- 1.5%Bottled, tank, or LP gas
- 0.6%Solar energy
- 0.2%Wood
- 0.2%Other fuel
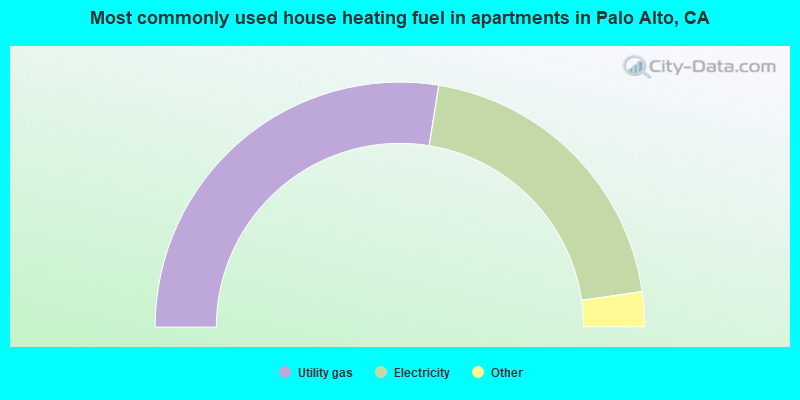
- 55.1%Utility gas
- 40.3%Electricity
- 2.8%No fuel used
- 1.0%Bottled, tank, or LP gas
- 0.4%Solar energy
- 0.2%Other fuel
- 0.1%Fuel oil, kerosene, etc.
Palo Alto compared to California state average:
- Median household income above state average.
- Median house value significantly above state average.
- Unemployed percentage significantly below state average.
- Black race population percentage below state average.
- Hispanic race population percentage significantly below state average.
- Median age significantly above state average.
- Length of stay since moving in above state average.
- Percentage of population with a bachelor's degree or higher significantly above state average.
Palo Alto on our top lists:
- #1 on the list of "Top 100 best educated cities (highest percentage of bachelor degree holding residents) (pop. 50,000+)"
- #1 on the list of "Top 101 cities with the most people having Master's or Doctorate degrees (population 50,000+)"
- #4 on the list of "Top 101 cities with the most people having professional degrees (population 50,000+)"
- #4 on the list of "Top 101 cities with largest percentage of females in industries: information (population 50,000+)"
- #4 on the list of "Top 100 cities with highest median house value (pop. 50,000+)"
- #5 on the list of "Top 101 cities that people commute into (largest positive percentage daily daytime population change due to commuting) (population 50,000+)"
- #5 on the list of "Top 101 cities with largest percentage of males in industries: professional, scientific, and technical services (population 50,000+)"
- #7 on the list of "Top 101 cities with largest percentage of females in occupations: legal occupations (population 50,000+)"
- #7 on the list of "Top 101 cities with largest percentage of females in occupations: arts, design, entertainment, sports, and media occupations (population 50,000+)"
- #7 on the list of "Top 101 cities with largest percentage of males in occupations: management occupations (population 50,000+)"
- #7 on the list of "Top 101 cities with the most people having Doctorate degrees (population 50,000+)"
- #8 on the list of "Top 101 cities with largest percentage of males in industries: information (population 50,000+)"
- #8 on the list of "Top 101 cities with largest percentage of females in occupations: life, physical, and social science occupations (population 50,000+)"
- #8 on the list of "Top 100 cities with highest median household income (pop. 50,000+)"
- #10 on the list of "Top 101 cities with largest percentage of males in occupations: life, physical, and social science occupations (population 50,000+)"
- #11 on the list of "Top 101 cities with largest percentage of females in occupations: management occupations (population 50,000+)"
- #13 on the list of "Top 101 cities with the lowest number of murders per 100,000 residents (population 50,000+)"
- #17 on the list of "Top 101 cities with the largest humidity differences during a year (population 50,000+)"
- #17 on the list of "Top 101 cities with the largest differences between morning and afternoon humidity (population 50,000+)"
- #18 on the list of "Top 101 cities with the highest cost per building permit(population 50,000+)"
- #3 (94301) on the list of "Top 101 zip codes with the highest 2012 average Adjusted Gross Income (AGI) for individuals (pop 5,000+)"
- #6 (94301) on the list of "Top 101 zip codes with the highest 2012 average net capital gain/loss (pop 5,000+)"
- #7 (94301) on the list of "Top 101 zip codes with the highest average reported salary/wage in 2012 (pop 5,000+)"
- #43 (94301) on the list of "Top 101 zip codes with the largest percentage of taxpayers reporting net capital gain/loss in 2012 (pop 5,000+)"
- #58 (94305) on the list of "Top 101 zip codes with the highest 2012 average reported profit/loss from business (pop 5,000+)"
- #85 (94301) on the list of "Top 101 zip codes with the highest 2012 average taxable interest for individuals (pop 5,000+)"
- #89 (94301) on the list of "Top 101 zip codes with the largest percentage of taxpayers reporting taxable interest in 2012 (pop 5,000+)"
- #96 (94305) on the list of "Top 101 zip codes with the largest percentage of Welsh first ancestries (pop 5,000+)"
- #97 (94301) on the list of "Top 101 zip codes with the largest charity contributions deductions as a percentage of AGI in 2012 (pop 5,000+)"
- #5 on the list of "Top 101 counties with the highest percentage of residents that visited a dentist within the past year"
- #9 on the list of "Top 101 counties with the lowest percentage of residents that smoked 100+ cigarettes in their lives"
- #16 on the list of "Top 101 counties with the most Other adherents"
- #16 on the list of "Top 101 counties with the most Catholic adherents"
- #17 on the list of "Top 101 counties with the highest percentage of residents that drank alcohol in the past 30 days"

|
|
Total of 30945 patent applications in 2008-2024.