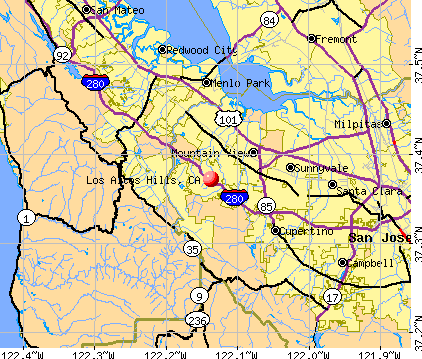
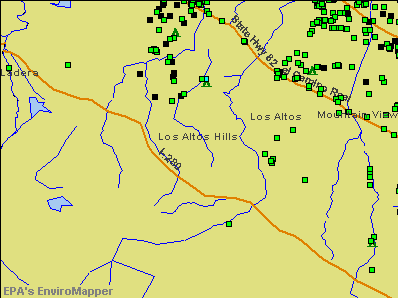
Los Altos Hills, California

Submit your own pictures of this town and show them to the world
- OSM Map
- General Map
- Google Map
- MSN Map
Population change since 2000: +3.4%
 |
| Males: 3,716 | |
| Females: 4,452 |
| Median resident age: | 54.4 years |
| California median age: | 37.9 years |
Zip codes: 94304.
| Los Altos Hills: | over $200,000 |
| CA: | $91,551 |
Estimated per capita income in 2022: $177,489 (it was $92,840 in 2000)
Los Altos Hills town income, earnings, and wages data
Estimated median house or condo value in 2022: over $1,000,000 (it was over $1,000,000 in 2000)
| Los Altos Hills: | over $1,000,000 |
| CA: | $715,900 |
Mean prices in 2022: all housing units: over $1,000,000; detached houses: over $1,000,000; townhouses or other attached units: over $1,000,000
Median gross rent in 2022: $3,378.
Los Altos Hills, CA residents, houses, and apartments details
(1.8% for White Non-Hispanic residents, 4.8% for Hispanic or Latino residents, 50.0% for other race residents, 4.4% for two or more races residents)
Detailed information about poverty and poor residents in Los Altos Hills, CA
Compare current foreclosures near Los Altos Hills, CA:
| Photo | Address | Area | Beds / Baths | Price | Details |
|---|---|---|---|---|---|

|
#1
Dewey Pl
Fremont, CA 94538
|
1,232 sq. feet
|
2 baths 3 beds |
show details | |

|
#2
N 11th St
San Jose, CA 95112
|
1,468 sq. feet
|
1 baths 2 beds |
show details | |

|
#3
E Julian St
San Jose, CA 95112
|
1,488 sq. feet
|
2 baths 3 beds |
show details | |

|
#4
Bellwood Dr
Santa Clara, CA 95054
|
2,010 sq. feet
|
2 baths 5 beds |
show details | |

|
#5
Clayton Ave
San Jose, CA 95110
|
1,024 sq. feet
|
3 baths 6 beds |
show details | |

|
#6
Hempstead Pl
Redwood City, CA 94061
|
1,020 sq. feet
|
1 baths 3 beds |
show details | |

|
#7
Russell Ln
Milpitas, CA 95035
|
2,144 sq. feet
|
2 baths 4 beds |
show details | |

|
#8
Pescadero Ct
Milpitas, CA 95035
|
1,773 sq. feet
|
2 baths 4 beds |
show details | |

|
#9
7th Ave
Menlo Park, CA 94025
|
1,689 sq. feet
|
2 baths 3 beds |
show details | |

|
#10
E Mission St Unit 115
San Jose, CA 95112
|
1,253 sq. feet
|
1 baths 1 beds |
show details |
| Photo | Address | Area | Beds / Baths | Price | Details |
|---|---|---|---|---|---|

|
#11
Middlefield Ave
Fremont, CA 94539
|
3,624 sq. feet
|
2 baths 3 beds |
show details | |

|
#12
La Rhee Dr
San Jose, CA 95124
|
2,191 sq. feet
|
2 baths 5 beds |
show details | |

|
#13
Alameda De Las Pulgas
Redwood City, CA 94061
|
1,250 sq. feet
|
2 baths 3 beds |
show details | |

|
#14
Chestnut St
San Carlos, CA 94070
|
1,390 sq. feet
|
2 baths 3 beds |
show details | |

|
#15
Chapman St
San Jose, CA 95126
|
2,162 sq. feet
|
2 baths 3 beds |
show details | |

|
#16
Saratoga Ave
Palo Alto, CA 94303
|
750 sq. feet
|
1 baths 3 beds |
show details | |

|
#17
Toyonita Rd
Los Altos, CA 94024
|
4,833 sq. feet
|
3 baths 5 beds |
show details | |

|
#18
Mulberry St
Newark, CA 94560
|
984 sq. feet
|
1 baths 3 beds |
show details | |

|
#19
Fruitdale Ave
San Jose, CA 95128
|
990 sq. feet
|
1 baths 2 beds |
show details | |

|
#20
Singletary Ave
San Jose, CA 95126
|
1,136 sq. feet
|
1 baths 2 beds |
show details |
| Photo | Address | Area | Beds / Baths | Price | Details |
|---|---|---|---|---|---|

|
#21
E Julian St
San Jose, CA 95112
|
1,488 sq. feet
|
2 baths 3 beds |
show details | |

|
#22
Bolinger Cmn # 94
Fremont, CA 94539
|
926 sq. feet
|
1 baths 1 beds |
show details | |

|
#23
Cabral Dr
Fremont, CA 94536
|
1,150 sq. feet
|
2 baths 3 beds |
show details | |

|
#24
Bret Harte Ct
Fremont, CA 94538
|
1,541 sq. feet
|
2 baths 3 beds |
show details | |

|
#25
Nelson St
Fremont, CA 94538
|
3,884 sq. feet
|
5 baths 4 beds |
show details | |

|
#26
Singley Dr
Milpitas, CA 95035
|
1,545 sq. feet
|
2 baths 3 beds |
show details | |

|
#27
Towers Way
Fremont, CA 94536
|
747 sq. feet
|
1 baths 2 beds |
show details | |

|
#28
Washington Dr
Milpitas, CA 95035
|
1,358 sq. feet
|
2 baths 4 beds |
show details | |

|
#29
Gordy Dr
San Jose, CA 95131
|
1,634 sq. feet
|
2 baths 4 beds |
show details | |

|
#30
Rockwood Dr
Fremont, CA 94536
|
1,066 sq. feet
|
2 baths 2 beds |
show details |
| Photo | Address | Area | Beds / Baths | Price | Details |
|---|---|---|---|---|---|

|
#31
Valmy St
Milpitas, CA 95035
|
2,050 sq. feet
|
2 baths 3 beds |
show details | |

|
#32
Cerro Chico
Los Gatos, CA 95030
|
2,379 sq. feet
|
3 baths 4 beds |
show details | |

|
#33
Northdale Dr
Fremont, CA 94536
|
2,196 sq. feet
|
2 baths 3 beds |
show details | |

|
#34
Libretto Ct
San Jose, CA 95131
|
2,121 sq. feet
|
3 baths 5 beds |
show details | |

|
#35
San Juan Blvd
Belmont, CA 94002
|
1,430 sq. feet
|
2 baths 3 beds |
show details | |

|
#36
Balsa Ave
San Jose, CA 95124
|
1,478 sq. feet
|
2 baths 3 beds |
show details | |

|
#37
Fallingtree Dr
San Jose, CA 95131
|
1,234 sq. feet
|
2 baths 4 beds |
show details | |

|
#38
Settle Ave
San Jose, CA 95125
|
1,850 sq. feet
|
2 baths 3 beds |
show details | |

|
#39
Glenmoor Dr
Fremont, CA 94536
|
4,680 sq. feet
|
4 baths 8 beds |
show details | |

|
#40
Siward Dr
Fremont, CA 94555
|
1,647 sq. feet
|
2 baths 4 beds |
show details |
| Photo | Address | Area | Beds / Baths | Price | Details |
|---|---|---|---|---|---|

|
#41
Phoenix Ln
San Mateo, CA 94404
|
1,603 sq. feet
|
2 baths 2 beds |
show details | |

|
#42
Yesler Ct
San Jose, CA 95131
|
2,756 sq. feet
|
3 baths 4 beds |
show details | |

|
#43
Radio Ave
San Jose, CA 95125
|
1,666 sq. feet
|
3 baths 3 beds |
show details | |

|
#44
Snake River Pl
Fremont, CA 94555
|
1,476 sq. feet
|
2 baths 4 beds |
show details | |

|
#45
Traughber St
Milpitas, CA 95035
|
1,186 sq. feet
|
2 baths 4 beds |
show details | |

|
#46
Fallwood Ln
San Jose, CA 95132
|
1,165 sq. feet
|
2 baths 3 beds |
show details | |

|
#47
Canton Dr
Milpitas, CA 95035
|
1,867 sq. feet
|
2 baths 4 beds |
show details | |

|
#48
Davis St
Fremont, CA 94538
|
1,201 sq. feet
|
2 baths 3 beds |
show details | |

|
#49
Seville Way
San Jose, CA 95131
|
1,168 sq. feet
|
2 baths 4 beds |
show details | |

|
Check over 1 million property listings on Foreclosure.com!
|
browse all offers | |||


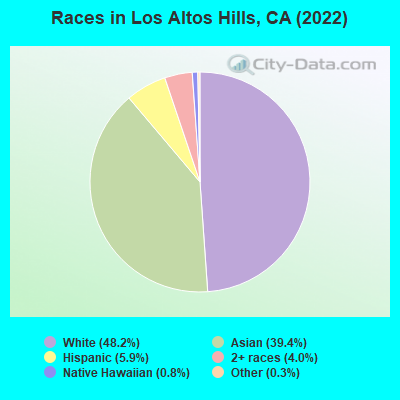
- 3,97148.2%White alone
- 3,24939.4%Asian alone
- 4895.9%Hispanic
- 3304.0%Two or more races
- 630.8%Native Hawaiian and Other
Pacific Islander alone - 260.3%Other race alone
According to our research of California and other state lists, there was 1 registered sex offender living in Los Altos Hills, California as of April 27, 2024.
The ratio of all residents to sex offenders in Los Altos Hills is 8,528 to 1.
The ratio of registered sex offenders to all residents in this city is much lower than the state average.
Type |
2009 |
2010 |
2011 |
2012 |
2013 |
2014 |
2015 |
2016 |
2017 |
2018 |
2019 |
2020 |
2022 |
|---|---|---|---|---|---|---|---|---|---|---|---|---|---|
| Murders (per 100,000) | 0 (0.0) | 0 (0.0) | 0 (0.0) | 0 (0.0) | 0 (0.0) | 0 (0.0) | 0 (0.0) | 0 (0.0) | 0 (0.0) | 0 (0.0) | 0 (0.0) | 0 (0.0) | 0 (0.0) |
| Rapes (per 100,000) | 0 (0.0) | 0 (0.0) | 1 (12.5) | 0 (0.0) | 1 (12.0) | 0 (0.0) | 0 (0.0) | 2 (23.5) | 1 (11.7) | 0 (0.0) | 1 (11.6) | 2 (23.6) | 2 (24.7) |
| Robberies (per 100,000) | 0 (0.0) | 0 (0.0) | 0 (0.0) | 1 (12.3) | 0 (0.0) | 1 (11.9) | 1 (11.8) | 0 (0.0) | 0 (0.0) | 2 (23.1) | 0 (0.0) | 2 (23.6) | 0 (0.0) |
| Assaults (per 100,000) | 3 (34.8) | 1 (12.6) | 3 (37.4) | 4 (49.3) | 1 (12.0) | 1 (11.9) | 0 (0.0) | 4 (47.1) | 1 (11.7) | 5 (57.8) | 2 (23.2) | 2 (23.6) | 0 (0.0) |
| Burglaries (per 100,000) | 14 (162.2) | 19 (239.8) | 33 (411.7) | 19 (234.0) | 47 (566.3) | 49 (582.8) | 24 (282.9) | 41 (482.6) | 22 (256.4) | 29 (335.0) | 29 (336.3) | 33 (389.9) | 54 (668.0) |
| Thefts (per 100,000) | 24 (278.0) | 26 (328.2) | 26 (324.4) | 23 (283.2) | 35 (421.7) | 24 (285.4) | 32 (377.1) | 22 (259.0) | 36 (419.6) | 17 (196.4) | 38 (440.7) | 24 (283.6) | 22 (272.1) |
| Auto thefts (per 100,000) | 1 (11.6) | 0 (0.0) | 2 (25.0) | 3 (36.9) | 1 (12.0) | 0 (0.0) | 4 (47.1) | 0 (0.0) | 1 (11.7) | 2 (23.1) | 0 (0.0) | 2 (23.6) | 1 (12.4) |
| Arson (per 100,000) | 0 (0.0) | 0 (0.0) | 3 (37.4) | 0 (0.0) | 3 (36.1) | 4 (47.6) | 2 (23.6) | 3 (35.3) | 4 (46.6) | 2 (23.1) | 0 (0.0) | 0 (0.0) | 10 (123.7) |
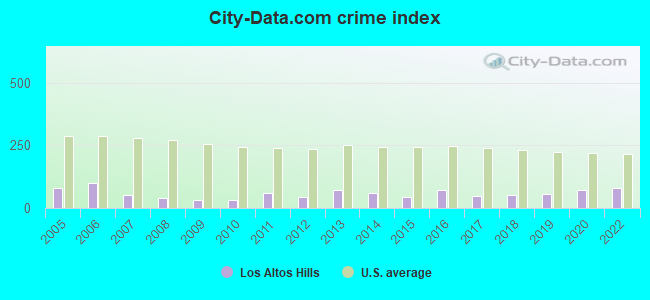
| City-Data.com crime index | 30.4 | 32.4 | 61.3 | 44.2 | 69.5 | 58.2 | 42.2 | 72.4 | 47.3 | 51.6 | 55.1 | 71.2 | 78.4 |
The City-Data.com crime index weighs serious crimes and violent crimes more heavily. Higher means more crime, U.S. average is 246.1. It adjusts for the number of visitors and daily workers commuting into cities.
Crime rate in Los Altos Hills detailed stats: murders, rapes, robberies, assaults, burglaries, thefts, arson
Full-time law enforcement employees in 2015, including police officers: 1 (1 officers - 1 male; 0 female).
| Officers per 1,000 residents here: | 0.12 |
| California average: | 1.98 |
 Recent articles from our blog. Our writers, many of them Ph.D. graduates or candidates, create easy-to-read articles on a wide variety of topics.


Latest news from Los Altos Hills, CA collected exclusively by city-data.com from local newspapers, TV, and radio stations
Ancestries: European (6.4%), Iranian (4.1%), English (3.7%), American (2.6%), German (2.3%), Danish (2.2%).
Current Local Time: PST time zone
Incorporated on 01/27/1956
Elevation: 240 feet
Land area: 8.62 square miles.
Population density: 948 people per square mile (low).
3,047 residents are foreign born (25.0% Asia, 5.7% Europe).
| This town: | 37.0% |
| California: | 26.5% |
Median real estate property taxes paid for housing units with mortgages in 2022: $10,001 (0.4%)
Median real estate property taxes paid for housing units with no mortgage in 2022: $10,488 (0.5%)
Nearest city with pop. 50,000+: Mountain View, CA  (3.4 miles , pop. 70,708).
Nearest city with pop. 200,000+: Fremont, CA (14.6 miles , pop. 203,413).
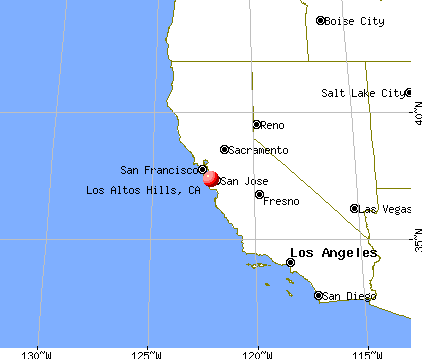
Nearest city with pop. 1,000,000+: Los Angeles, CA (310.2 miles , pop. 3,694,820).
Nearest cities:
), ), ), Latitude: 37.37 N, Longitude: 122.14 W
Daytime population change due to commuting: -1,204 (-14.6%)
Workers who live and work in this town: 1,468 (40.2%)
Area code commonly used in this area: 650

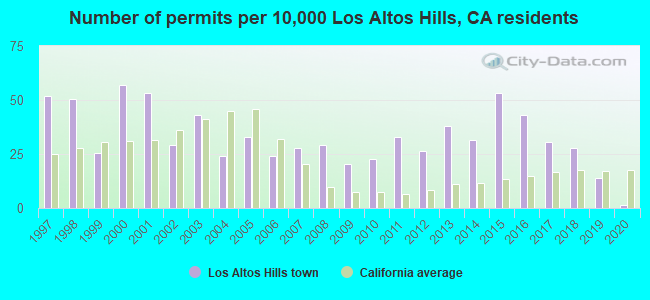
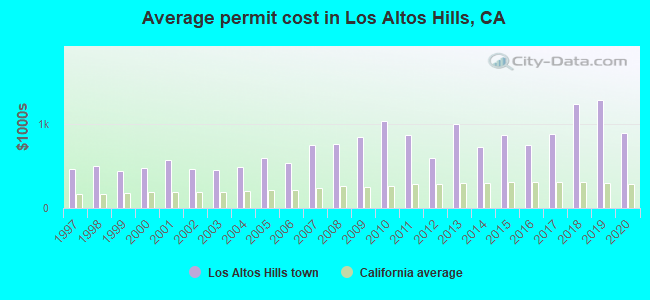
Single-family new house construction building permits:
- 2020: 1 building, cost: $882,700
- 2019: 11 buildings, average cost: $1,279,800
- 2018: 22 buildings, average cost: $1,236,000
- 2017: 24 buildings, average cost: $874,900
- 2016: 34 buildings, average cost: $750,600
- 2015: 42 buildings, average cost: $869,000
- 2014: 25 buildings, average cost: $724,900
- 2013: 30 buildings, average cost: $999,000
- 2012: 21 buildings, average cost: $597,800
- 2011: 26 buildings, average cost: $867,400
- 2010: 18 buildings, average cost: $1,024,800
- 2009: 16 buildings, average cost: $837,600
- 2008: 23 buildings, average cost: $752,600
- 2007: 22 buildings, average cost: $740,800
- 2006: 19 buildings, average cost: $531,200
- 2005: 26 buildings, average cost: $590,100
- 2004: 19 buildings, average cost: $486,200
- 2003: 34 buildings, average cost: $454,100
- 2002: 23 buildings, average cost: $457,700
- 2001: 42 buildings, average cost: $572,600
- 2000: 45 buildings, average cost: $471,500
- 1999: 20 buildings, average cost: $440,700
- 1998: 40 buildings, average cost: $491,600
- 1997: 41 buildings, average cost: $466,800
| Here: | 3.9% |
| California: | 5.1% |
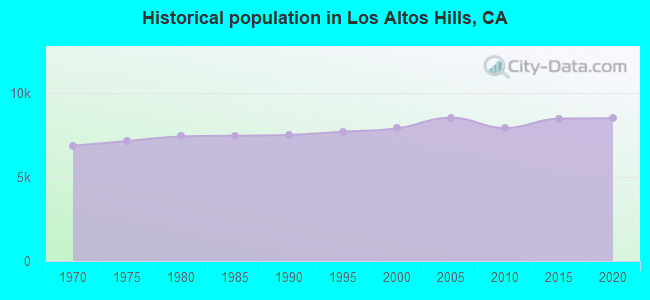
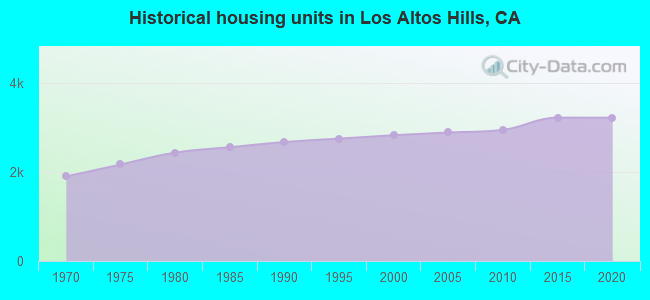
Population change in the 1990s: +471 (+6.3%).

- Professional, scientific, technical services (19.7%)
- Computer & electronic products (17.0%)
- Educational services (11.1%)
- Health care (10.7%)
- Finance & insurance (6.1%)
- Real estate & rental & leasing (3.5%)
- Data processing, libraries, other information services (2.8%)
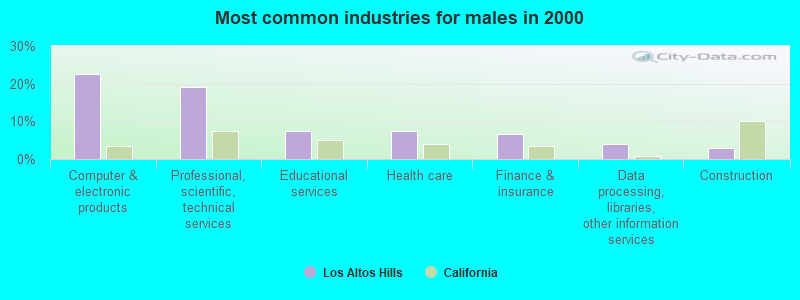
- Computer & electronic products (22.6%)
- Professional, scientific, technical services (19.0%)
- Educational services (7.6%)
- Health care (7.4%)
- Finance & insurance (6.5%)
- Data processing, libraries, other information services (4.1%)
- Construction (3.0%)
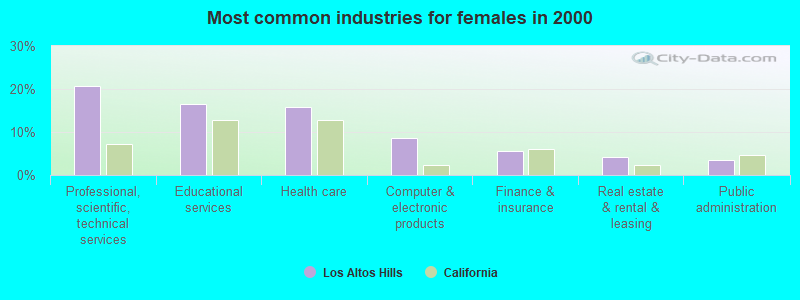
- Professional, scientific, technical services (20.8%)
- Educational services (16.4%)
- Health care (15.7%)
- Computer & electronic products (8.6%)
- Finance & insurance (5.5%)
- Real estate & rental & leasing (4.3%)
- Public administration (3.4%)

- Top executives (13.7%)
- Other management occupations, except farmers and farm managers (9.7%)
- Computer specialists (6.5%)
- Engineers (6.1%)
- Other sales and related occupations, including supervisors (4.9%)
- Physicians and surgeons (4.4%)
- Advertising, marketing, promotions, public relations, and sales managers (3.1%)
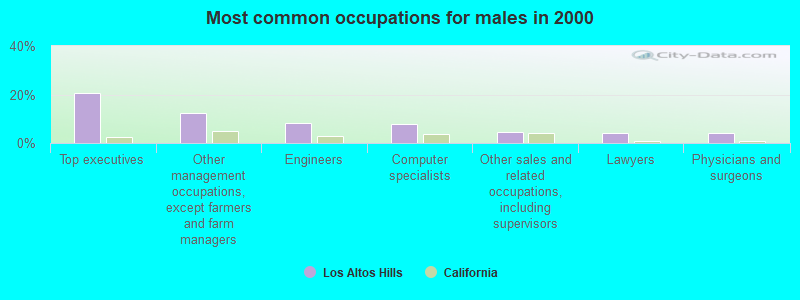
- Top executives (20.5%)
- Other management occupations, except farmers and farm managers (12.3%)
- Engineers (8.1%)
- Computer specialists (8.0%)
- Other sales and related occupations, including supervisors (4.7%)
- Lawyers (4.1%)
- Physicians and surgeons (4.1%)
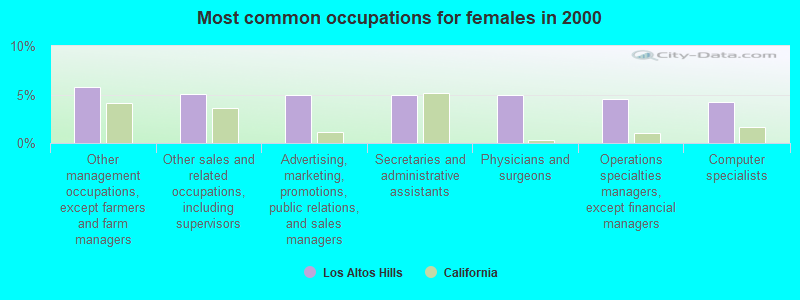
- Other management occupations, except farmers and farm managers (5.7%)
- Other sales and related occupations, including supervisors (5.0%)
- Advertising, marketing, promotions, public relations, and sales managers (4.9%)
- Secretaries and administrative assistants (4.9%)
- Physicians and surgeons (4.9%)
- Operations specialties managers, except financial managers (4.6%)
- Computer specialists (4.2%)
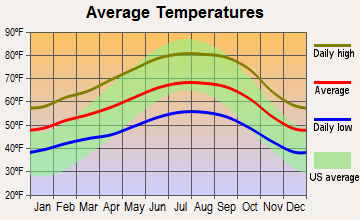
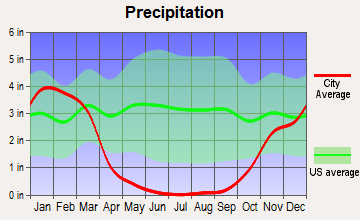
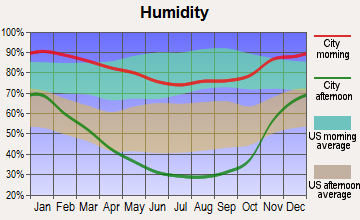
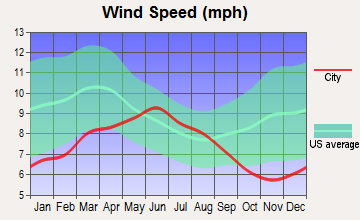
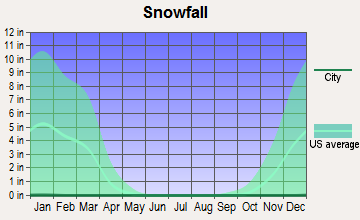
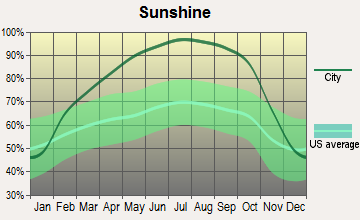
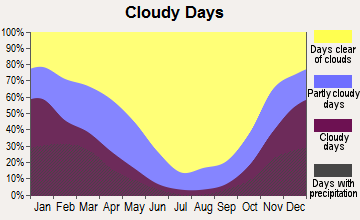
Average climate in Los Altos Hills, California
Based on data reported by over 4,000 weather stations
|
|

(lower is better)
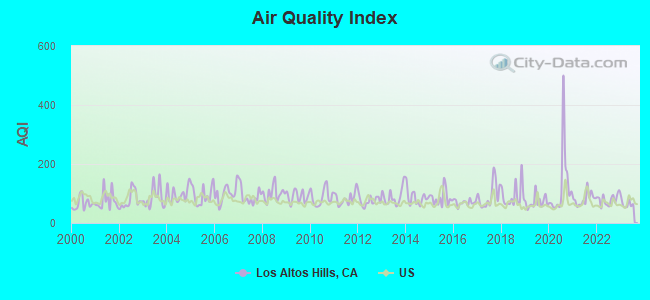
Air Quality Index (AQI) level in 2023 was 65.4. This is about average.
| City: | 65.4 |
| U.S.: | 72.6 |
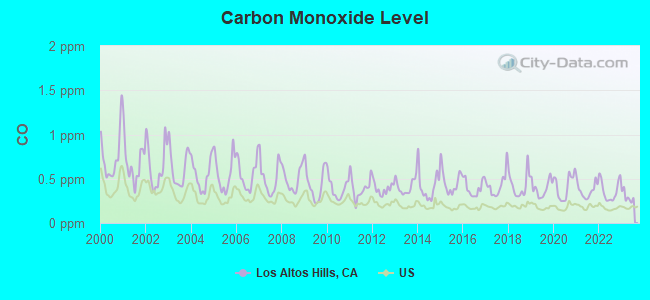
Carbon Monoxide (CO) [ppm] level in 2023 was 0.298. This is about average. Closest monitor was 5.2 miles away from the city center.
| City: | 0.298 |
| U.S.: | 0.251 |
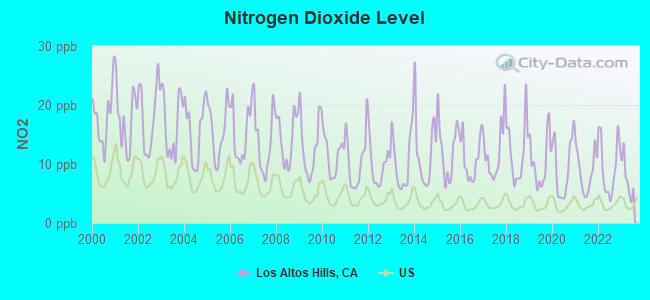
Nitrogen Dioxide (NO2) [ppb] level in 2023 was 7.57. This is significantly worse than average. Closest monitor was 5.2 miles away from the city center.
| City: | 7.57 |
| U.S.: | 5.11 |
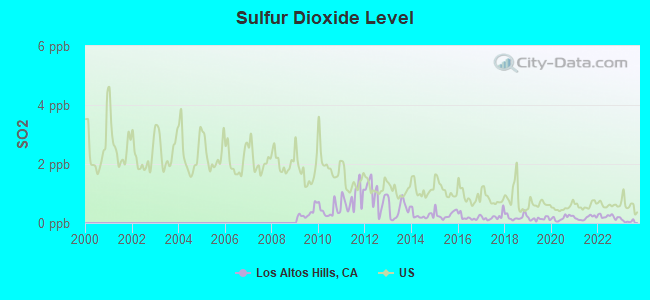
Sulfur Dioxide (SO2) [ppb] level in 2023 was 0.0660. This is significantly better than average. Closest monitor was 5.2 miles away from the city center.
| City: | 0.0660 |
| U.S.: | 1.5147 |
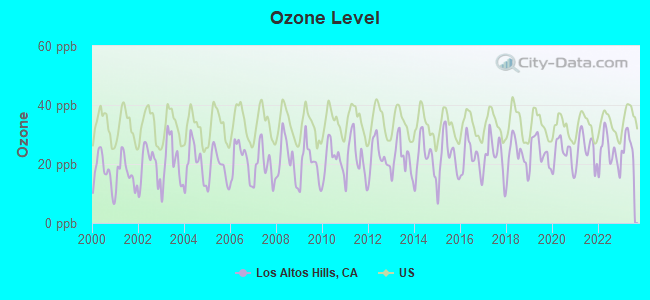
Ozone [ppb] level in 2023 was 26.8. This is better than average. Closest monitor was 3.3 miles away from the city center.
| City: | 26.8 |
| U.S.: | 33.3 |
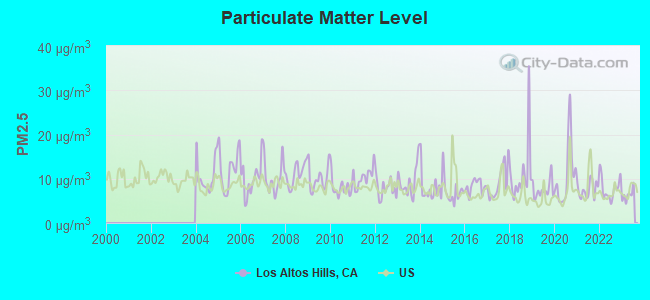
Particulate Matter (PM2.5) [µg/m3] level in 2023 was 6.29. This is better than average. Closest monitor was 8.5 miles away from the city center.
| City: | 6.29 |
| U.S.: | 8.11 |
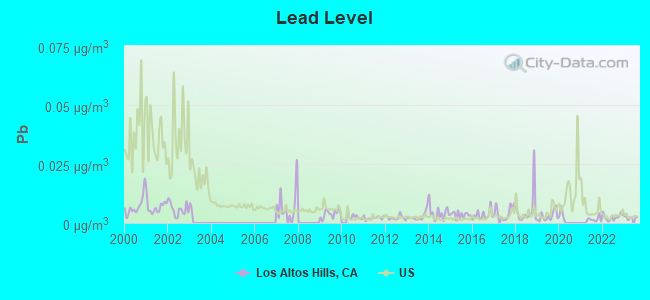
Lead (Pb) [µg/m3] level in 2023 was 0.00228. This is significantly better than average. Closest monitor was 5.2 miles away from the city center.
| City: | 0.00228 |
| U.S.: | 0.00931 |
Earthquake activity:
Los Altos Hills-area historical earthquake activity is significantly above California state average. It is 7490% greater than the overall U.S. average.On 4/18/1906 at 13:12:21, a magnitude 7.9 (7.9 UK, Class: Major, Intensity: VIII - XII) earthquake occurred 64.2 miles away from the city center, causing $524,000,000 total damage
On 10/18/1989 at 00:04:15, a magnitude 7.1 (6.5 MB, 7.1 MS, 6.9 MW, 7.0 ML) earthquake occurred 27.1 miles away from the city center, causing 62 deaths (62 shaking deaths) and 3757 injuries, causing $1,305,032,704 total damage
On 11/4/1927 at 13:51:53, a magnitude 7.5 (7.5 UK) earthquake occurred 180.8 miles away from the city center
On 7/21/1952 at 11:52:14, a magnitude 7.7 (7.7 UK) earthquake occurred 239.9 miles away from Los Altos Hills center, causing $50,000,000 total damage
On 1/31/1922 at 13:17:28, a magnitude 7.6 (7.6 UK) earthquake occurred 294.4 miles away from Los Altos Hills center
On 4/25/1992 at 18:06:04, a magnitude 7.2 (6.3 MB, 7.1 MS, 7.2 MW, 7.1 MW, Depth: 9.4 mi) earthquake occurred 230.8 miles away from Los Altos Hills center, causing $75,000,000 total damage
Magnitude types: body-wave magnitude (MB), local magnitude (ML), surface-wave magnitude (MS), moment magnitude (MW)
Natural disasters:
The number of natural disasters in Santa Clara County (19) is greater than the US average (15).Major Disasters (Presidential) Declared: 10
Emergencies Declared: 3
Causes of natural disasters: Floods: 9, Fires: 5, Winter Storms: 5, Storms: 4, Mudslides: 3, Landslides: 2, Drought: 1, Earthquake: 1, Freeze: 1, Hurricane: 1, Tornado: 1, Other: 1 (Note: some incidents may be assigned to more than one category).
Hospitals and medical centers near Los Altos Hills:
- BAY HEALTHCARE - PALO ALTO (Nursing Home, about 2 miles away; PALO ALTO, CA)
- PILGRIM HAVEN HEALTH FACILITY (Nursing Home, about 2 miles away; LOS ALTOS, CA)
- PALO ALTO VA MEDICAL CENTER (Hospital, Acute Care - Veterans Administration, about 3 miles away; PALO ALTO, CA)
- LOS ALTOS SUB-ACUTE AND REHABILITATION CENTER (Nursing Home, about 3 miles away; LOS ALTOS, CA)
- VILLA SIENA (Nursing Home, about 3 miles away; MOUNTAIN VIEW, CA)
- MOUNTAIN VIEW HEALTHCARE CTR (Nursing Home, about 4 miles away; MOUNTAIN VIEW, CA)
- GRANT CUESTA SUB-ACUTE AND REHABILITATION CENTER (Nursing Home, about 4 miles away; MOUNTAIN VIEW, CA)
Amtrak stations near Los Altos Hills:
- 11 miles: SANTA CLARA-GREAT AMERICA (SANTA CLARA, FOOT OF STARS & STRIPES DR.) . Services: partially wheelchair accessible, free short-term parking.
- 14 miles: SAN JOSE (65 CAHILL ST.) . Services: ticket office, fully wheelchair accessible, enclosed waiting area, public restrooms, public payphones, paid short-term parking, free long-term parking, taxi stand, public transit connection.
- 15 miles: FREMONT (CENTERVILLE, FREMONT & PERALTA BLVDS.) . Services: fully wheelchair accessible, enclosed waiting area, public restrooms, public payphones, snack bar, free short-term parking, free long-term parking, call for car rental service, call for taxi service, public transit connection.
Colleges/Universities in Los Altos Hills:
Other colleges/universities with over 2000 students near Los Altos Hills:
- Stanford University (about 5 miles; Stanford, CA; Full-time enrollment: 14,410)
- De Anza College (about 7 miles; Cupertino, CA; FT enrollment: 16,729)
- Mission College (about 9 miles; Santa Clara, CA; FT enrollment: 5,625)
- Canada College (about 9 miles; Redwood City, CA; FT enrollment: 3,446)
- West Valley College (about 11 miles; Saratoga, CA; FT enrollment: 6,128)
- Santa Clara University (about 12 miles; Santa Clara, CA; FT enrollment: 7,640)
- San Jose City College (about 13 miles; San Jose, CA; FT enrollment: 5,526)
Private high school in Los Altos Hills:
Public elementary/middle school in Los Altos Hills:
- GARDNER BULLIS ELEMENTARY (Students: 124, Location: 25890 FREMONT RD., Grades: KG-6)
Private elementary/middle schools in Los Altos Hills:
Points of interest:
Notable locations in Los Altos Hills: Santa Clara County Fire Department El Monte Fire Station (A), Mount Helen Childrens Home (B). Display/hide their locations on the map
Church in Los Altos Hills: Temple Beth Am (A). Display/hide its location on the map
Creek: Arastradero Creek (A). Display/hide its location on the map
Birthplace of: Max Thieriot - Child actor.
| This town: | 2.8 people |
| California: | 2.9 people |
| This town: | 83.8% |
| Whole state: | 68.7% |
| This town: | 2.5% |
| Whole state: | 7.2% |
Likely homosexual households (counted as self-reported same-sex unmarried-partner households)
- Lesbian couples: 0.2% of all households
- Gay men: 0.5% of all households
55 people in religious group quarters in 2000
10 people in other nonhousehold living situations in 2000
For population 15 years and over in Los Altos Hills:
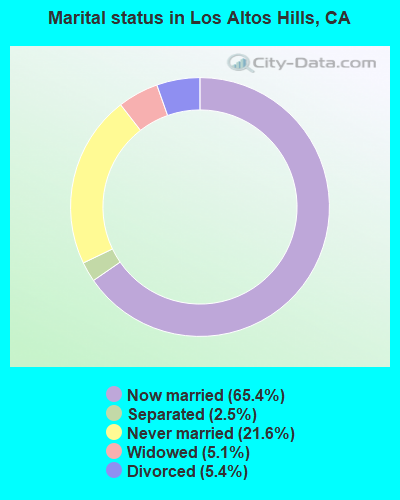
- Never married: 21.6%
- Now married: 65.4%
- Separated: 2.5%
- Widowed: 5.1%
- Divorced: 5.4%
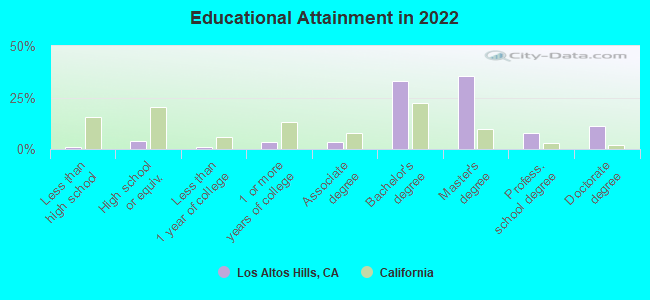
For population 25 years and over in Los Altos Hills:
- High school or higher: 99.1%
- Bachelor's degree or higher: 86.3%
- Graduate or professional degree: 53.3%
- Unemployed: 1.8%
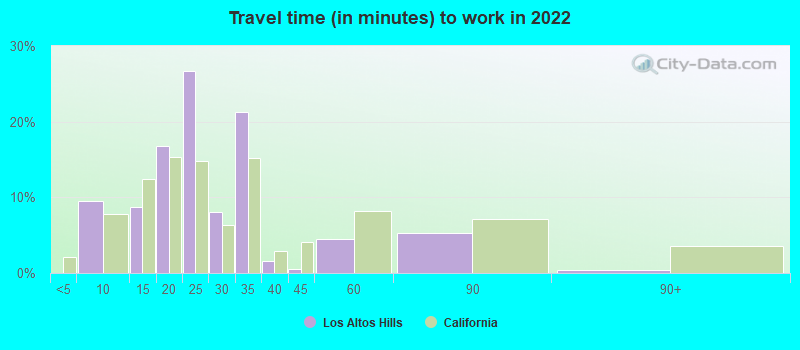
- Mean travel time to work (commute): 15.2 minutes
| Here: | 7.7 |
| California average: | 15.5 |
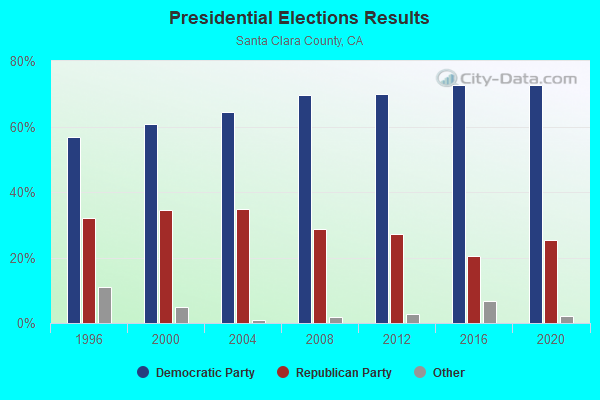
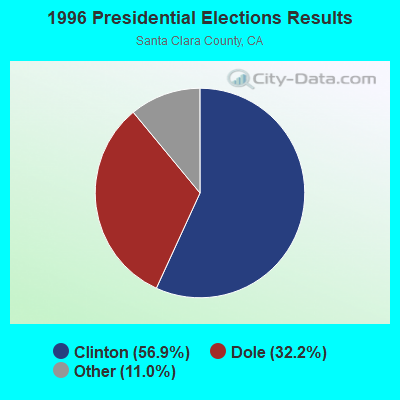
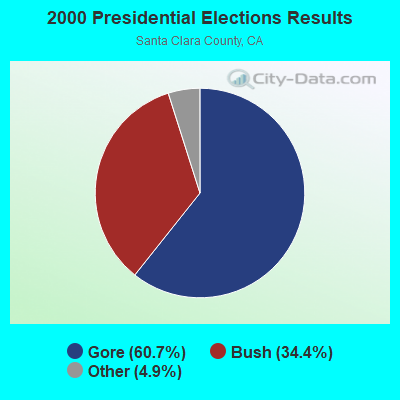

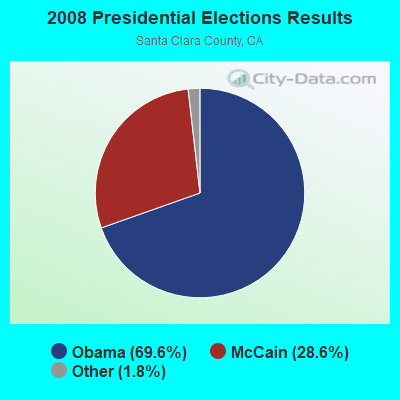
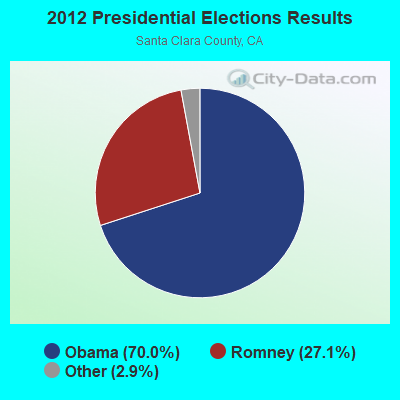
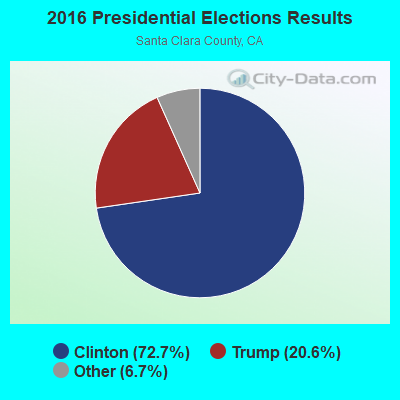
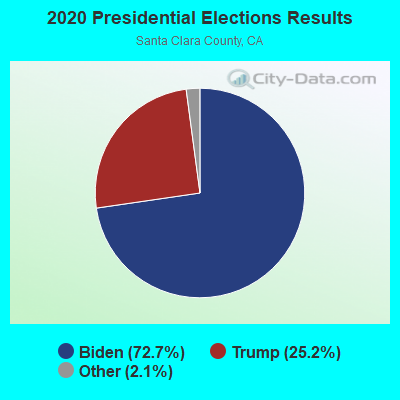
Graphs represent county-level data. Detailed 2008 Election Results
Political contributions by individuals in Los Altos Hills, CA
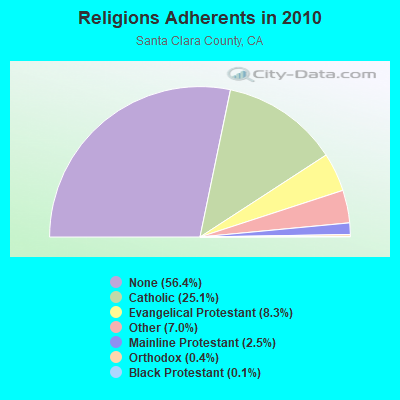
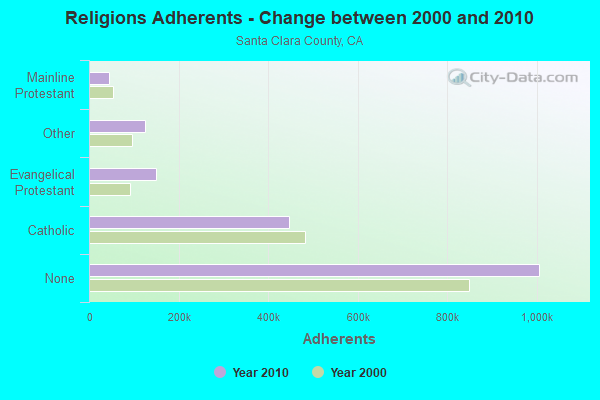
Religion statistics for Los Altos Hills, CA (based on Santa Clara County data)
| Religion | Adherents | Congregations |
|---|---|---|
| Catholic | 447,369 | 56 |
| Evangelical Protestant | 148,599 | 481 |
| Other | 125,165 | 221 |
| Mainline Protestant | 44,623 | 132 |
| Orthodox | 7,720 | 17 |
| Black Protestant | 2,552 | 20 |
| None | 1,005,614 | - |
Food Environment Statistics:
| Here: | 1.99 / 10,000 pop. |
| California: | 2.14 / 10,000 pop. |
| Here: | 0.04 / 10,000 pop. |
| California: | 0.04 / 10,000 pop. |
| Here: | 0.68 / 10,000 pop. |
| California: | 0.62 / 10,000 pop. |
| Santa Clara County: | 1.38 / 10,000 pop. |
| California: | 1.49 / 10,000 pop. |
| Santa Clara County: | 8.59 / 10,000 pop. |
| State: | 7.42 / 10,000 pop. |
| Santa Clara County: | 7.1% |
| California: | 7.3% |
| Santa Clara County: | 19.0% |
| State: | 21.3% |
| This county: | 16.6% |
| California: | 17.9% |
Health and Nutrition:
| Los Altos Hills: | 59.5% |
| State: | 49.4% |
| This city: | 57.5% |
| California: | 48.0% |
| This city: | 27.3 |
| California: | 28.1 |
| Here: | 16.4% |
| California: | 20.2% |
| This city: | 10.4% |
| California: | 11.2% |
| This city: | 7.0 |
| California: | 6.8 |
| Los Altos Hills: | 33.0% |
| California: | 31.5% |
| Here: | 62.4% |
| California: | 56.4% |
| Los Altos Hills: | 79.9% |
| California: | 80.9% |
More about Health and Nutrition of Los Altos Hills, CA Residents
| Local government employment and payroll (March 2022) | |||||
| Function | Full-time employees | Monthly full-time payroll | Average yearly full-time wage | Part-time employees | Monthly part-time payroll |
|---|---|---|---|---|---|
| Other Government Administration | 19 | $199,405 | $125,940 | 1 | $195 |
| Other and Unallocable | 5 | $33,064 | $79,354 | 0 | $0 |
| Streets and Highways | 5 | $49,821 | $119,570 | 0 | $0 |
| Financial Administration | 3 | $35,050 | $140,200 | 0 | $0 |
| Parks and Recreation | 2 | $17,269 | $103,614 | 0 | $0 |
| Totals for Government | 34 | $334,610 | $118,098 | 1 | $195 |
Los Altos Hills government finances - Expenditure in 2017 (per resident):
- Construction - Regular Highways: $969,000 ($118.63)
- Current Operations - Central Staff Services: $2,751,000 ($336.80)
Sewerage: $1,979,000 ($242.29)
Police Protection: $1,505,000 ($184.26)
Protective Inspection and Regulation - Other: $1,247,000 ($152.67)
Parks and Recreation: $893,000 ($109.33)
Regular Highways: $546,000 ($66.85)
Financial Administration: $189,000 ($23.14)
Health - Other: $55,000 ($6.73)
- General - Interest on Debt: $72,000 ($8.81)
- Intergovernmental to Local - Other - Police Protection: $1,417,000 ($173.48)
Other - Sewerage: $1,043,000 ($127.69)
- Other Capital Outlay - General Public Building: $1,373,000 ($168.10)
Parks and Recreation: $71,000 ($8.69)
Los Altos Hills government finances - Revenue in 2017 (per resident):
- Charges - Sewerage: $2,947,000 ($360.80)
Other: $639,000 ($78.23)
Parks and Recreation: $151,000 ($18.49)
- Miscellaneous - Rents: $247,000 ($30.24)
Fines and Forfeits: $118,000 ($14.45)
Donations From Private Sources: $78,000 ($9.55)
Interest Earnings: $33,000 ($4.04)
General Revenue - Other: $10,000 ($1.22)
- State Intergovernmental - Other: $213,000 ($26.08)
Highways: $148,000 ($18.12)
General Local Government Support: $18,000 ($2.20)
- Tax - Property: $5,195,000 ($636.02)
Other License: $2,131,000 ($260.90)
Public Utilities Sales: $573,000 ($70.15)
Documentary and Stock Transfer: $250,000 ($30.61)
Occupation and Business License - Other: $215,000 ($26.32)
Other: $103,000 ($12.61)
General Sales and Gross Receipts: $93,000 ($11.39)
Los Altos Hills government finances - Debt in 2017 (per resident):
- Long Term Debt - Beginning Outstanding - Unspecified Public Purpose: $1,795,000 ($219.76)
Outstanding Unspecified Public Purpose: $1,755,000 ($214.86)
Retired Unspecified Public Purpose: $40,000 ($4.90)
Los Altos Hills government finances - Cash and Securities in 2017 (per resident):
- Bond Funds - Cash and Securities: $2,068,000 ($253.18)
- Other Funds - Cash and Securities: $18,630,000 ($2280.85)
5.37% of this county's 2021 resident taxpayers lived in other counties in 2020 ($152,550 average adjusted gross income)
| Here: | 5.37% |
| California average: | 5.19% |
0.01% of residents moved from foreign countries ($93 average AGI)
Santa Clara County: 0.01% California average: 0.03%
Top counties from which taxpayers relocated into this county between 2020 and 2021:
| from Alameda County, CA | |
| from San Mateo County, CA | |
| from San Francisco County, CA |
7.70% of this county's 2020 resident taxpayers moved to other counties in 2021 ($201,706 average adjusted gross income)
| Here: | 7.70% |
| California average: | 6.14% |
0.01% of residents moved to foreign countries ($110 average AGI)
Santa Clara County: 0.01% California average: 0.02%
Top counties to which taxpayers relocated from this county between 2020 and 2021:
| to Alameda County, CA | |
| to San Mateo County, CA | |
| to San Francisco County, CA |
Strongest AM radio stations in Los Altos Hills:
- KGO (810 AM; 50 kW; SAN FRANCISCO, CA; Owner: KGO-AM RADIO, INC.)
- KNBR (680 AM; 50 kW; SAN FRANCISCO, CA; Owner: KNBR LICO, INC.)
- KYCY (1550 AM; 50 kW; SAN FRANCISCO, CA; Owner: INFINITY BROADCASTING OPERATIONS, INC.)
- KLOK (1170 AM; 50 kW; SAN JOSE, CA; Owner: ENTRAVISION HOLDINGS, LLC)
- KTCT (1050 AM; 50 kW; SAN MATEO, CA; Owner: SUSQUEHANNA RADIO CORP.)
- KFAX (1100 AM; 50 kW; SAN FRANCISCO, CA; Owner: GOLDEN GATE BROADCASTING CO, INC.)
- KSFB (1220 AM; 5 kW; PALO ALTO, CA; Owner: SCA-PALO ALTO, LLC)
- KTRB (860 AM; 50 kW; MODESTO, CA; Owner: PAPPAS RADIO OF CALIFORNIA, A CALIFORNIA LIMITED PARTNERSHIP)
- KIQI (1010 AM; 35 kW; SAN FRANCISCO, CA; Owner: RADIO UNICA OF SAN FRANCISCO LICENSE CORP.)
- KSJX (1500 AM; 10 kW; SAN JOSE, CA; Owner: MULTICULTURAL RADIO BROADCASTING INC)
- KCBS (740 AM; 50 kW; SAN FRANCISCO, CA; Owner: INFINITY BROADCASTING OPERATIONS, INC.)
- KZSF (1370 AM; 5 kW; SAN JOSE, CA; Owner: CARLOS A. DUHARTE)
- KNEW (910 AM; 20 kW; OAKLAND, CA; Owner: AMFM RADIO LICENSES, L.L.C.)
Strongest FM radio stations in Los Altos Hills:
- KFJC (89.7 FM; LOS ALTOS, CA; Owner: FOOTHILL-DE ANZA COMM. COLLEGE DIST.)
- KFFG (97.7 FM; LOS ALTOS, CA; Owner: KFFG LICO, INC.)
- KBAA (94.5 FM; GILROY, CA; Owner: INFINITY RADIO OPERATIONS INC.)
- KSQL (99.1 FM; SANTA CRUZ, CA; Owner: TMS LICENSE CALIFORNIA, INC)
- KKUP (91.5 FM; CUPERTINO, CA; Owner: ASSURANCE SCIENCES FOUNDATION)
- KBRG (100.3 FM; SAN JOSE, CA; Owner: ENTRAVISION HOLDINGS, LLC)
- KZBR-FM2 (95.7 FM; LIVERMORE, ETC., CA; Owner: BONNEVILLE HOLDING COMPANY)
- KTEE (93.7 FM; FELTON, CA; Owner: MAPLETON COMMUNICATIONS, L.L.C.)
- KKSF-FM1 (103.7 FM; PLEASANTON, ETC., CA; Owner: AMFM RADIO LICENSES, L.L.C.)
- KFRC-FM3 (99.7 FM; WALNUT CREEK, CA; Owner: INFINITY KFRC-FM, INC.)
- KZBR-FM1 (95.7 FM; WALNUT CREEK, CA; Owner: BONNEVILLE HOLDING COMPANY)
- KBLX-FM2 (102.9 FM; PLEASANTON, CA; Owner: ICBC BROADCAST HOLDINGS -CA, INC.)
- KSOL-FM3 (98.9 FM; PLEASANTON, CA; Owner: TMS LICENSE CALIFORNIA, INC)
- KISQ-FM3 (98.1 FM; CONCORD, CA; Owner: AMFM RADIO LICENSES, L.L.C.)
- KUFX (98.5 FM; SAN JOSE, CA; Owner: CITICASTERS LICENSES, L.P.)
- KRTY (95.3 FM; LOS GATOS, CA; Owner: KRTY, LTD.)
- KMEL-FM1 (106.1 FM; CONCORD, CA; Owner: AMFM RADIO LICENSES, L.L.C.)
- K238AC (95.5 FM; SALIDA, CA; Owner: FAMILY STATIONS, INC.)
- K216AX (91.1 FM; LAUREL, CA; Owner: CALVARY CHAPEL OF TWIN FALLS, INC.)
- KYLD (94.9 FM; SAN FRANCISCO, CA; Owner: AMFM RADIO LICENSES, L.L.C.)
TV broadcast stations around Los Altos Hills:
- KQED (Channel 9; SAN FRANCISCO, CA; Owner: KQED, INC.)
- KBIT-CA (Channel 28; SAN FRANCISCO, ETC., CA; Owner: POLAR BROADCASTING, INC.)
- KICU-TV (Channel 36; SAN JOSE, CA; Owner: KTVU PARTNERSHIP)
- KGO-TV (Channel 7; SAN FRANCISCO, CA; Owner: KGO TELEVISION, INC.)
- KPIX-TV (Channel 5; SAN FRANCISCO, CA; Owner: CBS BROADCASTING INC.)
- KTVU (Channel 2; OAKLAND, CA; Owner: KTVU PARTNERSHIP)
- KTEH (Channel 54; SAN JOSE, CA; Owner: KTEH FOUNDATION)
- KDTV (Channel 14; SAN FRANCISCO, CA; Owner: KDTV LICENSE PARTNERSHIP, G.P.)
- KSTS (Channel 48; SAN JOSE, CA; Owner: TELEMUNDO OF NORTHERN CALIFORNIA LICENSE CORP.)
- KRON-TV (Channel 4; SAN FRANCISCO, CA; Owner: YOUNG BROADCASTING OF SAN FRANCISCO, INC.)
- KMTP-TV (Channel 32; SAN FRANCISCO, CA; Owner: MINORITY TELEVISION PROJECT)
- KBHK-TV (Channel 44; SAN FRANCISCO, CA; Owner: VIACOM TELEVISION STATIONS GROUP OF SAN FRANCISCO INC.)
- KCSM-TV (Channel 60; SAN MATEO, CA; Owner: SAN MATEO COUNTY COMMUNITY COLLEGE DISTRICT)
- KBWB (Channel 20; SAN FRANCISCO, CA; Owner: KBWB LICENSE, INC.)
- KFSF (Channel 66; VALLEJO, CA; Owner: TELEFUTURA SAN FRANCISCO LLC)
- KCNS (Channel 38; SAN FRANCISCO, CA; Owner: WRAY, INC.)
- National Bridge Inventory (NBI) Statistics
- 40Number of bridges
- 262ft / 80.2mTotal length
- 1,187,380Total average daily traffic
- 24,630Total average daily truck traffic

- New bridges - historical statistics
- 321960-1969
- 21970-1979
- 21980-1989
- 21990-1999
- 12000-2009
- 12010-2019
FCC Registered Antenna Towers: 40 (See the full list of FCC Registered Antenna Towers)
FCC Registered Private Land Mobile Towers: 1 (See the full list of FCC Registered Private Land Mobile Towers in Los Altos Hills, CA)
FCC Registered Broadcast Land Mobile Towers: 9 (See the full list of FCC Registered Broadcast Land Mobile Towers)
FCC Registered Microwave Towers: 12 (See the full list of FCC Registered Microwave Towers in this town)
FCC Registered Amateur Radio Licenses: 145 (See the full list of FCC Registered Amateur Radio Licenses in Los Altos Hills)
FAA Registered Aircraft: 38 (See the full list of FAA Registered Aircraft in Los Altos Hills)
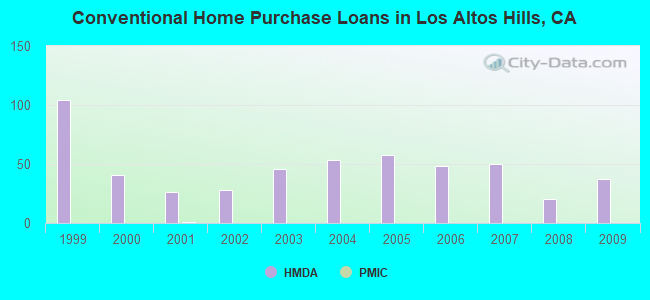
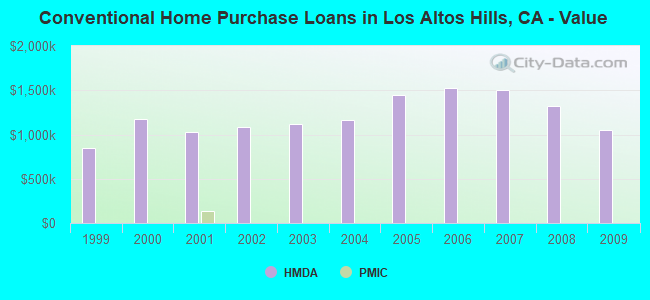
| Home Mortgage Disclosure Act Aggregated Statistics For Year 2009 (Based on 2 partial tracts) | ||||||||||
| A) FHA, FSA/RHS & VA Home Purchase Loans | B) Conventional Home Purchase Loans | C) Refinancings | D) Home Improvement Loans | F) Non-occupant Loans on < 5 Family Dwellings (A B C & D) | ||||||
|---|---|---|---|---|---|---|---|---|---|---|
| Number | Average Value | Number | Average Value | Number | Average Value | Number | Average Value | Number | Average Value | |
| LOANS ORIGINATED | 0 | $0 | 37 | $1,048,195 | 190 | $717,616 | 6 | $345,402 | 8 | $588,111 |
| APPLICATIONS APPROVED, NOT ACCEPTED | 1 | $627,210 | 2 | $685,890 | 19 | $687,454 | 0 | $0 | 1 | $591,710 |
| APPLICATIONS DENIED | 0 | $0 | 3 | $862,440 | 43 | $1,107,993 | 3 | $822,233 | 0 | $0 |
| APPLICATIONS WITHDRAWN | 0 | $0 | 5 | $948,196 | 33 | $750,249 | 2 | $388,440 | 1 | $233,660 |
| FILES CLOSED FOR INCOMPLETENESS | 0 | $0 | 1 | $848,070 | 10 | $707,106 | 1 | $294,690 | 0 | $0 |
Detailed HMDA statistics for the following Tracts: 5117.01 , 5117.03
| Private Mortgage Insurance Companies Aggregated Statistics For Year 2001 (Based on 1 partial tract) | ||
| A) Conventional Home Purchase Loans | ||
|---|---|---|
| Number | Average Value | |
| LOANS ORIGINATED | 1 | $139,110 |
| APPLICATIONS APPROVED, NOT ACCEPTED | 0 | $0 |
| APPLICATIONS DENIED | 0 | $0 |
| APPLICATIONS WITHDRAWN | 0 | $0 |
| FILES CLOSED FOR INCOMPLETENESS | 0 | $0 |
Detailed PMIC statistics for the following Tracts: 5117.03
2005 - 2018 National Fire Incident Reporting System (NFIRS) incidents
- Fire incident types reported to NFIRS in Los Altos Hills, CA
- 8139.1%Outside Fires
- 6631.9%Mobile Property/Vehicle Fires
- 5024.2%Structure Fires
- 104.8%Other
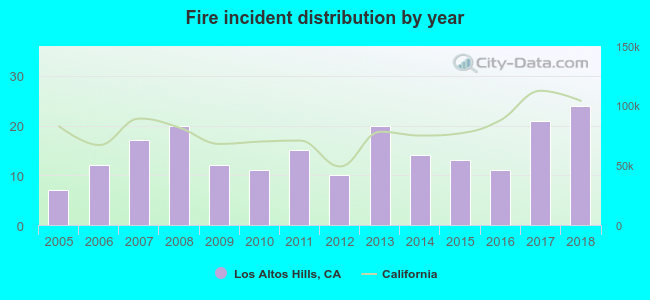 According to the data from the years 2005 - 2018 the average number of fire incidents per year is 15. The highest number of reported fire incidents - 24 took place in 2018, and the least - 7 in 2005. The data has an increasing trend.
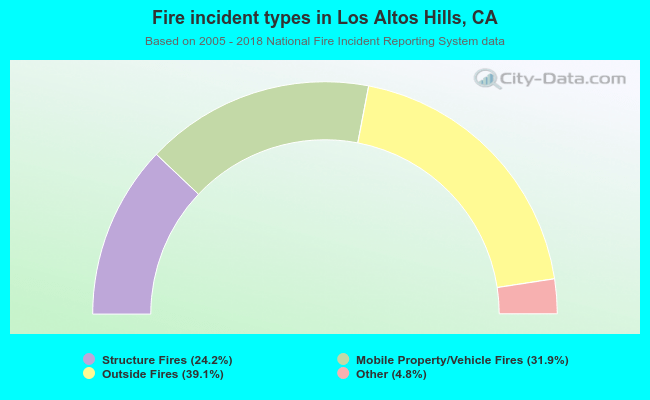 When looking into fire subcategories, the most reports belonged to: Outside Fires (39.1%), and Mobile Property/Vehicle Fires (31.9%).
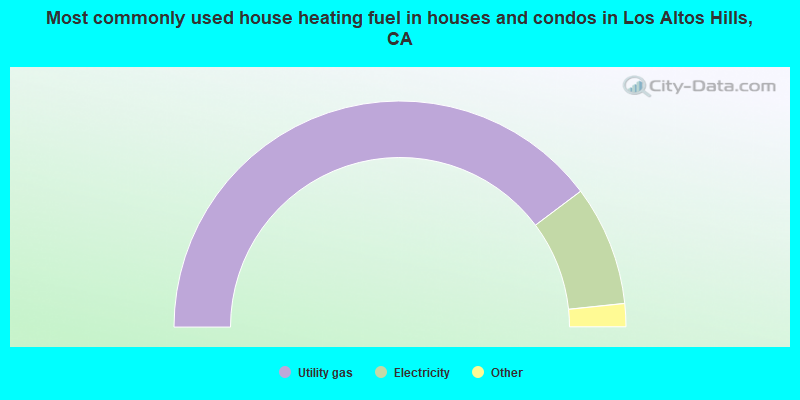
- 79.5%Utility gas
- 17.2%Electricity
- 1.6%Solar energy
- 0.9%Bottled, tank, or LP gas
- 0.6%Other fuel
- 0.3%Fuel oil, kerosene, etc.
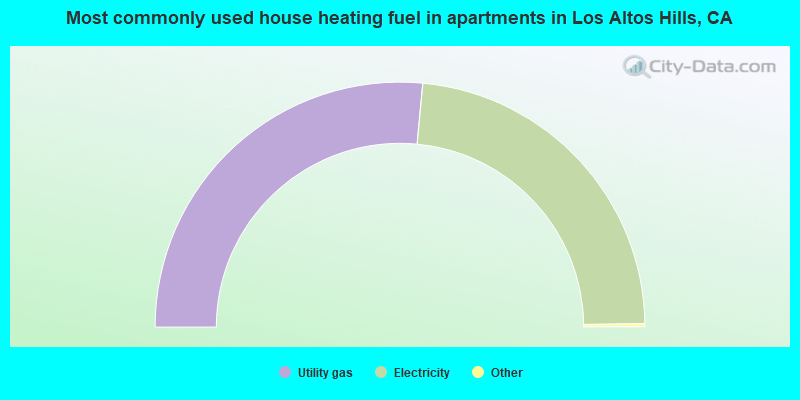
- 53.2%Utility gas
- 46.8%Electricity
Los Altos Hills compared to California state average:
- Median household income above state average.
- Median house value significantly above state average.
- Unemployed percentage significantly below state average.
- Black race population percentage significantly below state average.
- Hispanic race population percentage significantly below state average.
- Median age significantly above state average.
- Renting percentage significantly below state average.
- Length of stay since moving in significantly above state average.
- Number of rooms per house significantly above state average.
- Percentage of population with a bachelor's degree or higher significantly above state average.
Los Altos Hills on our top lists:
- #2 on the list of "Top 101 cities with largest percentage of females in occupations: legal occupations (population 5,000+)"
- #2 on the list of "Top 100 cities with highest median house value"
- #6 on the list of "Top 101 cities with the smallest house values disparities (population 5,000+)"
- #10 on the list of "Top 101 cities with the most people having Master's or Doctorate degrees (population 5,000+)"
- #11 on the list of "Top 101 cities with the most residents born in Other Northern Europe (population 500+)"
- #18 on the list of "Top 101 cities with largest percentage of males in occupations: management occupations (population 5,000+)"
- #19 on the list of "Top 101 cities with the most residents born in Taiwan (population 500+)"
- #37 on the list of "Top 100 cities with highest median household income"
- #40 on the list of "Top 101 cities with largest percentage of females in occupations: management occupations (population 5,000+)"
- #40 on the list of "Top 101 cities with largest percentage of females in industries: professional, scientific, and technical services (population 5,000+)"
- #40 on the list of "Top 101 cities with the most residents born in Iran (population 500+)"
- #43 on the list of "Top 100 best educated cities (highest percentage of bachelor degree holding residents)"
- #44 on the list of "Top 101 cities with largest percentage of males in industries: professional, scientific, and technical services (population 5,000+)"
- #45 on the list of "Top 101 cities with the most residents born in China (population 500+)"
- #48 on the list of "Top 101 cities with the lowest number of thefts per 100,000 residents (population 5,000+)"
- #53 on the list of "Top 101 cities with the largest percentage of one, detached housing units in structures (2,000+ housing units)"
- #58 on the list of "Top 101 cities with largest percentage of females in occupations: business and financial operations occupations (population 5,000+)"
- #69 on the list of "Top 101 cities with the lowest percentage of single-parent households, population 5,000+"
- #70 on the list of "Top 100 cities with biggest houses (pop. 5,000+)"
- #74 on the list of "Top 101 cities with the highest percentage of workers working at home, population 5,000+"
- #16 (94304) on the list of "Top 101 zip codes with the largest charity contributions deductions as a percentage of AGI in 2012 (pop 1,000+)"
- #26 (94304) on the list of "Top 101 zip codes with the highest 2012 average net capital gain/loss (pop 1,000+)"
- #55 (94304) on the list of "Top 101 zip codes with the highest 2012 average Adjusted Gross Income (AGI) for individuals (pop 1,000+)"
- #88 (94304) on the list of "Top 101 zip codes with the largest percentage of taxpayers reporting taxable interest in 2012 (pop 1,000+)"
- #90 (94304) on the list of "Top 101 zip codes with the highest 2012 average taxable interest for individuals (pop 1,000+)"
- #5 on the list of "Top 101 counties with the highest percentage of residents that visited a dentist within the past year"
- #9 on the list of "Top 101 counties with the lowest percentage of residents that smoked 100+ cigarettes in their lives"
- #16 on the list of "Top 101 counties with the most Other adherents"
- #16 on the list of "Top 101 counties with the most Catholic adherents"
- #17 on the list of "Top 101 counties with the highest percentage of residents that drank alcohol in the past 30 days"

|
|
Total of 4110 patent applications in 2008-2024.