Mountain View, California Submit your own pictures of this city and show them to the world
OSM Map
General Map
Google Map
MSN Map
OSM Map
General Map
Google Map
MSN Map
OSM Map
General Map
Google Map
MSN Map
OSM Map
General Map
Google Map
MSN Map
Please wait while loading the map...
Population in 2022: 81,059 (100% urban, 0% rural). Population change since 2000: +14.6%Males: 43,044 Females: 38,015
March 2022 cost of living index in Mountain View: 133.3 (high, U.S. average is 100) Percentage of residents living in poverty in 2022: 5.9%for White Non-Hispanic residents , 13.5% for Black residents , 12.7% for Hispanic or Latino residents , 7.9% for American Indian residents , 10.8% for other race residents , 7.7% for two or more races residents )
Profiles of local businesses
Business Search - 14 Million verified businesses
Data:
Median household income ($)
Median household income (% change since 2000)
Household income diversity
Ratio of average income to average house value (%)
Ratio of average income to average rent
Median household income ($) - White
Median household income ($) - Black or African American
Median household income ($) - Asian
Median household income ($) - Hispanic or Latino
Median household income ($) - American Indian and Alaska Native
Median household income ($) - Multirace
Median household income ($) - Other Race
Median household income for houses/condos with a mortgage ($)
Median household income for apartments without a mortgage ($)
Races - White alone (%)
Races - White alone (% change since 2000)
Races - Black alone (%)
Races - Black alone (% change since 2000)
Races - American Indian alone (%)
Races - American Indian alone (% change since 2000)
Races - Asian alone (%)
Races - Asian alone (% change since 2000)
Races - Hispanic (%)
Races - Hispanic (% change since 2000)
Races - Native Hawaiian and Other Pacific Islander alone (%)
Races - Native Hawaiian and Other Pacific Islander alone (% change since 2000)
Races - Two or more races (%)
Races - Two or more races (% change since 2000)
Races - Other race alone (%)
Races - Other race alone (% change since 2000)
Racial diversity
Unemployment (%)
Unemployment (% change since 2000)
Unemployment (%) - White
Unemployment (%) - Black or African American
Unemployment (%) - Asian
Unemployment (%) - Hispanic or Latino
Unemployment (%) - American Indian and Alaska Native
Unemployment (%) - Multirace
Unemployment (%) - Other Race
Population density (people per square mile)
Population - Males (%)
Population - Females (%)
Population - Males (%) - White
Population - Males (%) - Black or African American
Population - Males (%) - Asian
Population - Males (%) - Hispanic or Latino
Population - Males (%) - American Indian and Alaska Native
Population - Males (%) - Multirace
Population - Males (%) - Other Race
Population - Females (%) - White
Population - Females (%) - Black or African American
Population - Females (%) - Asian
Population - Females (%) - Hispanic or Latino
Population - Females (%) - American Indian and Alaska Native
Population - Females (%) - Multirace
Population - Females (%) - Other Race
Coronavirus confirmed cases (Apr 27, 2024)
Deaths caused by coronavirus (Apr 27, 2024)
Coronavirus confirmed cases (per 100k population) (Apr 27, 2024)
Deaths caused by coronavirus (per 100k population) (Apr 27, 2024)
Daily increase in number of cases (Apr 27, 2024)
Weekly increase in number of cases (Apr 27, 2024)
Cases doubled (in days) (Apr 27, 2024)
Hospitalized patients (Apr 18, 2022)
Negative test results (Apr 18, 2022)
Total test results (Apr 18, 2022)
COVID Vaccine doses distributed (per 100k population) (Sep 19, 2023)
COVID Vaccine doses administered (per 100k population) (Sep 19, 2023)
COVID Vaccine doses distributed (Sep 19, 2023)
COVID Vaccine doses administered (Sep 19, 2023)
Likely homosexual households (%)
Likely homosexual households (% change since 2000)
Likely homosexual households - Lesbian couples (%)
Likely homosexual households - Lesbian couples (% change since 2000)
Likely homosexual households - Gay men (%)
Likely homosexual households - Gay men (% change since 2000)
Cost of living index
Median gross rent ($)
Median contract rent ($)
Median monthly housing costs ($)
Median house or condo value ($)
Median house or condo value ($ change since 2000)
Mean house or condo value by units in structure - 1, detached ($)
Mean house or condo value by units in structure - 1, attached ($)
Mean house or condo value by units in structure - 2 ($)
Mean house or condo value by units in structure by units in structure - 3 or 4 ($)
Mean house or condo value by units in structure - 5 or more ($)
Mean house or condo value by units in structure - Boat, RV, van, etc. ($)
Mean house or condo value by units in structure - Mobile home ($)
Median house or condo value ($) - White
Median house or condo value ($) - Black or African American
Median house or condo value ($) - Asian
Median house or condo value ($) - Hispanic or Latino
Median house or condo value ($) - American Indian and Alaska Native
Median house or condo value ($) - Multirace
Median house or condo value ($) - Other Race
Median resident age
Resident age diversity
Median resident age - Males
Median resident age - Females
Median resident age - White
Median resident age - Black or African American
Median resident age - Asian
Median resident age - Hispanic or Latino
Median resident age - American Indian and Alaska Native
Median resident age - Multirace
Median resident age - Other Race
Median resident age - Males - White
Median resident age - Males - Black or African American
Median resident age - Males - Asian
Median resident age - Males - Hispanic or Latino
Median resident age - Males - American Indian and Alaska Native
Median resident age - Males - Multirace
Median resident age - Males - Other Race
Median resident age - Females - White
Median resident age - Females - Black or African American
Median resident age - Females - Asian
Median resident age - Females - Hispanic or Latino
Median resident age - Females - American Indian and Alaska Native
Median resident age - Females - Multirace
Median resident age - Females - Other Race
Commute - mean travel time to work (minutes)
Travel time to work - Less than 5 minutes (%)
Travel time to work - Less than 5 minutes (% change since 2000)
Travel time to work - 5 to 9 minutes (%)
Travel time to work - 5 to 9 minutes (% change since 2000)
Travel time to work - 10 to 19 minutes (%)
Travel time to work - 10 to 19 minutes (% change since 2000)
Travel time to work - 20 to 29 minutes (%)
Travel time to work - 20 to 29 minutes (% change since 2000)
Travel time to work - 30 to 39 minutes (%)
Travel time to work - 30 to 39 minutes (% change since 2000)
Travel time to work - 40 to 59 minutes (%)
Travel time to work - 40 to 59 minutes (% change since 2000)
Travel time to work - 60 to 89 minutes (%)
Travel time to work - 60 to 89 minutes (% change since 2000)
Travel time to work - 90 or more minutes (%)
Travel time to work - 90 or more minutes (% change since 2000)
Marital status - Never married (%)
Marital status - Now married (%)
Marital status - Separated (%)
Marital status - Widowed (%)
Marital status - Divorced (%)
Median family income ($)
Median family income (% change since 2000)
Median non-family income ($)
Median non-family income (% change since 2000)
Median per capita income ($)
Median per capita income (% change since 2000)
Median family income ($) - White
Median family income ($) - Black or African American
Median family income ($) - Asian
Median family income ($) - Hispanic or Latino
Median family income ($) - American Indian and Alaska Native
Median family income ($) - Multirace
Median family income ($) - Other Race
Median year house/condo built
Median year apartment built
Year house built - Built 2005 or later (%)
Year house built - Built 2000 to 2004 (%)
Year house built - Built 1990 to 1999 (%)
Year house built - Built 1980 to 1989 (%)
Year house built - Built 1970 to 1979 (%)
Year house built - Built 1960 to 1969 (%)
Year house built - Built 1950 to 1959 (%)
Year house built - Built 1940 to 1949 (%)
Year house built - Built 1939 or earlier (%)
Average household size
Household density (households per square mile)
Average household size - White
Average household size - Black or African American
Average household size - Asian
Average household size - Hispanic or Latino
Average household size - American Indian and Alaska Native
Average household size - Multirace
Average household size - Other Race
Occupied housing units (%)
Vacant housing units (%)
Owner occupied housing units (%)
Renter occupied housing units (%)
Vacancy status - For rent (%)
Vacancy status - For sale only (%)
Vacancy status - Rented or sold, not occupied (%)
Vacancy status - For seasonal, recreational, or occasional use (%)
Vacancy status - For migrant workers (%)
Vacancy status - Other vacant (%)
Residents with income below the poverty level (%)
Residents with income below 50% of the poverty level (%)
Children below poverty level (%)
Poor families by family type - Married-couple family (%)
Poor families by family type - Male, no wife present (%)
Poor families by family type - Female, no husband present (%)
Poverty status for native-born residents (%)
Poverty status for foreign-born residents (%)
Poverty among high school graduates not in families (%)
Poverty among people who did not graduate high school not in families (%)
Residents with income below the poverty level (%) - White
Residents with income below the poverty level (%) - Black or African American
Residents with income below the poverty level (%) - Asian
Residents with income below the poverty level (%) - Hispanic or Latino
Residents with income below the poverty level (%) - American Indian and Alaska Native
Residents with income below the poverty level (%) - Multirace
Residents with income below the poverty level (%) - Other Race
Air pollution - Air Quality Index (AQI)
Air pollution - CO
Air pollution - NO2
Air pollution - SO2
Air pollution - Ozone
Air pollution - PM10
Air pollution - PM25
Air pollution - Pb
Crime - Murders per 100,000 population
Crime - Rapes per 100,000 population
Crime - Robberies per 100,000 population
Crime - Assaults per 100,000 population
Crime - Burglaries per 100,000 population
Crime - Thefts per 100,000 population
Crime - Auto thefts per 100,000 population
Crime - Arson per 100,000 population
Crime - City-data.com crime index
Crime - Violent crime index
Crime - Property crime index
Crime - Murders per 100,000 population (5 year average)
Crime - Rapes per 100,000 population (5 year average)
Crime - Robberies per 100,000 population (5 year average)
Crime - Assaults per 100,000 population (5 year average)
Crime - Burglaries per 100,000 population (5 year average)
Crime - Thefts per 100,000 population (5 year average)
Crime - Auto thefts per 100,000 population (5 year average)
Crime - Arson per 100,000 population (5 year average)
Crime - City-data.com crime index (5 year average)
Crime - Violent crime index (5 year average)
Crime - Property crime index (5 year average)
1996 Presidential Elections Results (%) - Democratic Party (Clinton)
1996 Presidential Elections Results (%) - Republican Party (Dole)
1996 Presidential Elections Results (%) - Other
2000 Presidential Elections Results (%) - Democratic Party (Gore)
2000 Presidential Elections Results (%) - Republican Party (Bush)
2000 Presidential Elections Results (%) - Other
2004 Presidential Elections Results (%) - Democratic Party (Kerry)
2004 Presidential Elections Results (%) - Republican Party (Bush)
2004 Presidential Elections Results (%) - Other
2008 Presidential Elections Results (%) - Democratic Party (Obama)
2008 Presidential Elections Results (%) - Republican Party (McCain)
2008 Presidential Elections Results (%) - Other
2012 Presidential Elections Results (%) - Democratic Party (Obama)
2012 Presidential Elections Results (%) - Republican Party (Romney)
2012 Presidential Elections Results (%) - Other
2016 Presidential Elections Results (%) - Democratic Party (Clinton)
2016 Presidential Elections Results (%) - Republican Party (Trump)
2016 Presidential Elections Results (%) - Other
2020 Presidential Elections Results (%) - Democratic Party (Biden)
2020 Presidential Elections Results (%) - Republican Party (Trump)
2020 Presidential Elections Results (%) - Other
Ancestries Reported - Arab (%)
Ancestries Reported - Czech (%)
Ancestries Reported - Danish (%)
Ancestries Reported - Dutch (%)
Ancestries Reported - English (%)
Ancestries Reported - French (%)
Ancestries Reported - French Canadian (%)
Ancestries Reported - German (%)
Ancestries Reported - Greek (%)
Ancestries Reported - Hungarian (%)
Ancestries Reported - Irish (%)
Ancestries Reported - Italian (%)
Ancestries Reported - Lithuanian (%)
Ancestries Reported - Norwegian (%)
Ancestries Reported - Polish (%)
Ancestries Reported - Portuguese (%)
Ancestries Reported - Russian (%)
Ancestries Reported - Scotch-Irish (%)
Ancestries Reported - Scottish (%)
Ancestries Reported - Slovak (%)
Ancestries Reported - Subsaharan African (%)
Ancestries Reported - Swedish (%)
Ancestries Reported - Swiss (%)
Ancestries Reported - Ukrainian (%)
Ancestries Reported - United States (%)
Ancestries Reported - Welsh (%)
Ancestries Reported - West Indian (%)
Ancestries Reported - Other (%)
Educational Attainment - No schooling completed (%)
Educational Attainment - Less than high school (%)
Educational Attainment - High school or equivalent (%)
Educational Attainment - Less than 1 year of college (%)
Educational Attainment - 1 or more years of college (%)
Educational Attainment - Associate degree (%)
Educational Attainment - Bachelor's degree (%)
Educational Attainment - Master's degree (%)
Educational Attainment - Professional school degree (%)
Educational Attainment - Doctorate degree (%)
School Enrollment - Nursery, preschool (%)
School Enrollment - Kindergarten (%)
School Enrollment - Grade 1 to 4 (%)
School Enrollment - Grade 5 to 8 (%)
School Enrollment - Grade 9 to 12 (%)
School Enrollment - College undergrad (%)
School Enrollment - Graduate or professional (%)
School Enrollment - Not enrolled in school (%)
School enrollment - Public schools (%)
School enrollment - Private schools (%)
School enrollment - Not enrolled (%)
Median number of rooms in houses and condos
Median number of rooms in apartments
Housing units lacking complete plumbing facilities (%)
Housing units lacking complete kitchen facilities (%)
Density of houses
Urban houses (%)
Rural houses (%)
Households with people 60 years and over (%)
Households with people 65 years and over (%)
Households with people 75 years and over (%)
Households with one or more nonrelatives (%)
Households with no nonrelatives (%)
Population in households (%)
Family households (%)
Nonfamily households (%)
Population in families (%)
Family households with own children (%)
Median number of bedrooms in owner occupied houses
Mean number of bedrooms in owner occupied houses
Median number of bedrooms in renter occupied houses
Mean number of bedrooms in renter occupied houses
Median number of vehichles in owner occupied houses
Mean number of vehichles in owner occupied houses
Median number of vehichles in renter occupied houses
Mean number of vehichles in renter occupied houses
Mortgage status - with mortgage (%)
Mortgage status - with second mortgage (%)
Mortgage status - with home equity loan (%)
Mortgage status - with both second mortgage and home equity loan (%)
Mortgage status - without a mortgage (%)
Average family size
Average family size - White
Average family size - Black or African American
Average family size - Asian
Average family size - Hispanic or Latino
Average family size - American Indian and Alaska Native
Average family size - Multirace
Average family size - Other Race
Geographical mobility - Same house 1 year ago (%)
Geographical mobility - Moved within same county (%)
Geographical mobility - Moved from different county within same state (%)
Geographical mobility - Moved from different state (%)
Geographical mobility - Moved from abroad (%)
Place of birth - Born in state of residence (%)
Place of birth - Born in other state (%)
Place of birth - Native, outside of US (%)
Place of birth - Foreign born (%)
Housing units in structures - 1, detached (%)
Housing units in structures - 1, attached (%)
Housing units in structures - 2 (%)
Housing units in structures - 3 or 4 (%)
Housing units in structures - 5 to 9 (%)
Housing units in structures - 10 to 19 (%)
Housing units in structures - 20 to 49 (%)
Housing units in structures - 50 or more (%)
Housing units in structures - Mobile home (%)
Housing units in structures - Boat, RV, van, etc. (%)
House/condo owner moved in on average (years ago)
Renter moved in on average (years ago)
Year householder moved into unit - Moved in 1999 to March 2000 (%)
Year householder moved into unit - Moved in 1995 to 1998 (%)
Year householder moved into unit - Moved in 1990 to 1994 (%)
Year householder moved into unit - Moved in 1980 to 1989 (%)
Year householder moved into unit - Moved in 1970 to 1979 (%)
Year householder moved into unit - Moved in 1969 or earlier (%)
Means of transportation to work - Drove car alone (%)
Means of transportation to work - Carpooled (%)
Means of transportation to work - Public transportation (%)
Means of transportation to work - Bus or trolley bus (%)
Means of transportation to work - Streetcar or trolley car (%)
Means of transportation to work - Subway or elevated (%)
Means of transportation to work - Railroad (%)
Means of transportation to work - Ferryboat (%)
Means of transportation to work - Taxicab (%)
Means of transportation to work - Motorcycle (%)
Means of transportation to work - Bicycle (%)
Means of transportation to work - Walked (%)
Means of transportation to work - Other means (%)
Working at home (%)
Industry diversity
Most Common Industries - Agriculture, forestry, fishing and hunting, and mining (%)
Most Common Industries - Agriculture, forestry, fishing and hunting (%)
Most Common Industries - Mining, quarrying, and oil and gas extraction (%)
Most Common Industries - Construction (%)
Most Common Industries - Manufacturing (%)
Most Common Industries - Wholesale trade (%)
Most Common Industries - Retail trade (%)
Most Common Industries - Transportation and warehousing, and utilities (%)
Most Common Industries - Transportation and warehousing (%)
Most Common Industries - Utilities (%)
Most Common Industries - Information (%)
Most Common Industries - Finance and insurance, and real estate and rental and leasing (%)
Most Common Industries - Finance and insurance (%)
Most Common Industries - Real estate and rental and leasing (%)
Most Common Industries - Professional, scientific, and management, and administrative and waste management services (%)
Most Common Industries - Professional, scientific, and technical services (%)
Most Common Industries - Management of companies and enterprises (%)
Most Common Industries - Administrative and support and waste management services (%)
Most Common Industries - Educational services, and health care and social assistance (%)
Most Common Industries - Educational services (%)
Most Common Industries - Health care and social assistance (%)
Most Common Industries - Arts, entertainment, and recreation, and accommodation and food services (%)
Most Common Industries - Arts, entertainment, and recreation (%)
Most Common Industries - Accommodation and food services (%)
Most Common Industries - Other services, except public administration (%)
Most Common Industries - Public administration (%)
Occupation diversity
Most Common Occupations - Management, business, science, and arts occupations (%)
Most Common Occupations - Management, business, and financial occupations (%)
Most Common Occupations - Management occupations (%)
Most Common Occupations - Business and financial operations occupations (%)
Most Common Occupations - Computer, engineering, and science occupations (%)
Most Common Occupations - Computer and mathematical occupations (%)
Most Common Occupations - Architecture and engineering occupations (%)
Most Common Occupations - Life, physical, and social science occupations (%)
Most Common Occupations - Education, legal, community service, arts, and media occupations (%)
Most Common Occupations - Community and social service occupations (%)
Most Common Occupations - Legal occupations (%)
Most Common Occupations - Education, training, and library occupations (%)
Most Common Occupations - Arts, design, entertainment, sports, and media occupations (%)
Most Common Occupations - Healthcare practitioners and technical occupations (%)
Most Common Occupations - Health diagnosing and treating practitioners and other technical occupations (%)
Most Common Occupations - Health technologists and technicians (%)
Most Common Occupations - Service occupations (%)
Most Common Occupations - Healthcare support occupations (%)
Most Common Occupations - Protective service occupations (%)
Most Common Occupations - Fire fighting and prevention, and other protective service workers including supervisors (%)
Most Common Occupations - Law enforcement workers including supervisors (%)
Most Common Occupations - Food preparation and serving related occupations (%)
Most Common Occupations - Building and grounds cleaning and maintenance occupations (%)
Most Common Occupations - Personal care and service occupations (%)
Most Common Occupations - Sales and office occupations (%)
Most Common Occupations - Sales and related occupations (%)
Most Common Occupations - Office and administrative support occupations (%)
Most Common Occupations - Natural resources, construction, and maintenance occupations (%)
Most Common Occupations - Farming, fishing, and forestry occupations (%)
Most Common Occupations - Construction and extraction occupations (%)
Most Common Occupations - Installation, maintenance, and repair occupations (%)
Most Common Occupations - Production, transportation, and material moving occupations (%)
Most Common Occupations - Production occupations (%)
Most Common Occupations - Transportation occupations (%)
Most Common Occupations - Material moving occupations (%)
People in Group quarters - Institutionalized population (%)
People in Group quarters - Correctional institutions (%)
People in Group quarters - Federal prisons and detention centers (%)
People in Group quarters - Halfway houses (%)
People in Group quarters - Local jails and other confinement facilities (including police lockups) (%)
People in Group quarters - Military disciplinary barracks (%)
People in Group quarters - State prisons (%)
People in Group quarters - Other types of correctional institutions (%)
People in Group quarters - Nursing homes (%)
People in Group quarters - Hospitals/wards, hospices, and schools for the handicapped (%)
People in Group quarters - Hospitals/wards and hospices for chronically ill (%)
People in Group quarters - Hospices or homes for chronically ill (%)
People in Group quarters - Military hospitals or wards for chronically ill (%)
People in Group quarters - Other hospitals or wards for chronically ill (%)
People in Group quarters - Hospitals or wards for drug/alcohol abuse (%)
People in Group quarters - Mental (Psychiatric) hospitals or wards (%)
People in Group quarters - Schools, hospitals, or wards for the mentally retarded (%)
People in Group quarters - Schools, hospitals, or wards for the physically handicapped (%)
People in Group quarters - Institutions for the deaf (%)
People in Group quarters - Institutions for the blind (%)
People in Group quarters - Orthopedic wards and institutions for the physically handicapped (%)
People in Group quarters - Wards in general hospitals for patients who have no usual home elsewhere (%)
People in Group quarters - Wards in military hospitals for patients who have no usual home elsewhere (%)
People in Group quarters - Juvenile institutions (%)
People in Group quarters - Long-term care (%)
People in Group quarters - Homes for abused, dependent, and neglected children (%)
People in Group quarters - Residential treatment centers for emotionally disturbed children (%)
People in Group quarters - Training schools for juvenile delinquents (%)
People in Group quarters - Short-term care, detention or diagnostic centers for delinquent children (%)
People in Group quarters - Type of juvenile institution unknown (%)
People in Group quarters - Noninstitutionalized population (%)
People in Group quarters - College dormitories (includes college quarters off campus) (%)
People in Group quarters - Military quarters (%)
People in Group quarters - On base (%)
People in Group quarters - Barracks, unaccompanied personnel housing (UPH), (Enlisted/Officer), ;and similar group living quarters for military personnel (%)
People in Group quarters - Transient quarters for temporary residents (%)
People in Group quarters - Military ships (%)
People in Group quarters - Group homes (%)
People in Group quarters - Homes or halfway houses for drug/alcohol abuse (%)
People in Group quarters - Homes for the mentally ill (%)
People in Group quarters - Homes for the mentally retarded (%)
People in Group quarters - Homes for the physically handicapped (%)
People in Group quarters - Other group homes (%)
People in Group quarters - Religious group quarters (%)
People in Group quarters - Dormitories (%)
People in Group quarters - Agriculture workers' dormitories on farms (%)
People in Group quarters - Job Corps and vocational training facilities (%)
People in Group quarters - Other workers' dormitories (%)
People in Group quarters - Crews of maritime vessels (%)
People in Group quarters - Other nonhousehold living situations (%)
People in Group quarters - Other noninstitutional group quarters (%)
Residents speaking English at home (%)
Residents speaking English at home - Born in the United States (%)
Residents speaking English at home - Native, born elsewhere (%)
Residents speaking English at home - Foreign born (%)
Residents speaking Spanish at home (%)
Residents speaking Spanish at home - Born in the United States (%)
Residents speaking Spanish at home - Native, born elsewhere (%)
Residents speaking Spanish at home - Foreign born (%)
Residents speaking other language at home (%)
Residents speaking other language at home - Born in the United States (%)
Residents speaking other language at home - Native, born elsewhere (%)
Residents speaking other language at home - Foreign born (%)
Class of Workers - Employee of private company (%)
Class of Workers - Self-employed in own incorporated business (%)
Class of Workers - Private not-for-profit wage and salary workers (%)
Class of Workers - Local government workers (%)
Class of Workers - State government workers (%)
Class of Workers - Federal government workers (%)
Class of Workers - Self-employed workers in own not incorporated business and Unpaid family workers (%)
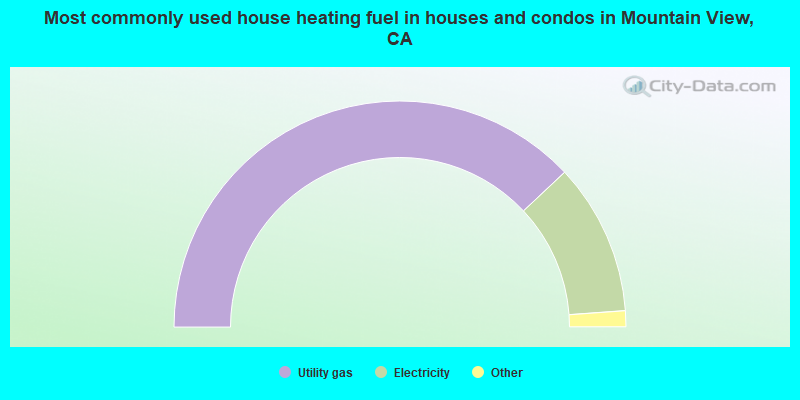
House heating fuel used in houses and condos - Utility gas (%)
House heating fuel used in houses and condos - Bottled, tank, or LP gas (%)
House heating fuel used in houses and condos - Electricity (%)
House heating fuel used in houses and condos - Fuel oil, kerosene, etc. (%)
House heating fuel used in houses and condos - Coal or coke (%)
House heating fuel used in houses and condos - Wood (%)
House heating fuel used in houses and condos - Solar energy (%)
House heating fuel used in houses and condos - Other fuel (%)
House heating fuel used in houses and condos - No fuel used (%)
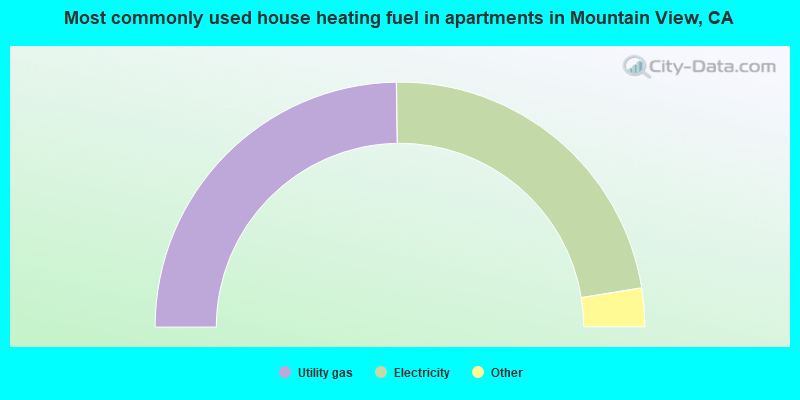
House heating fuel used in apartments - Utility gas (%)
House heating fuel used in apartments - Bottled, tank, or LP gas (%)
House heating fuel used in apartments - Electricity (%)
House heating fuel used in apartments - Fuel oil, kerosene, etc. (%)
House heating fuel used in apartments - Coal or coke (%)
House heating fuel used in apartments - Wood (%)
House heating fuel used in apartments - Solar energy (%)
House heating fuel used in apartments - Other fuel (%)
House heating fuel used in apartments - No fuel used (%)
Armed forces status - In Armed Forces (%)
Armed forces status - Civilian (%)
Armed forces status - Civilian - Veteran (%)
Armed forces status - Civilian - Nonveteran (%)
Fatal accidents locations in years 2005-2021
Fatal accidents locations in 2005
Fatal accidents locations in 2006
Fatal accidents locations in 2007
Fatal accidents locations in 2008
Fatal accidents locations in 2009
Fatal accidents locations in 2010
Fatal accidents locations in 2011
Fatal accidents locations in 2012
Fatal accidents locations in 2013
Fatal accidents locations in 2014
Fatal accidents locations in 2015
Fatal accidents locations in 2016
Fatal accidents locations in 2017
Fatal accidents locations in 2018
Fatal accidents locations in 2019
Fatal accidents locations in 2020
Fatal accidents locations in 2021
Alcohol use - People drinking some alcohol every month (%)
Alcohol use - People not drinking at all (%)
Alcohol use - Average days/month drinking alcohol
Alcohol use - Average drinks/week
Alcohol use - Average days/year people drink much
Audiometry - Average condition of hearing (%)
Audiometry - People that can hear a whisper from across a quiet room (%)
Audiometry - People that can hear normal voice from across a quiet room (%)
Audiometry - Ears ringing, roaring, buzzing (%)
Audiometry - Had a job exposure to loud noise (%)
Audiometry - Had off-work exposure to loud noise (%)
Blood Pressure & Cholesterol - Has high blood pressure (%)
Blood Pressure & Cholesterol - Checking blood pressure at home (%)
Blood Pressure & Cholesterol - Frequently checking blood cholesterol (%)
Blood Pressure & Cholesterol - Has high cholesterol level (%)
Consumer Behavior - Money monthly spent on food at supermarket/grocery store
Consumer Behavior - Money monthly spent on food at other stores
Consumer Behavior - Money monthly spent on eating out
Consumer Behavior - Money monthly spent on carryout/delivered foods
Consumer Behavior - Income spent on food at supermarket/grocery store (%)
Consumer Behavior - Income spent on food at other stores (%)
Consumer Behavior - Income spent on eating out (%)
Consumer Behavior - Income spent on carryout/delivered foods (%)
Current Health Status - General health condition (%)
Current Health Status - Blood donors (%)
Current Health Status - Has blood ever tested for HIV virus (%)
Current Health Status - Left-handed people (%)
Dermatology - People using sunscreen (%)
Diabetes - Diabetics (%)
Diabetes - Had a blood test for high blood sugar (%)
Diabetes - People taking insulin (%)
Diet Behavior & Nutrition - Diet health (%)
Diet Behavior & Nutrition - Milk product consumption (# of products/month)
Diet Behavior & Nutrition - Meals not home prepared (#/week)
Diet Behavior & Nutrition - Meals from fast food or pizza place (#/week)
Diet Behavior & Nutrition - Ready-to-eat foods (#/month)
Diet Behavior & Nutrition - Frozen meals/pizza (#/month)
Drug Use - People that ever used marijuana or hashish (%)
Drug Use - Ever used hard drugs (%)
Drug Use - Ever used any form of cocaine (%)
Drug Use - Ever used heroin (%)
Drug Use - Ever used methamphetamine (%)
Health Insurance - People covered by health insurance (%)
Kidney Conditions-Urology - Avg. # of times urinating at night
Medical Conditions - People with asthma (%)
Medical Conditions - People with anemia (%)
Medical Conditions - People with psoriasis (%)
Medical Conditions - People with overweight (%)
Medical Conditions - Elderly people having difficulties in thinking or remembering (%)
Medical Conditions - People who ever received blood transfusion (%)
Medical Conditions - People having trouble seeing even with glass/contacts (%)
Medical Conditions - People with arthritis (%)
Medical Conditions - People with gout (%)
Medical Conditions - People with congestive heart failure (%)
Medical Conditions - People with coronary heart disease (%)
Medical Conditions - People with angina pectoris (%)
Medical Conditions - People who ever had heart attack (%)
Medical Conditions - People who ever had stroke (%)
Medical Conditions - People with emphysema (%)
Medical Conditions - People with thyroid problem (%)
Medical Conditions - People with chronic bronchitis (%)
Medical Conditions - People with any liver condition (%)
Medical Conditions - People who ever had cancer or malignancy (%)
Mental Health - People who have little interest in doing things (%)
Mental Health - People feeling down, depressed, or hopeless (%)
Mental Health - People who have trouble sleeping or sleeping too much (%)
Mental Health - People feeling tired or having little energy (%)
Mental Health - People with poor appetite or overeating (%)
Mental Health - People feeling bad about themself (%)
Mental Health - People who have trouble concentrating on things (%)
Mental Health - People moving or speaking slowly or too fast (%)
Mental Health - People having thoughts they would be better off dead (%)
Oral Health - Average years since last visit a dentist
Oral Health - People embarrassed because of mouth (%)
Oral Health - People with gum disease (%)
Oral Health - General health of teeth and gums (%)
Oral Health - Average days a week using dental floss/device
Oral Health - Average days a week using mouthwash for dental problem
Oral Health - Average number of teeth
Pesticide Use - Households using pesticides to control insects (%)
Pesticide Use - Households using pesticides to kill weeds (%)
Physical Activity - People doing vigorous-intensity work activities (%)
Physical Activity - People doing moderate-intensity work activities (%)
Physical Activity - People walking or bicycling (%)
Physical Activity - People doing vigorous-intensity recreational activities (%)
Physical Activity - People doing moderate-intensity recreational activities (%)
Physical Activity - Average hours a day doing sedentary activities
Physical Activity - Average hours a day watching TV or videos
Physical Activity - Average hours a day using computer
Physical Functioning - People having limitations keeping them from working (%)
Physical Functioning - People limited in amount of work they can do (%)
Physical Functioning - People that need special equipment to walk (%)
Physical Functioning - People experiencing confusion/memory problems (%)
Physical Functioning - People requiring special healthcare equipment (%)
Prescription Medications - Average number of prescription medicines taking
Preventive Aspirin Use - Adults 40+ taking low-dose aspirin (%)
Reproductive Health - Vaginal deliveries (%)
Reproductive Health - Cesarean deliveries (%)
Reproductive Health - Deliveries resulted in a live birth (%)
Reproductive Health - Pregnancies resulted in a delivery (%)
Reproductive Health - Women breastfeeding newborns (%)
Reproductive Health - Women that had a hysterectomy (%)
Reproductive Health - Women that had both ovaries removed (%)
Reproductive Health - Women that have ever taken birth control pills (%)
Reproductive Health - Women taking birth control pills (%)
Reproductive Health - Women that have ever used Depo-Provera or injectables (%)
Reproductive Health - Women that have ever used female hormones (%)
Sexual Behavior - People 18+ that ever had sex (vaginal, anal, or oral) (%)
Sexual Behavior - Males 18+ that ever had vaginal sex with a woman (%)
Sexual Behavior - Males 18+ that ever performed oral sex on a woman (%)
Sexual Behavior - Males 18+ that ever had anal sex with a woman (%)
Sexual Behavior - Males 18+ that ever had any sex with a man (%)
Sexual Behavior - Females 18+ that ever had vaginal sex with a man (%)
Sexual Behavior - Females 18+ that ever performed oral sex on a man (%)
Sexual Behavior - Females 18+ that ever had anal sex with a man (%)
Sexual Behavior - Females 18+ that ever had any kind of sex with a woman (%)
Sexual Behavior - Average age people first had sex
Sexual Behavior - Average number of female sex partners in lifetime (males 18+)
Sexual Behavior - Average number of female vaginal sex partners in lifetime (males 18+)
Sexual Behavior - Average age people first performed oral sex on a woman (18+)
Sexual Behavior - Average number of woman performed oral sex on in lifetime (18+)
Sexual Behavior - Average number of male sex partners in lifetime (males 18+)
Sexual Behavior - Average number of male anal sex partners in lifetime (males 18+)
Sexual Behavior - Average age people first performed oral sex on a man (18+)
Sexual Behavior - Average number of male oral sex partners in lifetime (18+)
Sexual Behavior - People using protection when performing oral sex (%)
Sexual Behavior - Average number of times people have vaginal or anal sex a year
Sexual Behavior - People having sex without condom (%)
Sexual Behavior - Average number of male sex partners in lifetime (females 18+)
Sexual Behavior - Average number of male vaginal sex partners in lifetime (females 18+)
Sexual Behavior - Average number of female sex partners in lifetime (females 18+)
Sexual Behavior - Circumcised males 18+ (%)
Sleep Disorders - Average hours sleeping at night
Sleep Disorders - People that has trouble sleeping (%)
Smoking-Cigarette Use - People smoking cigarettes (%)
Taste & Smell - People 40+ having problems with smell (%)
Taste & Smell - People 40+ having problems with taste (%)
Taste & Smell - People 40+ that ever had wisdom teeth removed (%)
Taste & Smell - People 40+ that ever had tonsils teeth removed (%)
Taste & Smell - People 40+ that ever had a loss of consciousness because of a head injury (%)
Taste & Smell - People 40+ that ever had a broken nose or other serious injury to face or skull (%)
Taste & Smell - People 40+ that ever had two or more sinus infections (%)
Weight - Average height (inches)
Weight - Average weight (pounds)
Weight - Average BMI
Weight - People that are obese (%)
Weight - People that ever were obese (%)
Weight - People trying to lose weight (%)
31,527 38.9% White alone 26,850 33.1% Asian alone 16,278 20.1% Hispanic 5,559 6.9% Two or more races 404 0.5% Black alone 375 0.5% Other race alone 65 0.08% American Indian alone
According to our research of California and other state lists, there were 36 registered sex offenders living in Mountain View, California as of April 26, 2024 . The ratio of all residents to sex offenders in Mountain View is 2,230 to 1.The ratio of registered sex offenders to all residents in this city is much lower than the state average.
The City-Data.com crime index weighs serious crimes and violent crimes more heavily. Higher means more crime, U.S. average is 246.1. It adjusts for the number of visitors and daily workers commuting into cities.
- means the value is smaller than the state average.
- means the value is about the same as the state average.
- means the value is bigger than the state average.
- means the value is much bigger than the state average.
Crime rate in Mountain View detailed stats: murders, rapes, robberies, assaults, burglaries, thefts, arson Officers per 1,000 residents here:
1.09California average:
2.30
Latest news from Mountain View, CA collected exclusively by city-data.com from local newspapers, TV, and radio stations
Ancestries: American (3.0%), European (2.6%), English (2.5%), Russian (2.4%), German (2.2%), Irish (2.1%).
Current Local Time:
Land area: 12.1 square miles.
Population density: 6,719 people per square mile (high).
34,501 residents are foreign born (23.7% Asia , 8.5% Latin America , 7.0% Europe ).
This city:
43.0%California:
26.5%
Median real estate property taxes paid for housing units with mortgages in 2022: $10,001 (0.5%)Median real estate property taxes paid for housing units with no mortgage in 2022: $5,793 (0.4%)
Nearest city with pop. 200,000+: Fremont, CA
Nearest city with pop. 1,000,000+: Los Angeles, CA
Nearest cities:
Latitude: 37.39 N, Longitude: 122.08 W
Daytime population change due to commuting: +36,566 (+45.1%)Workers who live and work in this city: 21,557 (48.5%)
Mountain View tourist attractions:
Single-family new house construction building permits:
2022: 90 buildings , average cost: $413,5002021: 172 buildings , average cost: $337,9002020: 87 buildings , average cost: $350,6002019: 79 buildings , average cost: $342,3002018: 72 buildings , average cost: $380,5002017: 162 buildings , average cost: $302,0002016: 107 buildings , average cost: $308,0002015: 77 buildings , average cost: $312,2002014: 106 buildings , average cost: $275,1002013: 110 buildings , average cost: $276,4002012: 86 buildings , average cost: $395,1002011: 63 buildings , average cost: $405,8002010: 66 buildings , average cost: $302,6002009: 90 buildings , average cost: $299,5002008: 101 buildings , average cost: $271,8002007: 267 buildings , average cost: $264,8002006: 151 buildings , average cost: $251,6002005: 81 buildings , average cost: $234,5002004: 35 buildings , average cost: $291,3002003: 90 buildings , average cost: $157,3002002: 25 buildings , average cost: $214,5002001: 118 buildings , average cost: $192,0002000: 121 buildings , average cost: $192,4001999: 106 buildings , average cost: $171,6001998: 278 buildings , average cost: $165,7001997: 295 buildings , average cost: $164,100Unemployment in December 2023:
Population change in the 1990s: +3,974 (+6.0%).
Most common industries in Mountain View, CA (%)
Both Males Females
Professional, scientific, technical services (18.9%)
Computer & electronic products (17.1%)
Educational services (8.4%)
Health care (5.5%)
Accommodation & food services (4.8%)
Data processing, libraries, other information services (3.7%)
Administrative & support & waste management services (3.3%)
Professional, scientific, technical services (20.4%)
Computer & electronic products (20.0%)
Educational services (5.5%)
Accommodation & food services (4.8%)
Construction (4.8%)
Data processing, libraries, other information services (4.0%)
Administrative & support & waste management services (3.2%)
Professional, scientific, technical services (17.0%)
Computer & electronic products (13.4%)
Educational services (12.2%)
Health care (9.5%)
Accommodation & food services (4.8%)
Finance & insurance (3.4%)
Administrative & support & waste management services (3.3%)
Earthquake activity:
Mountain View-area historical earthquake activity is significantly above California state average. It is 7545% greater than the overall U.S. average. On 4/18/1906 at 13:12:21, a magnitude 7.9 (7.9 UK, Class: Major, Intensity: VIII - XII) earthquake occurred 65.5 miles away from Mountain View center, causing $524,000,000 total damage On 10/18/1989 at 00:04:15, a magnitude 7.1 (6.5 MB, 7.1 MS, 6.9 MW, 7.0 ML) earthquake occurred 26.0 miles away from Mountain View center, causing 62 deaths ( 62 shaking deaths) and 3757 injuries, causing $1,305,032,704 total damage On 11/4/1927 at 13:51:53, a magnitude 7.5 (7.5 UK) earthquake occurred 181.1 miles away from the city center On 7/21/1952 at 11:52:14, a magnitude 7.7 (7.7 UK) earthquake occurred 238.7 miles away from Mountain View center, causing $50,000,000 total damage On 1/31/1922 at 13:17:28, a magnitude 7.6 (7.6 UK) earthquake occurred 295.1 miles away from the city center On 4/25/1992 at 18:06:04, a magnitude 7.2 (6.3 MB, 7.1 MS, 7.2 MW, 7.1 MW, Depth: 9.4 mi) earthquake occurred 230.8 miles away from Mountain View center, causing $75,000,000 total damage Magnitude types: body-wave magnitude (MB), local magnitude (ML), surface-wave magnitude (MS), moment magnitude (MW) Natural disasters: The number of natural disasters in Santa Clara County (19) is greater than the US average (15).Major Disasters (Presidential) Declared: 10Emergencies Declared: 3Floods: 9, Fires: 5, Winter Storms: 5, Storms: 4, Mudslides: 3, Landslides: 2, Drought: 1, Earthquake: 1, Freeze: 1, Hurricane: 1, Tornado: 1, Other: 1 (Note: some incidents may be assigned to more than one category). Main business address for: SYNOPSYS INC SERVICES-PREPACKAGED SOFTWARE ), SILICON GRAPHICS INC ELECTRONIC COMPUTERS ), ACTEL CORP SEMICONDUCTORS & RELATED DEVICES ), RITA MEDICAL SYSTEMS INC ELECTROMEDICAL & ELECTROTHERAPEUTIC APPARATUS ), INTUIT INC SERVICES-PREPACKAGED SOFTWARE ), INTRABIOTICS PHARMACEUTICALS INC /DE PHARMACEUTICAL PREPARATIONS ), ACLARA BIOSCIENCES INC MEASURING & CONTROLLING DEVICES, NEC ), VIVUS INC SURGICAL & MEDICAL INSTRUMENTS & APPARATUS ) and 19 other public companies .
Hospitals and medical centers in Mountain View: EL CAMINO HOSPITAL (Voluntary non-profit - Other, provides emergency services, 2500 GRANT ROAD) EL CAMINO SURGERY CENTER (2480 GRANT ROAD) GRANT CUESTA SUB-ACUTE AND REHABILITATION CENTER (1949 GRANT ROAD)
MOUNTAIN VIEW HEALTHCARE CTR (2530 SOLACE PLACE)
VILLA SIENA (1855 MIRAMONTE AVENUE)
EL CAMINO DIALYSIS CENTER (2490 GRANT ROAD)
Airports located in Mountain View: Amtrak stations near Mountain View: 8 miles: SANTA CLARA-GREAT AMERICA (SANTA CLARA, FOOT OF STARS & STRIPES DR.) Services: partially wheelchair accessible, free short-term parking.
11 miles: SAN JOSE (65 CAHILL ST.) Services: ticket office, fully wheelchair accessible, enclosed waiting area, public restrooms, public payphones, paid short-term parking, free long-term parking, taxi stand, public transit connection.
13 miles: FREMONT (CENTERVILLE, FREMONT & PERALTA BLVDS.) Services: fully wheelchair accessible, enclosed waiting area, public restrooms, public payphones, snack bar, free short-term parking, free long-term parking, call for car rental service, call for taxi service, public transit connection.
Colleges/universities with over 2000 students nearest to Mountain View:
Foothill College (about 4 miles; Los Altos Hills, CA ; Full-time enrollment: 9,635)
De Anza College (about 6 miles; Cupertino, CA ; FT enrollment: 16,729)
Mission College (about 6 miles; Santa Clara, CA ; FT enrollment: 5,625)
Stanford University (about 7 miles; Stanford, CA ; FT enrollment: 14,410)
Santa Clara University (about 9 miles; Santa Clara, CA ; FT enrollment: 7,640)
West Valley College (about 10 miles; Saratoga, CA ; FT enrollment: 6,128)
San Jose City College (about 10 miles; San Jose, CA ; FT enrollment: 5,526)
Public high schools in Mountain View: ALTA VISTA HIGH Students: 39, Location: 1325 BRYANT AVE., Grades: 9-12)MOUNTAIN VIEW HIGH Location: 3535 TRUMAN AVE., Grades: 9-12)
Private high schools in Mountain View: ST FRANCIS HIGH SCHOOL Students: 1,728, Location: 1885 MIRAMONTE AVE, Grades: 9-12)
GERMAN INTERNATIONAL SCHOOL OF SILICON VALLEY Students: 389, Location: 310 EASY ST, Grades: PK-12)
MOUNTAIN VIEW ACADEMY Students: 147, Location: 360 S SHORELINE BLVD, Grades: 9-12)Biggest public elementary/middle schools in Mountain View: ISAAC NEWTON GRAHAM MIDDLE Students: 635, Location: 1175 CASTRO ST., Grades: 6-8)CRITTENDEN MIDDLE Students: 541, Location: 1701 ROCK ST., Grades: 6-8)MARIANO CASTRO ELEMENTARY Students: 405, Location: 505 ESCUELA AVE., Grades: KG-5)SPRINGER ELEMENTARY Students: 358, Location: 1120 ROSE AVE., Grades: KG-6)FRANK L. HUFF ELEMENTARY Students: 337, Location: 253 MARTENS AVE., Grades: KG-5)BENJAMIN BUBB ELEMENTARY Students: 325, Location: 525 HANS AVE., Grades: KG-5)EDITH LANDELS ELEMENTARY Students: 294, Location: 115 W. DANA ST., Grades: KG-5)THEUERKAUF ELEMENTARY Students: 287, Location: 1625 SAN LUIS AVE., Grades: KG-5)MONTA LOMA ELEMENTARY Students: 276, Location: 460 THOMPSON AVE., Grades: KG-5)STEVENSON ELEMENTARY Students: 121, Location: 750B SAN PIERRE WAY, Grades: KG-5)Private elementary/middle schools in Mountain View: ST JOSEPH ELEMENTARY SCHOOL Students: 219, Location: 1120 MIRAMONTE AVE, Grades: KG-8)
YEW CHUNG INTERNATIONAL SCHOOL (SV) Students: 181, Location: 310 EASY ST, Grades: PK-5)
SANYU LEARNING CENTER Students: 74, Location: 1425 S SPRINGER RD, Grades: KG-5)
ST STEPHEN LUTHERAN SCHOOL Students: 23, Location: 320 MOORPARK WAY, Grades: KG-8)
See full list of schools located in Mountain View Library in Mountain View: MOUNTAIN VIEW PUBLIC LIBRARY Operating income: $4,952,356; Location: 585 FRANKLIN ST.; 252,633 books ; 1,845 e-books ; 23,637 audio materials ; 19,532 video materials ; 1 local licensed databases ; 1 state licensed databases ; 35 other licensed databases ; 340 print serial subscriptions )
User-submitted facts and corrections:
additional ZIP code: 94040
Map shows Martinez, CA -- not Mountain View, CA
The local detail map is NOT where Mountain View is in the Bay area! Located between Sunnyvale and Palo Alto in the South Bay Mountain View is next to Moffett Field.
Mayfield Shopping Center has been converted to offices and the site is being considered as a housing development. added by vbk
Notable locations in Mountain View: (A) , Shoreline Amphitheatre (B) , Contra Costa County Fire Protection District Station 12 (C) , Mountain View Fire Department Station 4 (D) , Mountain View Fire Department Station 5 (E) , Mountain View Fire Department Station 2 (F) , Mountain View Fire Department Station 3 (G) , Mountain View Fire Department Station 1 (H) , Mountain View Civic Center (I) , Mountain View Senior Citizens Center (J) . Display/hide their locations on the map
Shopping Centers: (1) , Mountain View Alpha Beta Shopping Center (2) , San Antonio Shopping Center (3) , Old Mill Specialty Shopping Center (4) , Oildale Shopping Center (5) , Mountain View Shopping Center (6) , Mayfield Mall Shopping Center (7) , Grant Road Plaza Shopping Center (8) , Grant Park Plaza Shopping Center (9) . Display/hide their locations on the map
Main business address in Mountain View include: (A) , SILICON GRAPHICS INC (B) , ACTEL CORP (C) , RITA MEDICAL SYSTEMS INC (D) , INTUIT INC (E) , INTRABIOTICS PHARMACEUTICALS INC /DE (F) , ACLARA BIOSCIENCES INC (G) , VIVUS INC (H) . Display/hide their locations on the map
Churches in Mountain View include: (A) , Zen Meditation Center (B) , Chinese Church In Christ (C) , Church of Divine Man (D) , Church of Scientology (E) , Cornerstone Evangelical Free Church (F) , Friendly Tabernacle (G) , Kingdom Hall of Jehovahs Witnesses (H) , Living Waters Assembly of God Church (I) . Display/hide their locations on the map
Reservoirs and swamps: (A) , Stevens Creek Tidal Marsh (B) , Mountain View Tidal Marsh (C) . Display/hide their locations on the map
Creek: (A) . Display/hide its location on the map
Parks in Mountain View include: (1) , Bubb Park (2) , Crittenden School Park (3) , Graham School Park (4) , Monta Loma School Park (5) , Mountain View Recreation Center (6) , Mountain View Sports Pavillion (7) , Rengstorff Park (8) , Rex Manor Playground (9) . Display/hide their locations on the map
Tourist attraction: (1) . Display/hide its approximate location on the map
Hotels: (1) , American Inn (1012 West El Camino Real) (2) . Display/hide their approximate locations on the map
Birthplace of: Brian Boitano - Figure skater, Kenny Roberts, Jr. - Motorcycle racer, Paula Creamer - Professional golfer, Elena Myers - Motorcycle racer, Doris Gates - Children's Author, Jason Simontacchi - Baseball player, Brandon Crawford - Baseball player, Brendan Nyhan - Blogger, Chase Lyman - 2005 NFL player (New Orleans Saints, born : Sep 4, 1982), Clint Baker - Jazz musician.
Santa Clara County has a predicted average indoor radon screening level between 2 and 4 pCi/L (pico curies per liter) - Moderate Potential Average household size: This city:
2.3 peopleCalifornia:
2.9 people
Percentage of family households: This city:
54.8%Whole state:
68.7%
Percentage of households with unmarried partners: This city:
6.9%Whole state:
7.2%
Likely homosexual households (counted as self-reported same-sex unmarried-partner households)
Lesbian couples: 0.4% of all households Gay men: 0.5% of all households
People in group quarters in Mountain View in 2010:
107 people in nursing facilities/skilled-nursing facilities
79 people in group homes intended for adults
30 people in other noninstitutional facilities
16 people in workers' group living quarters and job corps centers
15 people in emergency and transitional shelters (with sleeping facilities) for people experiencing homelessness
13 people in group homes for juveniles (non-correctional)
5 people in residential treatment centers for adults
People in group quarters in Mountain View in 2000:
278 people in nursing homes
142 people in other noninstitutional group quarters
29 people in hospitals/wards and hospices for chronically ill
29 people in other hospitals or wards for chronically ill
22 people in religious group quarters
13 people in homes or halfway houses for drug/alcohol abuse
8 people in other group homes
6 people in homes for the mentally ill
6 people in homes for the mentally retarded
Banks with most branches in Mountain View (2011 data):
Wells Fargo Bank, National Association: Miramonte Branch, San Antonio Branch, Grant Park Plaza, Mountain View Branch. Info updated 2011/04/05: Bank assets: $1,161,490.0 mil, Deposits: $905,653.0 mil, headquarters in Sioux Falls, SD, positive income , 6395 total offices , Holding Company: Wells Fargo & Company
Bank of America, National Association: San Antonio Branch at 384 South San Antonio Road, branch established on 1956/01/23; Mountain View Main Branch at 444 Castro Street, Suite 100, branch established on 1927/02/19. Info updated 2009/11/18: Bank assets: $1,451,969.3 mil, Deposits: $1,077,176.8 mil, headquarters in Charlotte, NC, positive income , 5782 total offices , Holding Company: Bank Of America Corporation
JPMorgan Chase Bank, National Association: Mountain View Branch at 2510 West El Camino Real, Suite-1, branch established on 2006/11/20; 749 El Camino Real Branch at 749 El Camino Real, branch established on 1889/01/01. Info updated 2011/11/10: Bank assets: $1,811,678.0 mil, Deposits: $1,190,738.0 mil, headquarters in Columbus, OH, positive income , International Specialization, 5577 total offices , Holding Company: Jpmorgan Chase & Co.
U.S. Bank National Association: Grant Road - Nob Hill Foods Branch at 1250 Grant Road, branch established on 2006/11/08; Mountain View Branch at 1570 Grant Road, branch established on 1973/10/01. Info updated 2012/01/30: Bank assets: $330,470.8 mil, Deposits: $236,091.5 mil, headquarters in Cincinnati, OH, positive income , 3121 total offices , Holding Company: U.S. Bancorp
Bank of the West: Mountain View Branch at 501 Castro Street, branch established on 1954/12/20. Info updated 2009/11/16: Bank assets: $62,408.3 mil, Deposits: $43,995.2 mil, headquarters in San Francisco, CA, positive income , 647 total offices , Holding Company: Bnp Paribas
Citibank, National Association: 608 San Antonio Road Branch at 608 San Antonio Road, branch established on 1936/02/01. Info updated 2012/01/10: Bank assets: $1,288,658.0 mil, Deposits: $882,541.0 mil, headquarters in Sioux Falls, SD, positive income , International Specialization, 1048 total offices , Holding Company: Citigroup Inc.
California Bank & Trust: Mountain View Branch at 700 West El Camino Real, branch established on 1966/12/14. Info updated 2009/07/20: Bank assets: $10,894.1 mil, Deposits: $9,193.9 mil, headquarters in San Diego, CA, positive income , Commercial Lending Specialization, 109 total offices , Holding Company: Zions Bancorporation
Heritage Bank of Commerce: Mountain View Branch at 175 East El Camino Real, branch established on 1998/05/19. Info updated 2007/07/02: Bank assets: $1,303.2 mil, Deposits: $1,073.8 mil, headquarters in San Jose, CA, positive income , Commercial Lending Specialization, 12 total offices , Holding Company: Heritage Commerce Corp
Bay Commercial Bank: Mountain View Branch at 700 E. El Camino Real, Suite 300, branch established on 2008/12/03. Info updated 2011/12/05: Bank assets: $269.6 mil, Deposits: $219.8 mil, headquarters in Walnut Creek, CA, positive income , Commercial Lending Specialization, 4 total offices
For population 15 years and over in Mountain View:
Never married: 36.3%Now married: 51.6%Separated: 0.9%Widowed: 4.0%Divorced: 7.2% For population 25 years and over in Mountain View:
High school or higher: 94.5%Bachelor's degree or higher: 74.7%Graduate or professional degree: 45.6%Unemployed: 2.7%Mean travel time to work (commute): 15.4 minutes
Education Gini index (Inequality in education) Here:
12.1California average:
15.5
Religion statistics for Mountain View, CA (based on Santa Clara County data)
Religion Adherents Congregations Catholic 447,369 56 Evangelical Protestant 148,599 481 Other 125,165 221 Mainline Protestant 44,623 132 Orthodox 7,720 17 Black Protestant 2,552 20 None 1,005,614 -
Source: Clifford Grammich, Kirk Hadaway, Richard Houseal, Dale E.Jones, Alexei Krindatch, Richie Stanley and Richard H.Taylor. 2012. 2010 U.S.Religion Census: Religious Congregations & Membership Study. Association of Statisticians of American Religious Bodies. Jones, Dale E., et al. 2002. Congregations and Membership in the United States 2000. Nashville, TN: Glenmary Research Center. Graphs represent county-level data
Food Environment Statistics: Number of grocery stores : 345Santa Clara County :
1.99 / 10,000 pop.State :
2.14 / 10,000 pop.
Number of supercenters and club stores : 7This county :
0.04 / 10,000 pop.State :
0.04 / 10,000 pop.
Number of convenience stores (no gas) : 117Here :
0.68 / 10,000 pop.California :
0.62 / 10,000 pop.
Number of convenience stores (with gas) : 239Santa Clara County :
1.38 / 10,000 pop.California :
1.49 / 10,000 pop.
Number of full-service restaurants : 1,488This county :
8.59 / 10,000 pop.California :
7.42 / 10,000 pop.
Adult diabetes rate : Santa Clara County :
7.1%California :
7.3%
Adult obesity rate : Santa Clara County :
19.0%California :
21.3%
Low-income preschool obesity rate : Santa Clara County :
16.6%California :
17.9%
Health and Nutrition: Healthy diet rate : Mountain View:
52.7%California:
49.4%
Average overall health of teeth and gums : Mountain View:
51.0%California:
48.0%
People feeling badly about themselves : Mountain View:
17.2%California:
20.2%
People not drinking alcohol at all : Here:
11.5%California:
11.2%
Average hours sleeping at night : Overweight people : This city:
28.4%California:
31.5%
General health condition : Mountain View:
60.0%State:
56.4%
Average condition of hearing : This city:
82.4%California:
80.9%
More about Health and Nutrition of Mountain View, CA Residents
Local government employment and payroll (March 2022)
Function
Full-time employees
Monthly full-time payroll
Average yearly full-time wage
Part-time employees
Monthly part-time payroll
Police Protection - Officers
117 $1,795,970 $184,202 15 $30,635 Parks and Recreation
72 $736,965 $122,828 103 $85,053 Streets and Highways
64 $799,027 $149,818 14 $74,303 Firefighters
63 $1,347,455 $256,658 0 $0 Housing and Community Development (Local)
56 $633,799 $135,814 3 $13,819 Financial Administration
52 $543,576 $125,441 3 $11,244 Other Government Administration
34 $333,037 $117,542 7 $18,598 Water Supply
31 $320,091 $123,906 0 $0 Local Libraries
30 $226,039 $90,416 22 $38,070 Fire - Other
14 $182,803 $156,688 0 $0 Police - Other
13 $159,367 $147,108 1 $5,635 Other and Unallocable
12 $113,128 $113,128 0 $0 Judicial and Legal
9 $127,519 $170,025 1 $2,529 Solid Waste Management
5 $42,629 $102,310 0 $0 Natural Resources
5 $49,407 $118,577 0 $0
Totals for Government
577 $7,410,811 $154,124 169 $279,886
Mountain View government finances - Expenditure in 2021 (per resident):
Construction - Regular Highways: $18,723,000 ($230.98)
Parks and Recreation: $16,602,000 ($204.81)General - Other: $12,275,000 ($151.43)Police Protection: $3,215,000 ($39.66)General Public Buildings: $3,086,000 ($38.07)Central Staff Services: $2,399,000 ($29.60)Housing and Community Development: $2,213,000 ($27.30)Local Fire Protection: $313,000 ($3.86)Libraries: $4,000 ($0.05)Current Operations - Central Staff Services: $64,590,000 ($796.83)
Police Protection: $37,985,000 ($468.61)Water Utilities: $31,733,000 ($391.48)Parks and Recreation: $30,211,000 ($372.70)Local Fire Protection: $29,995,000 ($370.04)Sewerage: $19,392,000 ($239.23)Solid Waste Management: $13,230,000 ($163.21)Protective Inspection and Regulation - Other: $12,800,000 ($157.91)Regular Highways: $6,877,000 ($84.84)Libraries: $5,420,000 ($66.86)Financial Administration: $5,346,000 ($65.95)General - Other: $4,931,000 ($60.83)Housing and Community Development: $4,684,000 ($57.79)Judicial and Legal Services: $2,130,000 ($26.28)Transit Utilities: $1,371,000 ($16.91)Parking Facilities: $565,000 ($6.97)General - Interest on Debt: $13,602,000 ($167.80)
Other Capital Outlay - Police Protection: $369,000 ($4.55)
Local Fire Protection: $119,000 ($1.47)Parks and Recreation: $51,000 ($0.63)General - Other: $21,000 ($0.26)Regular Highways: $9,000 ($0.11)Water Utilities - Interest on Debt: $251,000 ($3.10)
Mountain View government finances - Revenue in 2021 (per resident):
Charges - Sewerage: $24,762,000 ($305.48)
Other: $21,038,000 ($259.54)Solid Waste Management: $14,732,000 ($181.74)Parks and Recreation: $4,789,000 ($59.08)Housing and Community Development: $1,405,000 ($17.33)Parking Facilities: $210,000 ($2.59)Federal Intergovernmental - Other: $2,728,000 ($33.65)
Housing and Community Development: $349,000 ($4.31)Local Intergovernmental - Other: $152,000 ($1.88)
Miscellaneous - General Revenue - Other: $36,643,000 ($452.05)
Special Assessments: $34,199,000 ($421.90)Rents: $21,673,000 ($267.37)Interest Earnings: $2,216,000 ($27.34)Fines and Forfeits: $306,000 ($3.78)Donations From Private Sources: $99,000 ($1.22)Revenue - Water Utilities: $40,427,000 ($498.74)
State Intergovernmental - Highways: $3,327,000 ($41.04)
Other: $827,000 ($10.20)General Local Government Support: $181,000 ($2.23)Tax - Property: $171,594,000 ($2116.90)
General Sales and Gross Receipts: $18,284,000 ($225.56)Public Utilities Sales: $12,899,000 ($159.13)Other License: $9,380,000 ($115.72)Documentary and Stock Transfer: $8,689,000 ($107.19)Occupation and Business License - Other: $4,862,000 ($59.98)Other Selective Sales: $1,918,000 ($23.66)Other: $581,000 ($7.17)
Mountain View government finances - Debt in 2021 (per resident):
Long Term Debt - Beginning Outstanding - Unspecified Public Purpose: $211,865,000 ($2613.71)
Outstanding Unspecified Public Purpose: $202,621,000 ($2499.67)Retired Unspecified Public Purpose: $9,244,000 ($114.04)
Mountain View government finances - Cash and Securities in 2021 (per resident):
Bond Funds - Cash and Securities: $401,106,000 ($4948.32)
Other Funds - Cash and Securities: $557,676,000 ($6879.88)
Sinking Funds - Cash and Securities: $13,045,000 ($160.93)
5.37% of this county's 2021 resident taxpayers lived in other counties in 2020 ($152,550 average adjusted gross income )
Here:
5.37%California average:
5.19%
0.01% of residents moved from foreign countries ($93 average AGI )Santa Clara County:
0.01%California average:
0.03%
Top counties from which taxpayers relocated into this county between 2020 and 2021:
7.70% of this county's 2020 resident taxpayers moved to other counties in 2021 ($201,706 average adjusted gross income )
Here:
7.70%California average:
6.14%
0.01% of residents moved to foreign countries ($110 average AGI )Santa Clara County:
0.01%California average:
0.02%
Top counties to which taxpayers relocated from this county between 2020 and 2021:
Businesses in Mountain View, CA
Name Count Name Count
24 Hour Fitness 2 Marriott 1 7-Eleven 6 Marshalls 1 AT&T 2 MasterBrand Cabinets 6 BMW 1 McDonald's 3 Baskin-Robbins 2 Nike 1 Bed Bath & Beyond 1 Office Depot 1 Best Western 1 OfficeMax 1 Blockbuster 1 Papa John's Pizza 1 Burger King 2 Payless 1 CVS 4 PetSmart 1 Carl\s Jr. 1 Pizza Hut 1 Chipotle 1 Quality 1 Cold Stone Creamery 1 Quiznos 2 Comfort Inn 1 RadioShack 2 Costco 1 Ramada 1 DHL 1 Rite Aid 2 Dairy Queen 1 Safeway 3 Decora Cabinetry 2 Sears 3 Discount Tire 1 Sprint Nextel 1 Domino's Pizza 1 Starbucks 8 FedEx 19 Subway 7 Firestone Complete Auto Care 1 Super 8 1 GNC 2 T-Mobile 5 GameStop 1 Taco Bell 2 H&R Block 3 Target 1 Hilton 2 Trader Joe's 1 Holiday Inn 2 True Value 2 Homestead Studio Suites 1 U-Haul 2 Jamba Juice 1 UPS 9 Jones New York 1 Verizon Wireless 2 KFC 2 Vons 3 Kohl's 1 Walgreens 2 Lane Furniture 1 Walmart 1 Little Caesars Pizza 1 YMCA 1 Long John Silver's 1
Strongest AM radio stations in Mountain View:
KGO (810 AM; 50 kW; SAN FRANCISCO, CA; Owner: KGO-AM RADIO, INC.)
KNBR (680 AM; 50 kW; SAN FRANCISCO, CA; Owner: KNBR LICO, INC.)
KLOK (1170 AM; 50 kW; SAN JOSE, CA; Owner: ENTRAVISION HOLDINGS, LLC)
KYCY (1550 AM; 50 kW; SAN FRANCISCO, CA; Owner: INFINITY BROADCASTING OPERATIONS, INC.)
KTCT (1050 AM; 50 kW; SAN MATEO, CA; Owner: SUSQUEHANNA RADIO CORP.)
KFAX (1100 AM; 50 kW; SAN FRANCISCO, CA; Owner: GOLDEN GATE BROADCASTING CO, INC.)
KSFB (1220 AM; 5 kW; PALO ALTO, CA; Owner: SCA-PALO ALTO, LLC)
KTRB (860 AM; 50 kW; MODESTO, CA; Owner: PAPPAS RADIO OF CALIFORNIA, A CALIFORNIA LIMITED PARTNERSHIP)
KSJX (1500 AM; 10 kW; SAN JOSE, CA; Owner: MULTICULTURAL RADIO BROADCASTING INC)
KIQI (1010 AM; 35 kW; SAN FRANCISCO, CA; Owner: RADIO UNICA OF SAN FRANCISCO LICENSE CORP.)
KZSF (1370 AM; 5 kW; SAN JOSE, CA; Owner: CARLOS A. DUHARTE)
KCBS (740 AM; 50 kW; SAN FRANCISCO, CA; Owner: INFINITY BROADCASTING OPERATIONS, INC.)
KLIV (1590 AM; 5 kW; SAN JOSE, CA; Owner: EMPIRE BROADCASTING COMPANY)
Strongest FM radio stations in Mountain View:
KFJC (89.7 FM; LOS ALTOS, CA; Owner: FOOTHILL-DE ANZA COMM. COLLEGE DIST.)
KBAA (94.5 FM; GILROY, CA; Owner: INFINITY RADIO OPERATIONS INC.)
KFFG (97.7 FM; LOS ALTOS, CA; Owner: KFFG LICO, INC.)
KSQL (99.1 FM; SANTA CRUZ, CA; Owner: TMS LICENSE CALIFORNIA, INC)
KKUP (91.5 FM; CUPERTINO, CA; Owner: ASSURANCE SCIENCES FOUNDATION)
KBRG (100.3 FM; SAN JOSE, CA; Owner: ENTRAVISION HOLDINGS, LLC)
KZBR-FM2 (95.7 FM; LIVERMORE, ETC., CA; Owner: BONNEVILLE HOLDING COMPANY)
KKSF-FM1 (103.7 FM; PLEASANTON, ETC., CA; Owner: AMFM RADIO LICENSES, L.L.C.)
KFRC-FM3 (99.7 FM; WALNUT CREEK, CA; Owner: INFINITY KFRC-FM, INC.)
KZBR-FM1 (95.7 FM; WALNUT CREEK, CA; Owner: BONNEVILLE HOLDING COMPANY)
KBLX-FM2 (102.9 FM; PLEASANTON, CA; Owner: ICBC BROADCAST HOLDINGS -CA, INC.)
KSOL-FM3 (98.9 FM; PLEASANTON, CA; Owner: TMS LICENSE CALIFORNIA, INC)
KISQ-FM3 (98.1 FM; CONCORD, CA; Owner: AMFM RADIO LICENSES, L.L.C.)
KTEE (93.7 FM; FELTON, CA; Owner: MAPLETON COMMUNICATIONS, L.L.C.)
KUFX (98.5 FM; SAN JOSE, CA; Owner: CITICASTERS LICENSES, L.P.)
KRTY (95.3 FM; LOS GATOS, CA; Owner: KRTY, LTD.)
KMEL-FM1 (106.1 FM; CONCORD, CA; Owner: AMFM RADIO LICENSES, L.L.C.)
K238AC (95.5 FM; SALIDA, CA; Owner: FAMILY STATIONS, INC.)
KSFH (87.9 FM; MOUNTAIN VIEW, CA; Owner: ST. FRANCIS HIGH SCHOOL OF MTN. VIEW)
KOIT-FM (96.5 FM; SAN FRANCISCO, CA; Owner: BONNEVILLE HOLDING COMPANY)
TV broadcast stations around Mountain View:
KQED (Channel 9; SAN FRANCISCO, CA; Owner: KQED, INC.)
KBIT-CA (Channel 28; SAN FRANCISCO, ETC., CA; Owner: POLAR BROADCASTING, INC.)
KICU-TV (Channel 36; SAN JOSE, CA; Owner: KTVU PARTNERSHIP)
KTEH (Channel 54; SAN JOSE, CA; Owner: KTEH FOUNDATION)
KDTV (Channel 14; SAN FRANCISCO, CA; Owner: KDTV LICENSE PARTNERSHIP, G.P.)
KSTS (Channel 48; SAN JOSE, CA; Owner: TELEMUNDO OF NORTHERN CALIFORNIA LICENSE CORP.)
KGO-TV (Channel 7; SAN FRANCISCO, CA; Owner: KGO TELEVISION, INC.)
KPIX-TV (Channel 5; SAN FRANCISCO, CA; Owner: CBS BROADCASTING INC.)
KTVU (Channel 2; OAKLAND, CA; Owner: KTVU PARTNERSHIP)
KRON-TV (Channel 4; SAN FRANCISCO, CA; Owner: YOUNG BROADCASTING OF SAN FRANCISCO, INC.)
KMTP-TV (Channel 32; SAN FRANCISCO, CA; Owner: MINORITY TELEVISION PROJECT)
KBHK-TV (Channel 44; SAN FRANCISCO, CA; Owner: VIACOM TELEVISION STATIONS GROUP OF SAN FRANCISCO INC.)
KBWB (Channel 20; SAN FRANCISCO, CA; Owner: KBWB LICENSE, INC.)
KCSM-TV (Channel 60; SAN MATEO, CA; Owner: SAN MATEO COUNTY COMMUNITY COLLEGE DISTRICT)
KFSF (Channel 66; VALLEJO, CA; Owner: TELEFUTURA SAN FRANCISCO LLC)
KCNS (Channel 38; SAN FRANCISCO, CA; Owner: WRAY, INC.)
KKPX (Channel 65; SAN JOSE, CA; Owner: PAXSON SAN JOSE LICENSE, INC.)
National Bridge Inventory (NBI) Statistics 92 Number of bridges1,135ft / 346m Total length $3,121,000 Total costs4,624,873 Total average daily traffic184,706 Total average daily truck traffic
New bridges - historical statistics
1 1900-1909 2 1920-1929 2 1930-1939 3 1950-1959 41 1960-1969 4 1970-1979 5 1980-1989 12 1990-1999 18 2000-2009 4 2010-2019
See full National Bridge Inventory statistics for Mountain View, CA
Home Mortgage Disclosure Act Aggregated Statistics For Year 2009(Based on 14 full and 6 partial tracts) A) FHA, FSA/RHS & VA B) Conventional C) Refinancings D) Home Improvement Loans E) Loans on Dwellings For 5+ Families F) Non-occupant Loans on G) Loans On Manufactured Number Average Value Number Average Value Number Average Value Number Average Value Number Average Value Number Average Value Number Average Value
LOANS ORIGINATED 44 $509,794 557 $484,125 2,782 $412,058 64 $294,767 15 $2,759,061 141 $321,343 14 $80,879 APPLICATIONS APPROVED, NOT ACCEPTED 0 $0 67 $439,573 331 $423,003 9 $248,288 0 $0 20 $359,472 13 $93,632 APPLICATIONS DENIED 8 $450,241 92 $402,312 481 $473,816 27 $164,904 2 $870,000 59 $358,248 25 $97,048 APPLICATIONS WITHDRAWN 4 $392,725 51 $519,193 366 $443,776 7 $163,071 3 $1,543,333 29 $353,353 0 $0 FILES CLOSED FOR INCOMPLETENESS 1 $344,000 10 $1,163,104 87 $440,937 7 $239,430 0 $0 4 $342,080 1 $158,000
Aggregated Statistics For Year 2008(Based on 14 full and 6 partial tracts) A) FHA, FSA/RHS & VA B) Conventional C) Refinancings D) Home Improvement Loans E) Loans on Dwellings For 5+ Families F) Non-occupant Loans on G) Loans On Manufactured Number Average Value Number Average Value Number Average Value Number Average Value Number Average Value Number Average Value Number Average Value
LOANS ORIGINATED 10 $512,030 589 $496,068 1,050 $440,112 34 $292,552 18 $2,937,354 83 $393,058 25 $95,869 APPLICATIONS APPROVED, NOT ACCEPTED 0 $0 143 $465,355 223 $436,906 13 $188,517 1 $900,000 22 $391,283 36 $107,173 APPLICATIONS DENIED 2 $580,445 139 $482,654 275 $466,545 37 $240,963 2 $687,000 28 $431,930 34 $108,077 APPLICATIONS WITHDRAWN 2 $500,045 97 $499,707 200 $416,637 11 $319,515 2 $1,265,080 17 $364,905 6 $113,335 FILES CLOSED FOR INCOMPLETENESS 2 $531,000 24 $426,944 61 $420,790 6 $208,297 0 $0 11 $338,745 2 $66,000
Aggregated Statistics For Year 2007(Based on 14 full and 6 partial tracts) B) Conventional C) Refinancings D) Home Improvement Loans E) Loans on Dwellings For 5+ Families F) Non-occupant Loans on G) Loans On Manufactured Number Average Value Number Average Value Number Average Value Number Average Value Number Average Value Number Average Value
LOANS ORIGINATED 974 $487,131 1,091 $459,718 77 $409,523 37 $2,092,050 171 $462,694 32 $102,946 APPLICATIONS APPROVED, NOT ACCEPTED 189 $468,114 261 $470,166 27 $331,475 0 $0 35 $457,633 18 $92,736 APPLICATIONS DENIED 188 $466,686 386 $513,272 42 $226,117 2 $749,300 73 $465,235 28 $97,868 APPLICATIONS WITHDRAWN 95 $476,545 135 $455,051 12 $288,182 1 $785,000 19 $377,113 9 $194,333 FILES CLOSED FOR INCOMPLETENESS 20 $537,333 59 $470,805 3 $479,980 0 $0 0 $0 0 $0
Aggregated Statistics For Year 2006(Based on 14 full and 6 partial tracts) B) Conventional C) Refinancings D) Home Improvement Loans E) Loans on Dwellings For 5+ Families F) Non-occupant Loans on G) Loans On Manufactured Number Average Value Number Average Value Number Average Value Number Average Value Number Average Value Number Average Value
LOANS ORIGINATED 1,039 $473,505 1,064 $441,112 125 $339,653 30 $3,345,526 177 $446,580 14 $67,024 APPLICATIONS APPROVED, NOT ACCEPTED 194 $400,871 205 $427,265 25 $303,236 0 $0 26 $446,706 25 $113,081 APPLICATIONS DENIED 200 $422,959 341 $487,620 40 $308,072 0 $0 58 $508,796 25 $84,152 APPLICATIONS WITHDRAWN 97 $468,238 192 $446,954 16 $336,356 3 $548,433 24 $434,656 3 $80,167 FILES CLOSED FOR INCOMPLETENESS 10 $342,085 54 $433,770 7 $342,993 0 $0 4 $459,838 0 $0
Aggregated Statistics For Year 2005(Based on 14 full and 6 partial tracts) A) FHA, FSA/RHS & VA B) Conventional C) Refinancings D) Home Improvement Loans E) Loans on Dwellings For 5+ Families F) Non-occupant Loans on G) Loans On Manufactured Number Average Value Number Average Value Number Average Value Number Average Value Number Average Value Number Average Value Number Average Value
LOANS ORIGINATED 1 $44,000 1,225 $462,243 1,402 $420,341 101 $326,990 46 $2,651,252 216 $372,002 21 $89,143 APPLICATIONS APPROVED, NOT ACCEPTED 0 $0 181 $388,712 208 $383,675 14 $257,114 1 $1,000,000 21 $286,494 25 $95,981 APPLICATIONS DENIED 1 $169,630 241 $374,872 418 $413,072 44 $245,471 3 $1,916,667 54 $486,974 47 $97,120 APPLICATIONS WITHDRAWN 1 $358,000 148 $431,317 322 $380,338 37 $338,603 1 $1,042,000 29 $465,415 9 $161,102 FILES CLOSED FOR INCOMPLETENESS 0 $0 39 $395,625 88 $405,350 5 $340,580 1 $6,675,000 10 $435,604 0 $0
Aggregated Statistics For Year 2004(Based on 14 full and 6 partial tracts) B) Conventional C) Refinancings D) Home Improvement Loans E) Loans on Dwellings For 5+ Families F) Non-occupant Loans on G) Loans On Manufactured Number Average Value Number Average Value Number Average Value Number Average Value Number Average Value Number Average Value
LOANS ORIGINATED 1,279 $417,357 2,331 $382,230 77 $295,722 30 $2,419,622 225 $340,466 27 $86,563 APPLICATIONS APPROVED, NOT ACCEPTED 218 $385,826 401 $363,484 14 $169,744 0 $0 31 $349,937 25 $106,164 APPLICATIONS DENIED 220 $348,102 486 $373,928 44 $249,942 2 $486,205 53 $324,357 35 $100,654 APPLICATIONS WITHDRAWN 139 $410,366 394 $355,576 31 $227,127 2 $730,500 31 $362,051 3 $84,333 FILES CLOSED FOR INCOMPLETENESS 17 $397,139 95 $356,292 3 $120,000 0 $0 9 $311,293 1 $159,850
Aggregated Statistics For Year 2003(Based on 14 full and 6 partial tracts) A) FHA, FSA/RHS & VA B) Conventional C) Refinancings D) Home Improvement Loans E) Loans on Dwellings For 5+ Families F) Non-occupant Loans on Number Average Value Number Average Value Number Average Value Number Average Value Number Average Value Number Average Value
LOANS ORIGINATED 1 $238,000 1,209 $350,811 5,522 $322,470 26 $97,239 43 $1,978,649 457 $269,363 APPLICATIONS APPROVED, NOT ACCEPTED 0 $0 153 $326,234 823 $334,641 11 $47,338 2 $1,025,000 66 $277,610 APPLICATIONS DENIED 0 $0 129 $322,424 690 $341,922 21 $62,873 1 $1,457,960 88 $320,719 APPLICATIONS WITHDRAWN 1 $152,000 121 $382,995 621 $311,862 4 $169,750 1 $1,250,000 40 $262,622 FILES CLOSED FOR INCOMPLETENESS 0 $0 23 $417,382 189 $375,245 1 $90,620 0 $0 12 $348,304
Aggregated Statistics For Year 2002(Based on 10 full and 6 partial tracts) A) FHA, FSA/RHS & VA B) Conventional C) Refinancings D) Home Improvement Loans E) Loans on Dwellings For 5+ Families F) Non-occupant Loans on Number Average Value Number Average Value Number Average Value Number Average Value Number Average Value Number Average Value
LOANS ORIGINATED 2 $136,335 753 $365,571 3,448 $346,509 19 $116,018 25 $1,373,969 223 $284,982 APPLICATIONS APPROVED, NOT ACCEPTED 1 $240,000 98 $319,036 469 $357,015 12 $85,884 1 $529,000 25 $343,761 APPLICATIONS DENIED 0 $0 73 $303,388 317 $364,653 17 $64,005 1 $789,320 23 $312,713 APPLICATIONS WITHDRAWN 3 $242,667 76 $370,683 341 $335,874 7 $64,669 2 $1,610,000 22 $284,500 FILES CLOSED FOR INCOMPLETENESS 1 $99,000 34 $400,359 118 $351,014 2 $78,665 2 $2,376,140 14 $295,891
Aggregated Statistics For Year 2001(Based on 10 full and 6 partial tracts) B) Conventional C) Refinancings D) Home Improvement Loans E) Loans on Dwellings For 5+ Families F) Non-occupant Loans on Number Average Value Number Average Value Number Average Value Number Average Value Number Average Value
LOANS ORIGINATED 634 $352,868 1,912 $347,489 84 $92,306 23 $1,822,480 158 $289,110 APPLICATIONS APPROVED, NOT ACCEPTED 137 $311,049 257 $335,529 13 $97,938 2 $1,331,390 19 $313,298 APPLICATIONS DENIED 98 $246,524 326 $332,989 18 $80,680 5 $7,101,260 26 $398,264 APPLICATIONS WITHDRAWN 66 $363,787 256 $300,014 15 $73,972 4 $3,217,830 23 $295,470 FILES CLOSED FOR INCOMPLETENESS 22 $434,953 94 $348,806 3 $32,257 8 $2,698,384 12 $274,978
Aggregated Statistics For Year 2000(Based on 10 full and 6 partial tracts) A) FHA, FSA/RHS & VA B) Conventional C) Refinancings D) Home Improvement Loans E) Loans on Dwellings For 5+ Families F) Non-occupant Loans on Number Average Value Number Average Value Number Average Value Number Average Value Number Average Value Number Average Value
LOANS ORIGINATED 1 $220,000 680 $366,462 430 $289,093 93 $64,430 16 $2,303,553 111 $345,765 APPLICATIONS APPROVED, NOT ACCEPTED 0 $0 109 $288,511 74 $252,451 25 $77,776 0 $0 11 $259,189 APPLICATIONS DENIED 1 $120,000 118 $265,917 121 $271,324 18 $72,053 4 $1,899,692 14 $313,189 APPLICATIONS WITHDRAWN 1 $169,000 71 $336,599 95 $214,193 13 $89,325 1 $1,548,820 10 $294,994 FILES CLOSED FOR INCOMPLETENESS 0 $0 25 $423,902 36 $273,813 4 $32,000 4 $5,425,000 3 $299,230
Aggregated Statistics For Year 1999(Based on 10 full and 10 partial tracts) A) FHA, FSA/RHS & VA B) Conventional C) Refinancings D) Home Improvement Loans E) Loans on Dwellings For 5+ Families F) Non-occupant Loans on Number Average Value Number Average Value Number Average Value Number Average Value Number Average Value Number Average Value
LOANS ORIGINATED 4 $126,585 1,445 $272,788 1,381 $252,721 106 $64,146 28 $2,691,466 190 $211,790 APPLICATIONS APPROVED, NOT ACCEPTED 0 $0 210 $267,388 283 $233,672 21 $42,551 4 $577,200 27 $227,055 APPLICATIONS DENIED 0 $0 180 $241,175 245 $210,952 23 $72,022 2 $4,019,400 39 $210,505 APPLICATIONS WITHDRAWN 1 $156,000 131 $276,798 205 $221,929 6 $78,072 1 $700,000 27 $209,626 FILES CLOSED FOR INCOMPLETENESS 0 $0 69 $284,648 77 $229,504 2 $45,610 4 $2,630,340 10 $199,455
Detailed mortgage data for all 20 tracts in Mountain View, CA
Private Mortgage Insurance Companies Aggregated Statistics For Year 2009(Based on 9 full and 3 partial tracts) A) Conventional B) Refinancings Number Average Value Number Average Value
LOANS ORIGINATED 18 $406,744 6 $445,307 APPLICATIONS APPROVED, NOT ACCEPTED 4 $347,562 2 $517,500 APPLICATIONS DENIED 4 $402,060 5 $380,246 APPLICATIONS WITHDRAWN 0 $0 1 $372,000 FILES CLOSED FOR INCOMPLETENESS 2 $403,500 1 $231,900
Aggregated Statistics For Year 2008(Based on 10 full and 4 partial tracts) A) Conventional B) Refinancings C) Non-occupant Loans on Number Average Value Number Average Value Number Average Value
LOANS ORIGINATED 40 $486,715 8 $395,378 1 $378,000 APPLICATIONS APPROVED, NOT ACCEPTED 9 $478,216 3 $518,887 0 $0 APPLICATIONS DENIED 7 $505,180 1 $332,000 0 $0 APPLICATIONS WITHDRAWN 1 $395,130 1 $686,490 0 $0 FILES CLOSED FOR INCOMPLETENESS 1 $397,000 0 $0 0 $0
Aggregated Statistics For Year 2007(Based on 10 full and 4 partial tracts) A) Conventional B) Refinancings C) Non-occupant Loans on Number Average Value Number Average Value Number Average Value
LOANS ORIGINATED 18 $474,733 5 $520,704 0 $0 APPLICATIONS APPROVED, NOT ACCEPTED 6 $516,568 2 $597,770 1 $405,000 APPLICATIONS DENIED 0 $0 4 $620,935 1 $689,580 APPLICATIONS WITHDRAWN 1 $748,210 1 $689,000 0 $0 FILES CLOSED FOR INCOMPLETENESS 0 $0 0 $0 0 $0
Aggregated Statistics For Year 2006(Based on 7 full and 1 partial tracts) A) Conventional B) Refinancings Number Average Value Number Average Value
LOANS ORIGINATED 7 $565,726 2 $481,625 APPLICATIONS APPROVED, NOT ACCEPTED 4 $577,000 1 $704,650 APPLICATIONS DENIED 0 $0 0 $0 APPLICATIONS WITHDRAWN 1 $675,000 1 $577,730 FILES CLOSED FOR INCOMPLETENESS 0 $0 0 $0
Aggregated Statistics For Year 2005(Based on 8 full and 2 partial tracts) A) Conventional B) Refinancings Number Average Value Number Average Value
LOANS ORIGINATED 5 $415,064 4 $244,412 APPLICATIONS APPROVED, NOT ACCEPTED 2 $288,415 2 $390,500 APPLICATIONS DENIED 0 $0 0 $0 APPLICATIONS WITHDRAWN 1 $236,830 1 $251,000 FILES CLOSED FOR INCOMPLETENESS 0 $0 0 $0
Aggregated Statistics For Year 2004(Based on 10 full and 2 partial tracts) A) Conventional B) Refinancings C) Non-occupant Loans on Number Average Value Number Average Value Number Average Value
LOANS ORIGINATED 6 $367,817 11 $351,355 1 $360,000 APPLICATIONS APPROVED, NOT ACCEPTED 5 $376,000 7 $370,567 0 $0 APPLICATIONS DENIED 0 $0 0 $0 0 $0 APPLICATIONS WITHDRAWN 2 $349,450 3 $214,870 0 $0 FILES CLOSED FOR INCOMPLETENESS 0 $0 1 $600,000 0 $0
Aggregated Statistics For Year 2003(Based on 13 full and 2 partial tracts) A) Conventional B) Refinancings C) Non-occupant Loans on Number Average Value Number Average Value Number Average Value
LOANS ORIGINATED 27 $301,315 25 $336,570 1 $268,410 APPLICATIONS APPROVED, NOT ACCEPTED 7 $288,429 18 $325,990 0 $0 APPLICATIONS DENIED 1 $279,000 0 $0 0 $0 APPLICATIONS WITHDRAWN 1 $204,000 2 $404,895 0 $0 FILES CLOSED FOR INCOMPLETENESS 0 $0 0 $0 0 $0
Aggregated Statistics For Year 2002(Based on 8 full and 3 partial tracts) A) Conventional B) Refinancings C) Non-occupant Loans on Number Average Value Number Average Value Number Average Value
LOANS ORIGINATED 18 $312,764 7 $274,171 0 $0 APPLICATIONS APPROVED, NOT ACCEPTED 5 $316,036 5 $391,100 0 $0 APPLICATIONS DENIED 0 $0 0 $0 0 $0 APPLICATIONS WITHDRAWN 1 $636,000 3 $325,457 1 $296,370 FILES CLOSED FOR INCOMPLETENESS 0 $0 0 $0 0 $0
Aggregated Statistics For Year 2001(Based on 6 full and 3 partial tracts) A) Conventional B) Refinancings Number Average Value Number Average Value
LOANS ORIGINATED 18 $311,271 2 $399,145 APPLICATIONS APPROVED, NOT ACCEPTED 4 $293,405 2 $382,030 APPLICATIONS DENIED 1 $204,000 2 $218,500 APPLICATIONS WITHDRAWN 0 $0 1 $275,000 FILES CLOSED FOR INCOMPLETENESS 1 $151,000 0 $0
Aggregated Statistics For Year 2000(Based on 8 full and 4 partial tracts) A) Conventional B) Refinancings C) Non-occupant Loans on Number Average Value Number Average Value Number Average Value
LOANS ORIGINATED 19 $292,742 9 $322,786 1 $98,000 APPLICATIONS APPROVED, NOT ACCEPTED 4 $324,468 3 $356,000 0 $0 APPLICATIONS DENIED 0 $0 0 $0 0 $0 APPLICATIONS WITHDRAWN 0 $0 0 $0 0 $0 FILES CLOSED FOR INCOMPLETENESS 0 $0 0 $0 0 $0
Aggregated Statistics For Year 1999(Based on 9 full and 7 partial tracts) A) Conventional B) Refinancings C) Non-occupant Loans on Number Average Value Number Average Value Number Average Value
LOANS ORIGINATED 110 $247,183 11 $231,255 2 $151,440 APPLICATIONS APPROVED, NOT ACCEPTED 10 $294,614 10 $199,731 2 $133,885 APPLICATIONS DENIED 0 $0 0 $0 0 $0 APPLICATIONS WITHDRAWN 6 $251,522 1 $333,000 0 $0 FILES CLOSED FOR INCOMPLETENESS 1 $154,200 2 $168,000 0 $0
Fire-safe hotels and motels in Mountain View, California:
Residence Inn Mountain View, 1854 El Camino Real, Mountain View, California 94040 Phone: (650) 940-1300, Fax: (650) 969-4997
Holiday Inn Express, 1561 W El Camino Real, Mountain View, California 94040 Phone: (650) 967-7888, Fax: (650) 967-3579
Holiday Inn Express Hotel & Suites, 93 W El Camino Real, Mountain View, California 94040 Phone: (650) 967-6957, Fax: (650) 967-4834
Ramada, 55 Fairchild Dr, Mountain View, California 94043 Phone: (650) 967-6856, Fax: (650) 964-4542
Extended Stay America - San Jose - Mountain View, 190 E El Camino Real, Mountain View, California 94040 Phone: (650) 962-1500, Fax: (650) 962-1977
The Hotel Aria, 2700 W El Camino Real, Mountain View, California 94040 Phone: (650) 559-9115, Fax: (650) 559-9045
Hotel Avante, 860 E El Camino Real, Mountain View, California 94040 Phone: (800) 538-1600, Fax: (650) 968-7870
Hampton Inn & Suites, 390 Moffett Blvd, Mountain View, California 94043 Phone: (650) 988-0300, Fax: (650) 988-9999
7 other hotels and motels
All 15 fire-safe hotels and motels in Mountain View, California
Most common first names in Mountain View, CA among deceased individuals Name Count Lived (average)
John 320 74.1 years Mary 288 80.7 years William 209 73.9 years Robert 181 70.4 years George 157 75.4 years James 150 72.2 years Charles 136 73.9 years Dorothy 127 78.4 years Frank 117 77.3 years Margaret 117 80.5 years
Most common last names in Mountain View, CA among deceased individuals Last name Count Lived (average)
Smith 89 76.8 years Brown 63 77.0 years Johnson 59 76.6 years Miller 52 78.7 years Williams 45 74.4 years Martin 41 78.5 years Garcia 40 72.7 years Anderson 39 75.6 years Jones 32 73.2 years Nelson 30 78.8 years
Mountain View compared to California state average:
Median household income above state average. Median house value significantly above state average. Unemployed percentage significantly below state average. Black race population percentage significantly below state average. Hispanic race population percentage below state average. Foreign-born population percentage above state average. Number of rooms per house below state average. Percentage of population with a bachelor's degree or higher significantly above state average. Mountain View on our top lists :
#1 on the list of "Top 101 cities with largest percentage of males in industries: information (population 50,000+)"
#1 on the list of "Top 101 cities with largest percentage of females in occupations: computer and mathematical occupations (population 50,000+)"
#1 on the list of "Top 101 cities with largest percentage of females in industries: information (population 50,000+)"
#3 on the list of "Top 101 cities with largest percentage of females in occupations: architecture and engineering occupations (population 50,000+)"
#3 on the list of "Top 101 cities with largest percentage of males in occupations: computer and mathematical occupations (population 50,000+)"
#9 on the list of "Top 101 cities with largest percentage of females in industries: professional, scientific, and technical services (population 50,000+)"
#10 on the list of "Top 101 cities with the most people having Master's or Doctorate degrees (population 50,000+)"
#10 on the list of "Top 100 cities with highest median house value (pop. 50,000+)"
#12 on the list of "Top 101 cities with the largest racial income disparity between any two races with at least 2,000 householders"
#13 on the list of "Top 101 larger cities with the highest increase in household income from 2000 (population 50,000+)"
#14 on the list of "Top 101 cities with the largest humidity differences during a year (population 50,000+)"
#14 on the list of "Top 101 cities with the largest differences between morning and afternoon humidity (population 50,000+)"
#15 on the list of "Top 100 best educated cities (highest percentage of bachelor degree holding residents) (pop. 50,000+)"
#16 on the list of "Top 101 cities with largest percentage of males in occupations: architecture and engineering occupations (population 50,000+)"
#16 on the list of "Top 100 cities with highest median household income (pop. 50,000+)"
#21 on the list of "Top 100 cities with smallest houses (pop. 50,000+)"
#24 on the list of "Top 101 cities with the most people having Doctorate degrees (population 50,000+)"
#25 on the list of "Top 101 cities with largest percentage of males in industries: professional, scientific, and technical services (population 50,000+)"
#30 on the list of "Top 101 cities with the most local government spending on current operations of parks and recreation per resident (population 10,000+)"
#40 on the list of "Top 100 cities with the largest percentage of males (pop. 50,000+)"
#16 (94043) on the list of "Top 101 zip codes with the most Internet business establishments in 2005"
#38 (94043) on the list of "Top 101 zip codes with the most big companies in 2005 (at least 1000 employees)"
#5 on the list of "Top 101 counties with the highest percentage of residents that visited a dentist within the past year"
#9 on the list of "Top 101 counties with the lowest percentage of residents that smoked 100+ cigarettes in their lives"
#16 on the list of "Top 101 counties with the most Other adherents"
#16 on the list of "Top 101 counties with the most Catholic adherents"
#17 on the list of "Top 101 counties with the highest percentage of residents that drank alcohol in the past 30 days"
Top Patent Applicants
Ali Khakifirooz (300)
Neelakantan Sundaresan (156)
Scott Forstall (135)
David A. Fattal (111)
Alexandre M. Bratkovski (101)
John Hayes (99)
Anton G. Clifford (83)
Matthew James Fischer (79)
Marco Fiorentino (74)
Mark Deem (72)
Total of 28251 patent applications in 2008-2024.

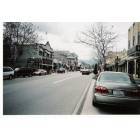

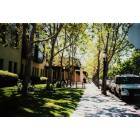
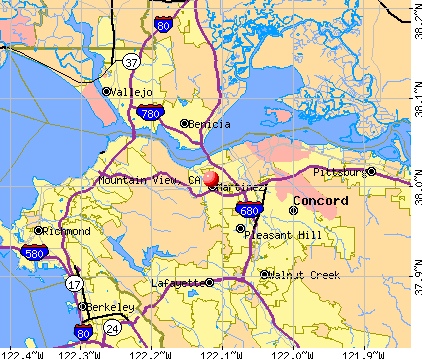


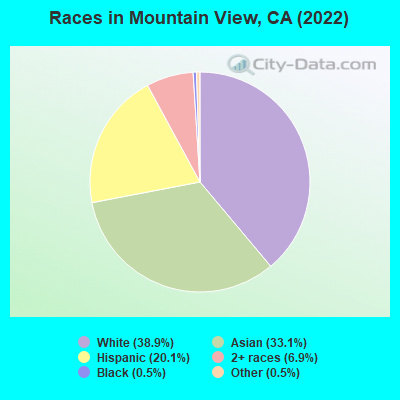
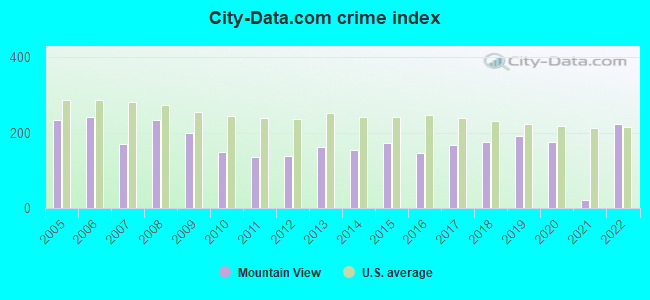
 Recent articles from our blog. Our writers, many of them Ph.D. graduates or candidates, create easy-to-read articles on a wide variety of topics.

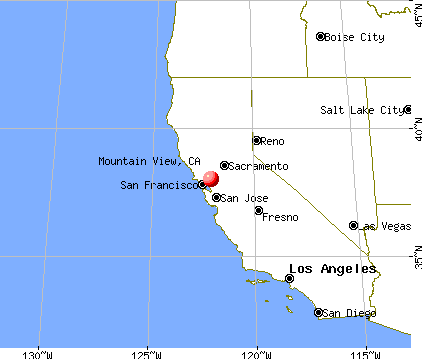
 (11.7 miles
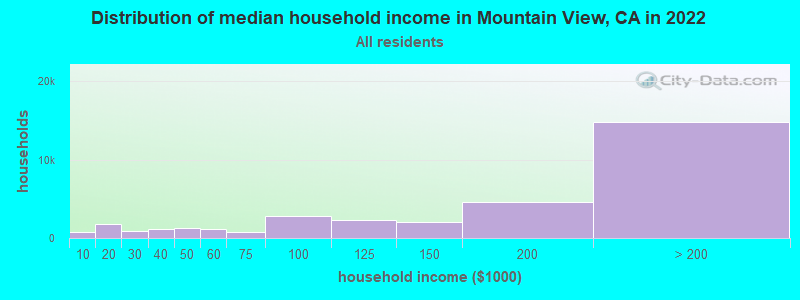
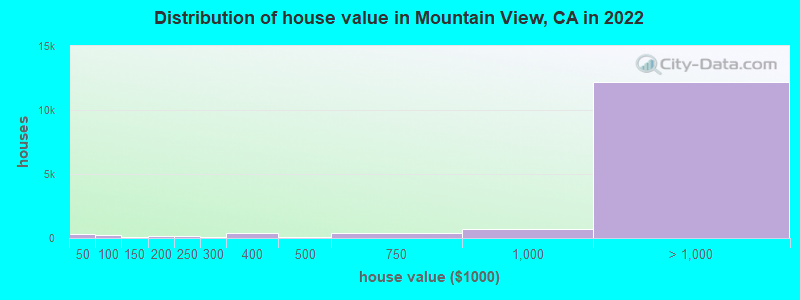
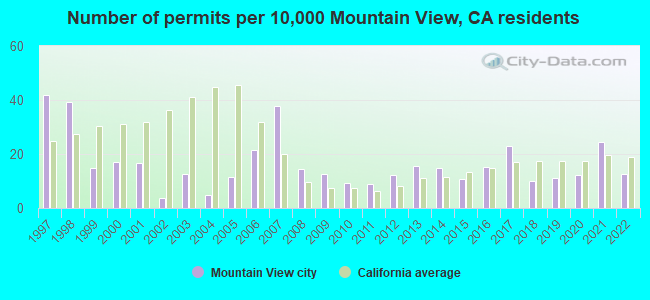
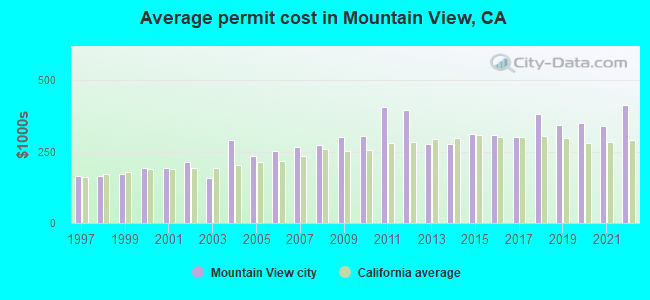
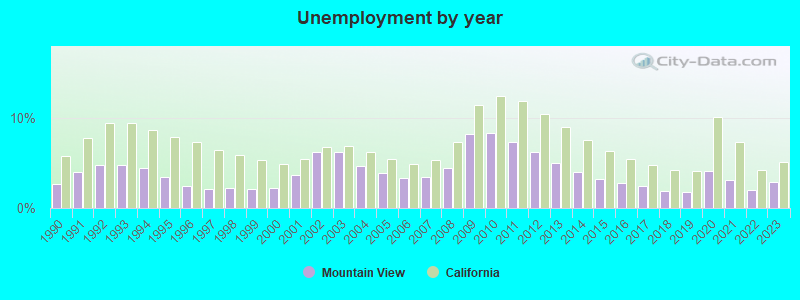
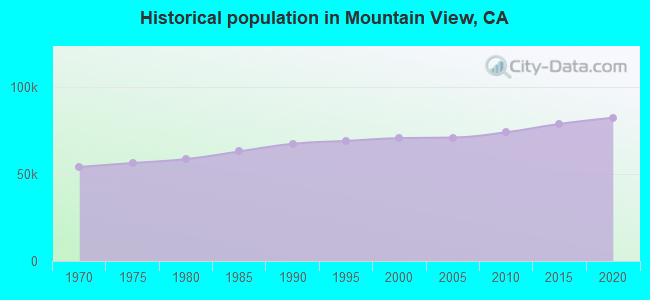
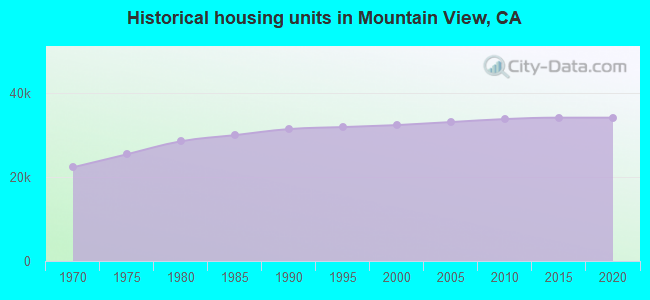
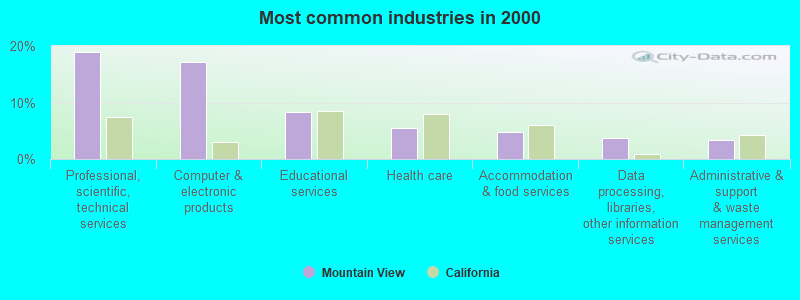
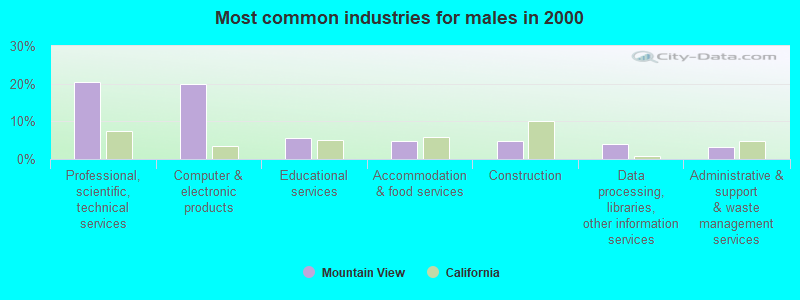
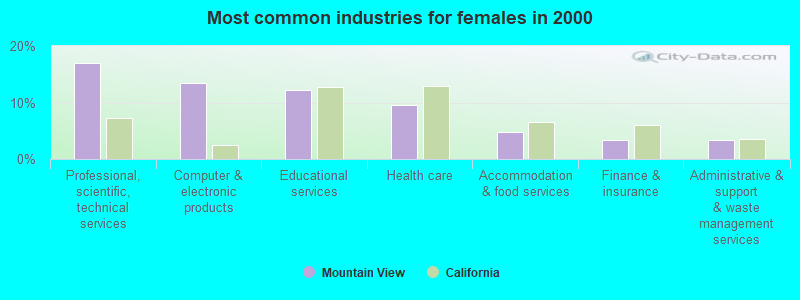
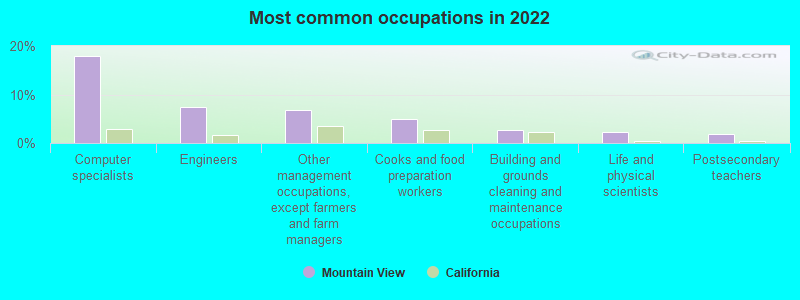
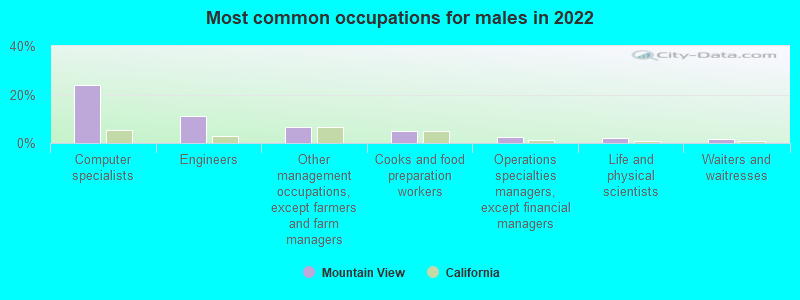
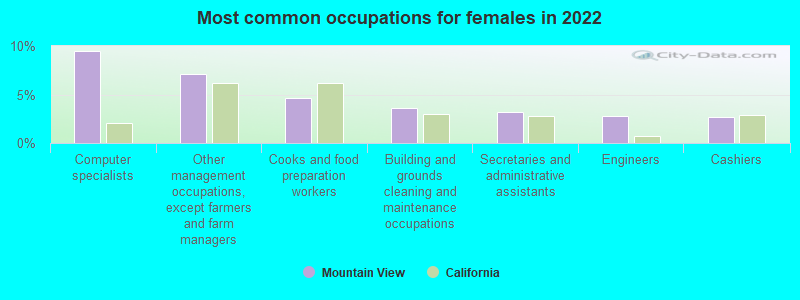

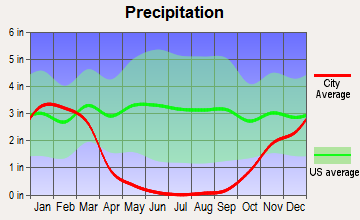
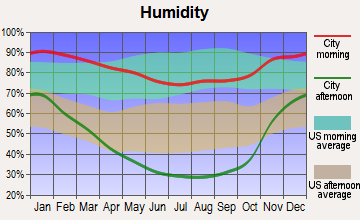
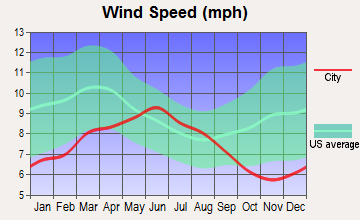
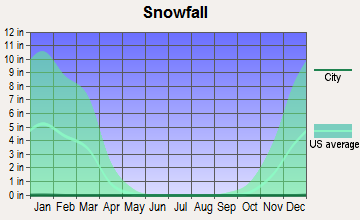
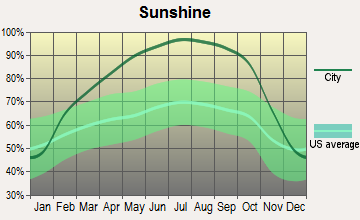
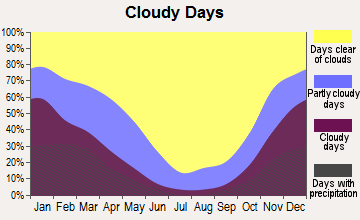
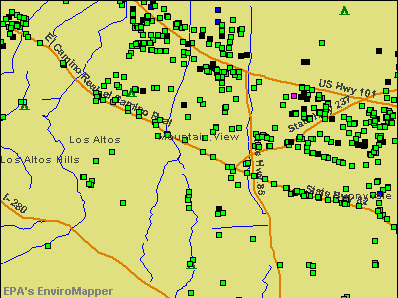

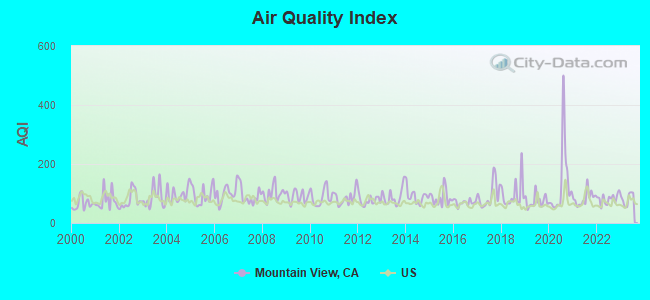
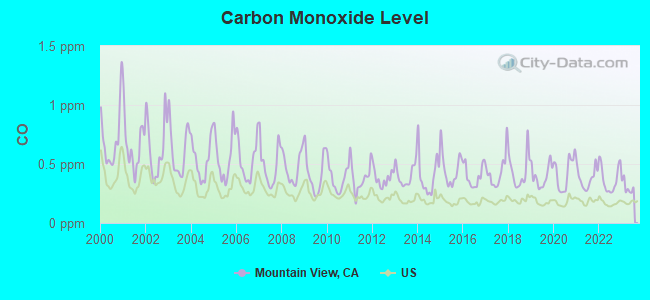
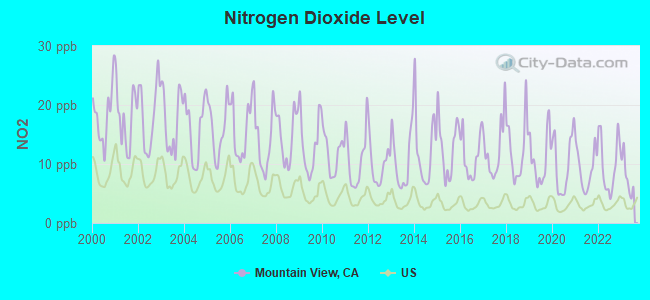
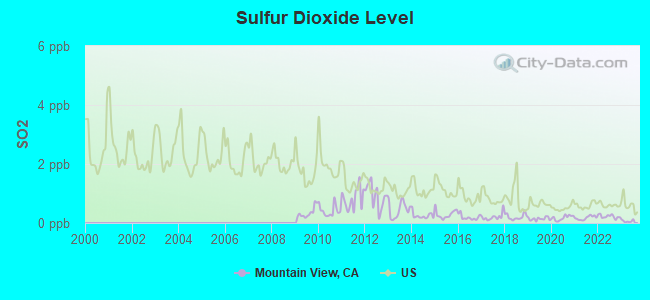
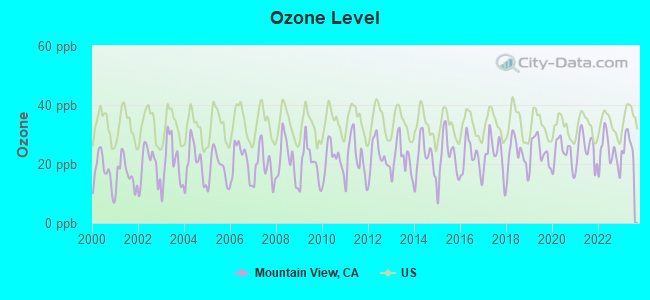
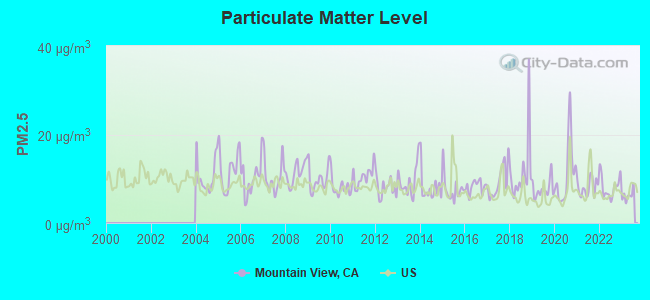
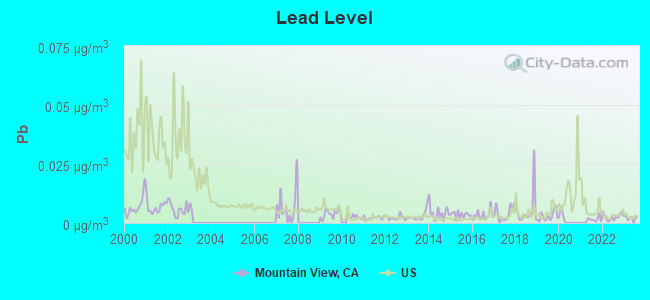
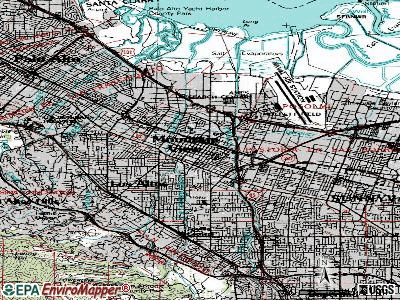
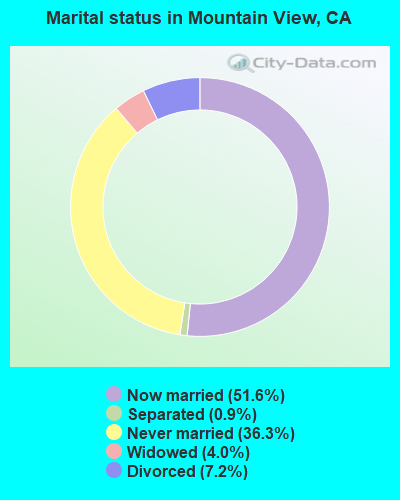
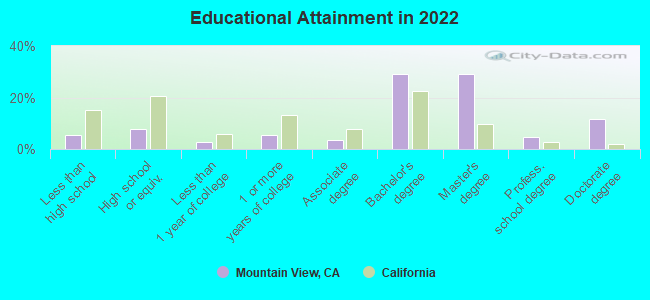
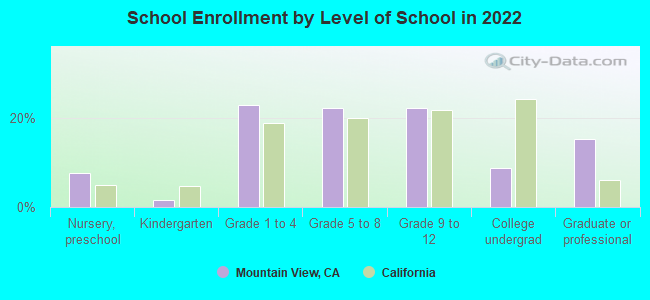
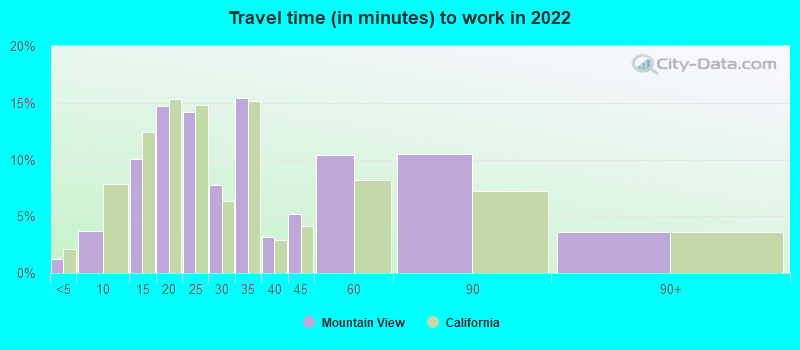
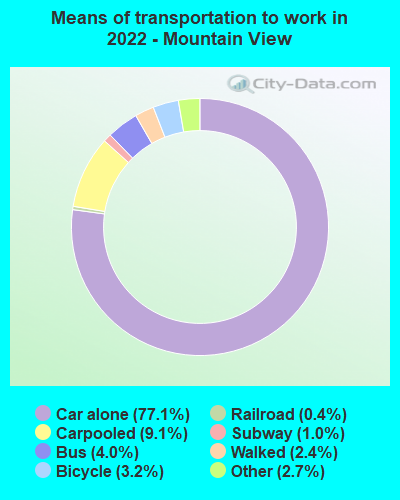
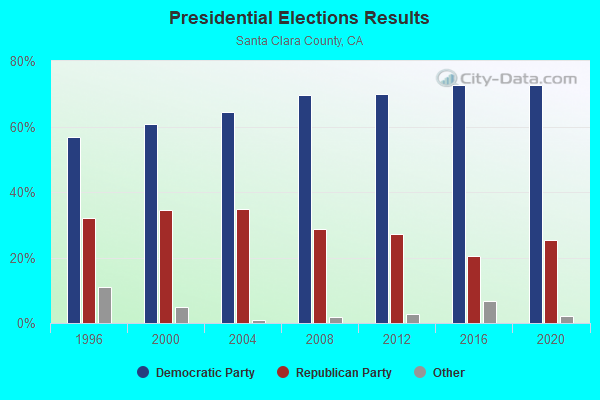
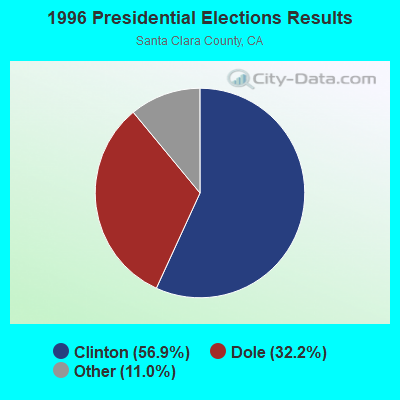
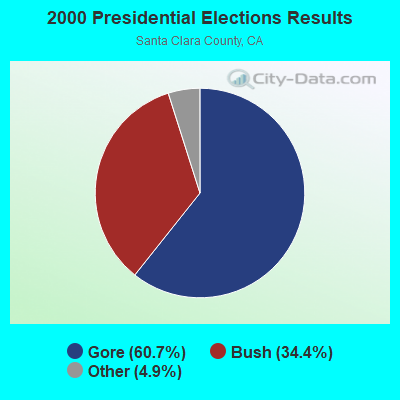

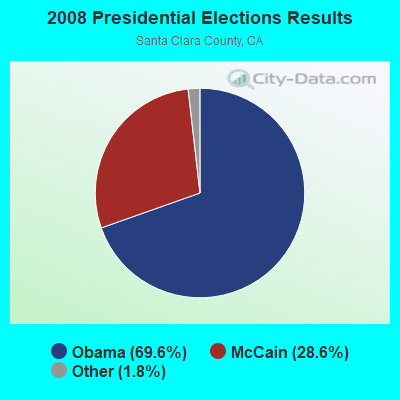
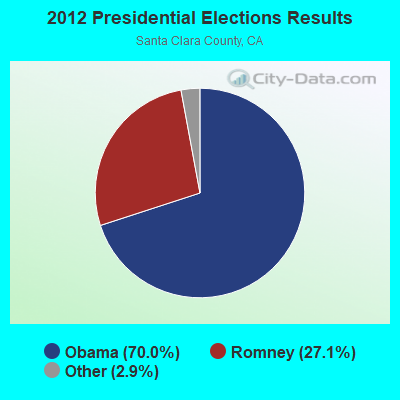
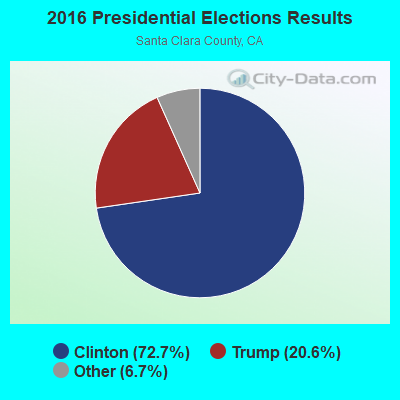
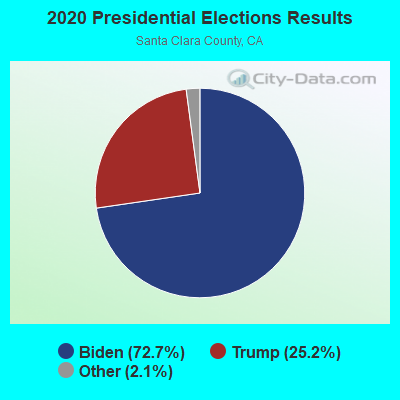
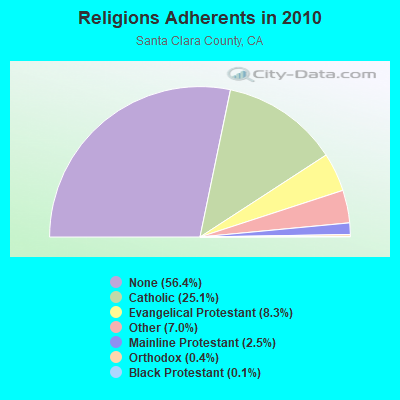
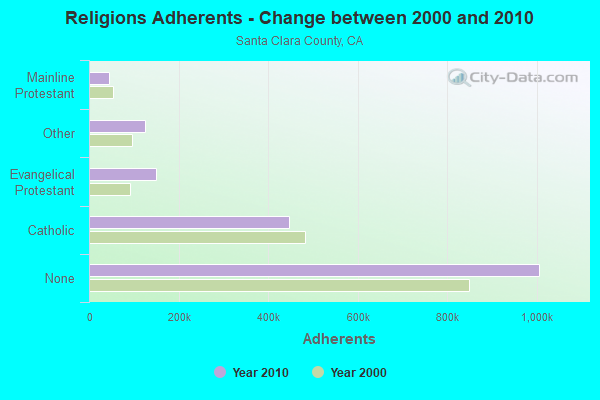
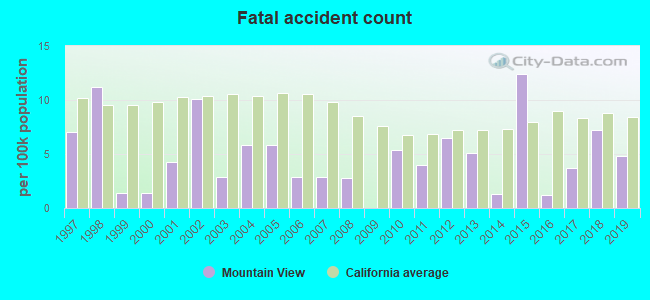
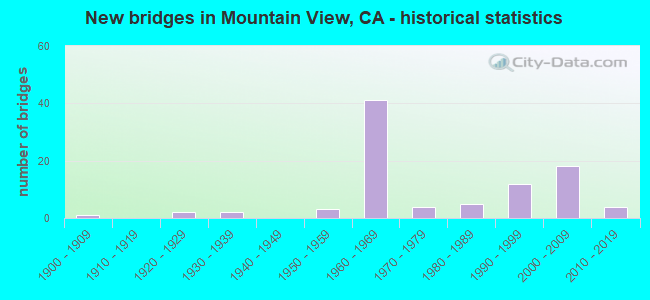
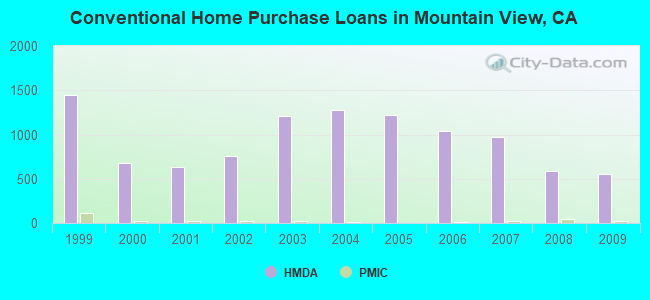
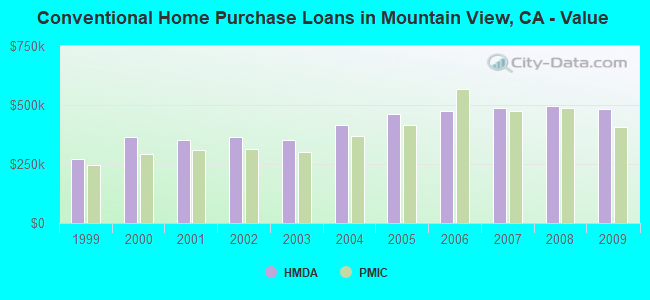
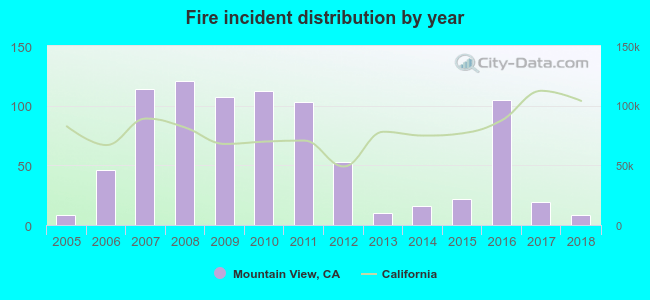 According to the data from the years 2005 - 2018 the average number of fires per year is 60. The highest number of reported fire incidents - 121 took place in 2008, and the least - 8 in 2005. The data has a constant trend.
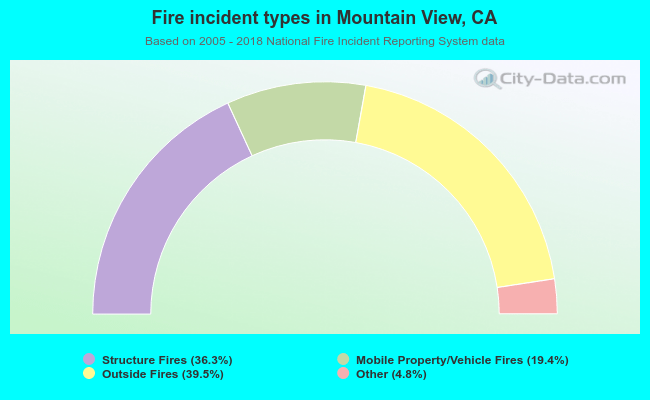 When looking into fire subcategories, the most incidents belonged to: Outside Fires (39.5%), and Structure Fires (36.3%).