Estimated zip code population in 2022: 17,115 Zip code population in 2010: 16,995 Zip code population in 2000: 16,186
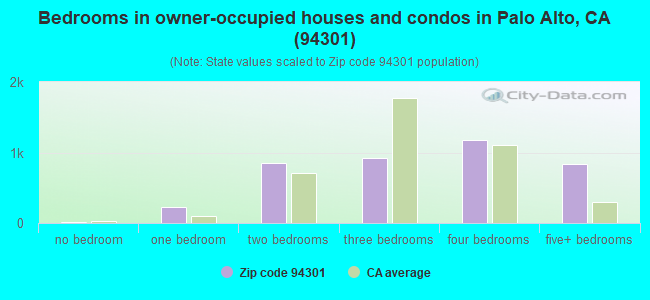
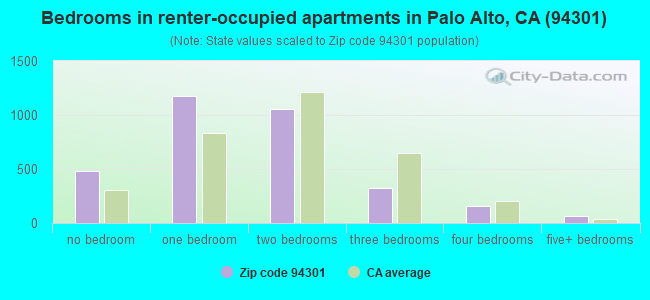
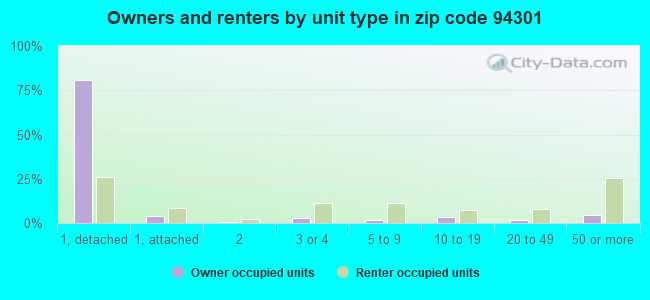
Houses and condos: 8,355 Renter-occupied apartments: 3,242
% of renters here:
45%
State:
44%
March 2022 cost of living index in zip code 94301: 125.2 (high, U.S. average is 100)
Land area: 2.4 sq. mi. Water area: 0.0 sq. mi.
Population density: 7,214 people per square mile
(high).
OSM Map
General Map
Google Map
MSN Map
OSM Map
General Map
Google Map
MSN Map
OSM Map
General Map
Google Map
MSN Map
OSM Map
General Map
Google Map
MSN Map
Please wait while loading the map...
Real estate property taxes paid for housing units in 2022:
This zip code:
0.5% ($10,292)
California:
0.7% ($4,831)
Median real estate property taxes paid for housing units with mortgages in 2022: $10,330 (0.5%) Median real estate property taxes paid for housing units with no mortgage in 2022: $8,955 (0.4%)
Estimated median house/condo value in 2022: $2,171,698
94301:
$2,171,698
California:
$715,900
According to our research of California and other state lists, there were 5 registered sex offenders living in 94301 zip code as of April 27, 2024. The ratio of all residents to sex offenders in zip code 94301 is 3,532 to 1. The ratio of registered sex offenders to all residents in this zip code is much lower than the state average.
Median resident age:
This zip code:
46.6 years
California median age:
37.9 years
Average household size:
This zip code:
2.3 people
California:
2.8 people
Averages for the 2020 tax year for zip code 94301, filed in 2021:
Average Adjusted Gross Income (AGI) in 2020: $1,879,589 (Individual Income Tax Returns)
Here:
$1,879,589
State:
$95,910
Salary/wage: $842,528 (reported on 72.2% of returns)
Here:
$842,528
State:
$77,331
(% of AGI for various income ranges: 1199.2% for AGIs below $25k, 4203.0% for AGIs $25k-50k, 6701.3% for AGIs $50k-75k, 10363.9% for AGIs $75k-100k, 19240.5% for AGIs $100k-200k, 726958.3% for AGIs over 200k)
Taxable interest for individuals: $44,051 (reported on 67.2% of returns)
This zip code:
$44,051
California:
$2,294
(% of AGI for various income ranges: 75.7% for AGIs below $25k, 164.7% for AGIs $25k-50k, 164.1% for AGIs $50k-75k, 241.4% for AGIs $75k-100k, 628.1% for AGIs $100k-200k, 35867.8% for AGIs over 200k)
Ordinary dividends: $120,278 (reported on 66.3% of returns)
Here:
$120,278
State:
$10,949
(% of AGI for various income ranges: 251.5% for AGIs below $25k, 422.1% for AGIs $25k-50k, 622.3% for AGIs $50k-75k, 1335.0% for AGIs $75k-100k, 2631.4% for AGIs $100k-200k, 95317.1% for AGIs over 200k)
Net capital gain/loss in AGI: +$1,622,858 (reported on 64.7% of returns)
Here:
+$1,622,858
State:
+$49,306
(% of AGI for various income ranges: 118.3% for AGIs below $25k, 315.8% for AGIs $25k-50k, 430.0% for AGIs $50k-75k, 867.5% for AGIs $75k-100k, 2280.5% for AGIs $100k-200k, 1305078.2% for AGIs over 200k)
Profit/loss from business: +$66,844 (reported on 20.4% of returns)
Here:
+$66,844
State:
+$15,671
(% of AGI for various income ranges: 208.7% for AGIs below $25k, 431.9% for AGIs $25k-50k, 395.4% for AGIs $50k-75k, 794.6% for AGIs $75k-100k, 1430.2% for AGIs $100k-200k, 14502.0% for AGIs over 200k)
Taxable individual retirement arrangement distribution: $48,834 (reported on 14.2% of returns)
94301:
$48,834
California:
$23,505
(% of AGI for various income ranges: 83.8% for AGIs below $25k, 233.5% for AGIs $25k-50k, 293.1% for AGIs $50k-75k, 787.9% for AGIs $75k-100k, 1916.1% for AGIs $100k-200k, 6006.2% for AGIs over 200k)
Self-employed (Keogh) retirement plans: $46,133 (reported on 5.3% of returns)
94301:
$46,133
California:
$30,163
(% of AGI for various income ranges: 118.1% for AGIs $25k-50k, 158.1% for AGIs $100k-200k, 2818.0% for AGIs over 200k)
Total itemized deductions: $990,159 (reported on 34.1% of returns)
Here:
$990,159
State:
$39,517
(% of AGI for various income ranges: 370.8% for AGIs below $25k, 539.5% for AGIs $25k-50k, 823.1% for AGIs $50k-75k, 1776.1% for AGIs $75k-100k, 2871.1% for AGIs $100k-200k, 415651.8% for AGIs over 200k)
Charity contributions: $1,059,387 (reported on 30.2% of returns)
Here:
$1,059,387
State:
$12,598
(% of AGI for various income ranges: 17.5% for AGIs below $25k, 39.1% for AGIs $25k-50k, 111.5% for AGIs $50k-75k, 308.2% for AGIs $75k-100k, 609.1% for AGIs $100k-200k, 398466.2% for AGIs over 200k)
Taxes paid: $9,756 (reported on 33.7% of returns)
94301:
$9,756
State:
$8,807
(% of AGI for various income ranges: 87.8% for AGIs below $25k, 104.9% for AGIs $25k-50k, 161.5% for AGIs $50k-75k, 353.9% for AGIs $75k-100k, 613.6% for AGIs $100k-200k, 3093.7% for AGIs over 200k)
Earned income credit: $1,357 (reported on 2.8% of returns)
Here:
$1,357
State:
$2,074
(% of AGI for various income ranges: 38.2% for AGIs below $25k, 19.3% for AGIs $25k-50k)
Percentage of individuals using paid preparers for their 2020 taxes: 91.1%
Here:
91%
State:
92%
(% for various income ranges: 86.9% for AGIs below $25k, 88.2% for AGIs $25k-50k, 92.2% for AGIs $50k-75k, 92.7% for AGIs $75k-100k, 91.2% for AGIs $100k-200k, 92.9% for AGIs over 200k)
Averages for the 2012 tax year for zip code 94301, filed in 2013:
Average Adjusted Gross Income (AGI) in 2012: $961,332 (Individual Income Tax Returns)
Here:
$961,332
State:
$72,726
Salary/wage: $351,413 (reported on 74.0% of returns)
Here:
$351,413
State:
$59,079
(% of AGI for various income ranges: 62.3% for AGIs below $25k, 67.3% for AGIs $25k-50k, 64.4% for AGIs $50k-75k, 63.0% for AGIs $75k-100k, 62.8% for AGIs $100k-200k, 25.2% for AGIs over 200k)
Taxable interest for individuals: $14,328 (reported on 67.0% of returns)
This zip code:
$14,328
California:
$2,146
(% of AGI for various income ranges: 3.3% for AGIs below $25k, 2.2% for AGIs $25k-50k, 1.6% for AGIs $50k-75k, 1.5% for AGIs $75k-100k, 1.9% for AGIs $100k-200k, 1.0% for AGIs over 200k)
Ordinary dividends: $47,904 (reported on 61.1% of returns)
Here:
$47,904
State:
$9,308
(% of AGI for various income ranges: 12.5% for AGIs below $25k, 7.0% for AGIs $25k-50k, 6.5% for AGIs $50k-75k, 5.9% for AGIs $75k-100k, 6.6% for AGIs $100k-200k, 2.9% for AGIs over 200k)
Net capital gain/loss in AGI: +$561,738 (reported on 58.1% of returns)
Here:
+$561,738
State:
+$30,460
(% of AGI for various income ranges: 3.3% for AGIs below $25k, 2.6% for AGIs $25k-50k, 2.0% for AGIs $50k-75k, 2.1% for AGIs $75k-100k, 3.8% for AGIs $100k-200k, 35.5% for AGIs over 200k)
Profit/loss from business: +$58,095 (reported on 22.3% of returns)
Here:
+$58,095
State:
+$17,064
(% of AGI for various income ranges: 12.0% for AGIs below $25k, 6.7% for AGIs $25k-50k, 5.6% for AGIs $50k-75k, 5.1% for AGIs $75k-100k, 5.5% for AGIs $100k-200k, 1.1% for AGIs over 200k)
Taxable individual retirement arrangement distribution: $52,883 (reported on 16.3% of returns)
94301:
$52,883
California:
$19,557
(% of AGI for various income ranges: 5.4% for AGIs below $25k, 3.3% for AGIs $25k-50k, 4.6% for AGIs $50k-75k, 4.8% for AGIs $75k-100k, 5.5% for AGIs $100k-200k, 0.7% for AGIs over 200k)
Self-employment retirement plans: $32,812 (reported on 6.0% of returns)
94301:
$32,812
California:
$24,530
(% of AGI for various income ranges: 1.2% for AGIs $50k-75k, 0.8% for AGIs $100k-200k, 0.2% for AGIs over 200k)
Total itemized deductions: $277,483 (18% of AGI, reported on 62.9% of returns)
Here:
$277,483
State:
$34,004
Here:
18.5% of AGI
State:
22.7% of AGI
(% of AGI for various income ranges: 26.3% for AGIs below $25k, 16.2% for AGIs $25k-50k, 17.7% for AGIs $50k-75k, 17.4% for AGIs $75k-100k, 19.4% for AGIs $100k-200k, 18.1% for AGIs over 200k)
Charity contributions: $86,355 (reported on 51.9% of returns)
Here:
$86,355
State:
$4,659
(% of AGI for various income ranges: 1.0% for AGIs below $25k, 1.1% for AGIs $25k-50k, 1.4% for AGIs $50k-75k, 1.7% for AGIs $75k-100k, 2.1% for AGIs $100k-200k, 4.8% for AGIs over 200k)
Taxes paid: $139,983 (reported on 62.7% of returns)
94301:
$139,983
State:
$14,448
(% of AGI for various income ranges: 6.6% for AGIs below $25k, 4.3% for AGIs $25k-50k, 6.5% for AGIs $50k-75k, 7.8% for AGIs $75k-100k, 9.2% for AGIs $100k-200k, 9.2% for AGIs over 200k)
Earned income credit: $1,348 (reported on 3.2% of returns)
Here:
$1,348
State:
$2,286
(% of AGI for various income ranges: 1.8% for AGIs below $25k, 0.2% for AGIs $25k-50k)
Percentage of individuals using paid preparers for their 2012 taxes: 56.7%
Here:
57%
State:
64%
(% for various income ranges: 48.5% for AGIs below $25k, 43.4% for AGIs $25k-50k, 43.9% for AGIs $50k-75k, 53.8% for AGIs $75k-100k, 53.3% for AGIs $100k-200k, 72.9% for AGIs over 200k)
Averages for the 2004 tax year for zip code 94301, filed in 2005:
Average Adjusted Gross Income (AGI) in 2004: $274,614 (Individual Income Tax Returns)
Here:
$274,614
State:
$58,600
Salary/wage: $175,055 (reported on 70.5% of returns)
Here:
$175,055
State:
$49,455
(% of AGI for various income ranges: 60.5% for AGIs $10k-25k, 67.0% for AGIs $25k-50k, 62.8% for AGIs $50k-75k, 65.2% for AGIs $75k-100k, 42.7% for AGIs over 100k)
Taxable interest for individuals: $9,635 (reported on 72.8% of returns)
This zip code:
$9,635
California:
$2,365
(% of AGI for various income ranges: 6.2% for AGIs $10k-25k, 4.0% for AGIs $25k-50k, 2.8% for AGIs $50k-75k, 3.0% for AGIs $75k-100k, 2.4% for AGIs over 100k)
Taxable dividends: $19,724 (reported on 64.4% of returns)
Here:
$19,724
State:
$4,746
(% of AGI for various income ranges: 11.2% for AGIs $10k-25k, 6.0% for AGIs $25k-50k, 5.8% for AGIs $50k-75k, 5.3% for AGIs $75k-100k, 4.4% for AGIs over 100k)
Net capital gain/loss: +$146,208 (reported on 60.2% of returns)
Here:
+$146,208
State:
+$23,418
(% of AGI for various income ranges: 2.8% for AGIs $10k-25k, 3.0% for AGIs $25k-50k, 2.7% for AGIs $50k-75k, 3.8% for AGIs $75k-100k, 34.1% for AGIs over 100k)
Profit/loss from business: +$39,643 (reported on 22.4% of returns)
Here:
+$39,643
State:
+$16,826
(% of AGI for various income ranges: 9.1% for AGIs $10k-25k, 6.4% for AGIs $25k-50k, 6.7% for AGIs $50k-75k, 6.7% for AGIs $75k-100k, 2.9% for AGIs over 100k)
IRA payment deduction: $3,529 (reported on 3.1% of returns)
94301:
$3,529
California:
$3,192
(% of AGI for various income ranges: 0.5% for AGIs $10k-25k, 0.4% for AGIs $25k-50k, 0.2% for AGIs $50k-75k, 0.2% for AGIs $75k-100k, 0.0% for AGIs over 100k)
Self-employed pension: $22,903 (reported on 6.9% of returns)
Here:
$22,903
California:
$17,688
(% of AGI for various income ranges: 0.7% for AGIs $10k-25k, 0.4% for AGIs $25k-50k, 0.8% for AGIs $50k-75k, 0.8% for AGIs $75k-100k, 0.6% for AGIs over 100k)
Total itemized deductions: $78,987 (18% of AGI, reported on 59.4% of returns)
Here:
$78,987
State:
$28,113
Here:
17.9% of AGI
State:
25.3% of AGI
(% of AGI for various income ranges: 42.2% for AGIs $10k-25k, 19.3% for AGIs $25k-50k, 17.1% for AGIs $50k-75k, 21.3% for AGIs $75k-100k, 16.5% for AGIs over 100k)
Charity contributions deductions: $23,995 (5% of AGI, reported on 52.1% of returns)
Here:
$23,995
State:
$3,923
Here:
5.0% of AGI
State:
3.3% of AGI
(% of AGI for various income ranges: 2.2% for AGIs $10k-25k, 1.8% for AGIs $25k-50k, 1.7% for AGIs $50k-75k, 2.3% for AGIs $75k-100k, 4.7% for AGIs over 100k)
Total tax: $67,288 (reported on 86.4% of returns)
94301:
$67,288
State:
$10,761
(% of AGI for various income ranges: 6.0% for AGIs $10k-25k, 9.3% for AGIs $25k-50k, 12.9% for AGIs $50k-75k, 13.3% for AGIs $75k-100k, 21.8% for AGIs over 100k)
Earned income credit: $961 (reported on 2.5% of returns)
Here:
$961
State:
$1,763
Percentage of individuals using paid preparers for their 2004 taxes: 57.6%
Here:
58%
State:
66%
(% for various income ranges: 52.8% for AGIs below $10k, 51.1% for AGIs $10k-25k, 46.8% for AGIs $25k-50k, 52.6% for AGIs $50k-75k, 53.9% for AGIs $75k-100k, 67.0% for AGIs over 100k)
Likely homosexual households (counted as self-reported same-sex unmarried-partner households)
Lesbian couples: 0.0% of all households
Gay men: 0.2% of all households
Household received Food Stamps/SNAP in the past 12 months: 227 Household did not receive Food Stamps/SNAP in the past 12 months: 6,879
Women who had a birth in the past 12 months: 122 (121 now married, 0 unmarried) Women who did not have a birth in the past 12 months: 3,840 (1,788 now married, 2,040 unmarried)
Housing units in zip code 94301 with a mortgage: 2,111 (354 second mortgage, 336 both second mortgage and home equity loan) Houses without a mortgage: 21
Median monthly owner costs for units with a mortgage: $3,876 Median monthly owner costs for units without a mortgage: $1,336
Residents with income below the poverty level in 2022:
This zip code:
4.0%
Whole state:
12.2%
Residents with income below 50% of the poverty level in 2022:
This zip code:
2.1%
Whole state:
6.2%
Median number of rooms in houses and condos:
Here:
7.1
State:
6.0
Median number of rooms in apartments:
Here:
3.4
State:
3.9
Notable locations in this zip code not listed on our city pages
Notable locations in zip code 94301: Palo Alto Office Center (A), Womens Club of Palo Alto (B), Palo Alto Fire Department Station 1 (C), Palo Alto Fire Department Station 3 (D), Palo Alto Railroad Station (E), Palo Alto Downtown Library (F), Palo Alto Club (G), Palo Alto City Hall (H), Palo Alto Childrens Library (I), Museum of American Heritage (J), Lucie Stern Community Center (K), Barbie Hall of Fame (L), Center for Continuing Study of California Economy Library (M), Chinese Community Center (N). Display/hide their locations on the map
Churches in zip code 94301 include: Trinity Lutheran Church (A), Saint Thomas Aquinas Catholic Church (B), Saint Anns Chapel (C), First United Methodist Church (D), First Presbyterian Church (E), First Lutheran Church (F), First Church of Christ Scientist (G), The Church of Jesus Christ of Latter Day Saints (H), First Baptist Church (I). Display/hide their locations on the map
Parks in zip code 94301 include: Rinconada Park (1), Bowden Park (2), Cogswell Plaza (3), Doctor E E Johnson Park (4), Elizabeth Gamble Garden Center (5), Hopkins Park (6), Lytton Plaza (7), Scott Park (8), El Camino Park (9). Display/hide their locations on the map
2,670 married couples with children.
433 single-parent households (182 men, 251 women).
68.9% of residents of 94301 zip code speak English at home.
5.6% of residents speak Spanish at home (53% very well, 26% well, 21% not well).
12.1% of residents speak other Indo-European language at home (87% very well, 7% well, 3% not well, 3% not at all).
12.8% of residents speak Asian or Pacific Island language at home (59% very well, 18% well, 16% not well, 7% not at all).
1.0% of residents speak other language at home (96% very well, 4% not at all).
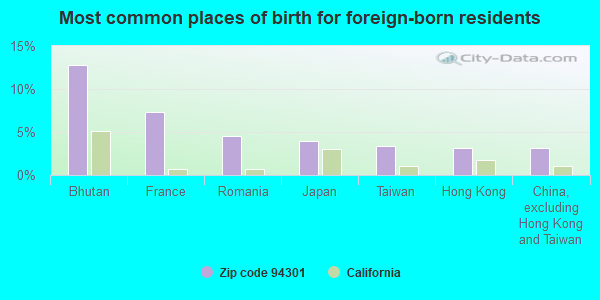
Foreign born population: 5,352 (31.3%) (57.9% of them are naturalized citizens)
STATE MASTER (California - Hazardous Waste Tracking) - HAZARDOU WASTE PROGRAM (Resource Conservation and Recovery Act (tracking hazardous waste)) Organizations: HEWLETT-PACKARD COMPANY (CONTACT/OWNER)
Alternative names: HEWLETT PACKARD LITTON AVE
HEWLETT PACKARD UNIVERSITY AVE (250 UNIVERSITY AVE in PALO ALTO, CA)
STATE MASTER (California - Hazardous Waste Tracking) - HAZARDOU WASTE PROGRAM (Resource Conservation and Recovery Act (tracking hazardous waste)) Organizations: HEWLETT-PACKARD COMPANY (CONTACT/OWNER)
ADDISON ELEMENTARY SCHOOL (650 ADDISON AVE in PALO ALTO, CA)
(Geographic Names Information System) COMPLIANCE ACTIVITY (Tracking inspections of insecticide, fungicide, and rodenticide, and toxic substances) (National Center for Education Statistics) - STATE ID-6048193 Organizations: PALO ALTO UNIFIED (SCHOOL DISTRICT)
HEINICHENS GARAGE (960 HIGH ST in PALO ALTO, CA)
STATE MASTER (California - Hazardous Waste Tracking) - HAZARDOU WASTE PROGRAM Small Quantity Generators, between 100 kg and 1000 kg of hazardous waste/month (Resource Conservation and Recovery Act (tracking hazardous waste)) - notification Business NAICS classification: GENERAL AUTOMOTIVE REPAIR. Organizations: DAVID HEINICHEN (CONTACT/OWNER)
JUNGLECOPY (542 HIGH ST in PALO ALTO, CA)
STATE MASTER (California - Hazardous Waste Tracking) - HAZARDOU WASTE PROGRAM Small Quantity Generators, between 100 kg and 1000 kg of hazardous waste/month (Resource Conservation and Recovery Act (tracking hazardous waste)) - notification
HAYS (WALTER) ELEMENTARY (1525 MIDDLEFIELD ROAD in PALO ALTO, CA)
(National Center for Education Statistics) - STATE ID-6048409 Organizations: PALO ALTO UNIFIED (SCHOOL DISTRICT)
ELLISONS BODY SHOP (705 ALMA STREET in PALO ALTO, CA)
CRITERIA AND HAZARDOUS AIR POLLUTANT INVENTORY (Inventory of air pollution sources) Small Quantity Generators, between 100 kg and 1000 kg of hazardous waste/month (Resource Conservation and Recovery Act (tracking hazardous waste)) - notification Business SIC classification: TOP, BODY, AND UPHOLSTERY REPAIR SHOPS AND PAINT SHOPS Business NAICS classification: AUTOMOTIVE BODY, PAINT, AND INTERIOR REPAIR AND MAINTENANCE. Organizations: EARL ELLISON (CONTACT/OWNER)
FOX PHOTO (140 UNIVERSITY AVE in PALO ALTO, CA)
(Resource Conservation and Recovery Act (tracking hazardous waste)) Organizations: FOX PHOTO INC (CONTACT/OWNER)
MARTHA PAULINE SWAIN TRUSTEE (451 UNIVERSITY AVE in PALO ALTO, CA)
Large Quantity Generators, more that 1000 kg of hazardous waste/month (Resource Conservation and Recovery Act (tracking hazardous waste)) - notification
CARDINAL DRIVE IN CLEANERS (203 FOREST AVENUE in PALO ALTO, CA)
CRITERIA AND HAZARDOUS AIR POLLUTANT INVENTORY (Inventory of air pollution sources) Small Quantity Generators, between 100 kg and 1000 kg of hazardous waste/month (Resource Conservation and Recovery Act (tracking hazardous waste)) - notification Business SIC classification: DRYCLEANING PLANTS, EXCEPT RUG CLEANING Organizations: CARDINAL DRIVE IN CLEANERS INC (CONTACT/OWNER)
Alternative names: CARDINAL CLEANERS INCORPORATED
ABACUS AUTO BODY (1001 EMERSON AVE in PALO ALTO, CA)
Small Quantity Generators, between 100 kg and 1000 kg of hazardous waste/month (Resource Conservation and Recovery Act (tracking hazardous waste)) - notification Organizations: ERIC DIESEL (CONTACT/OWNER)
EMERSON CLEANERS (935 EMERSON STREET in PALO ALTO, CA)
CRITERIA AND HAZARDOUS AIR POLLUTANT INVENTORY (Inventory of air pollution sources) Small Quantity Generators, between 100 kg and 1000 kg of hazardous waste/month (Resource Conservation and Recovery Act (tracking hazardous waste)) - notification Business SIC classification: DRYCLEANING PLANTS, EXCEPT RUG CLEANING Organizations: EMERSON CLEANERS INC (CONTACT/OWNER)
MIKE MUNRO TRUCKING (945 FOREST AVE in PALO ALTO, CA)
TRANSPORTER (Resource Conservation and Recovery Act (tracking hazardous waste)) Organizations: MICHAEL MUNRO (CONTACT/OWNER)
Housing units lacking complete plumbing facilities: 0.7% Housing units lacking complete kitchen facilities: 4.0%
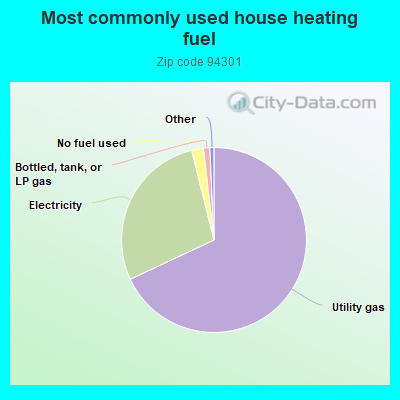
68.1%Utility gas
28.1%Electricity
2.1%No fuel used
1.1%Bottled, tank, or LP gas
Population in 1990: 15,965. Population change in the 1990s: +221 (+1.4%).
Place of birth for U.S.-born residents:
This state: 6,280
Northeast: 1,999
Midwest: 1,487
South: 798
West: 790
58% of the 94301 zip code residents lived in the same house 5 years ago. Out of people who lived in different houses, 40% lived in this county. Out of people who lived in different counties, 50% lived in California.
87% of the 94301 zip code residents lived in the same house 1 year ago. Out of people who lived in different houses, 43% moved from this county. Out of people who lived in different houses, 27% moved from different county within same state. Out of people who lived in different houses, 10% moved from different state. Out of people who lived in different houses, 21% moved from abroad.
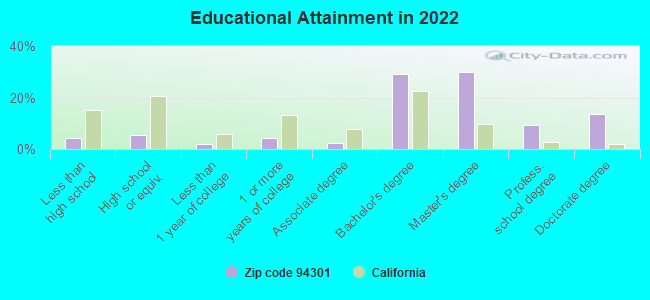
Private vs. public school enrollment:
Students in private schools in grades 1 to 8 (elementary and middle school): 180
Here:
11.9%
California:
10.5%
Students in private schools in grades 9 to 12 (high school): 148
Here:
13.7%
California:
8.5%
Students in private undergraduate colleges: 243
Here:
41.9%
California:
15.9%
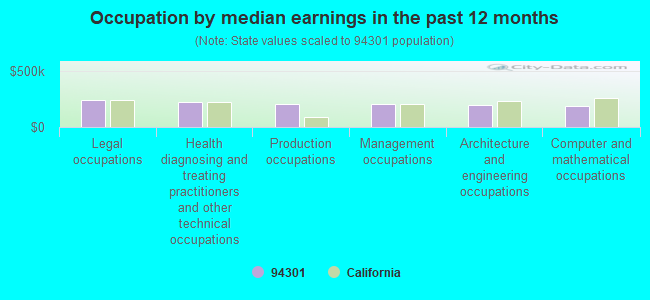
Occupation by median earnings in the past 12 months ($)
237,352Legal occupations
218,081Health diagnosing and treating practitioners and other technical occupations
208,371Production occupations
200,028Management occupations
197,242Architecture and engineering occupations
183,275Computer and mathematical occupations
Companies with biggest federal contracts located in this zip code:
RNET TECHNOLOGIES, INC (555 BRYANT ST, STE 578 in PALO ALTO, CA; small business) : $1,359,988 in 9 contractsfrom 2004 to 2006
Contracts for Defense Aircraft -- Applied Research and Exploratory Development (R&D), Defense Electronics and Communication Equipment -- Management and Support (R&D), Defense Aircraft -- Management and Support (R&D) by Air Force Signed by year:2000: $0; 2001: $0; 2002: $0; 2003: $0; 2004: $199,990; 2005: $604,999; 2006: $554,999.
Biggest contracts:
$375,000 with Air Force for Defense Aircraft -- Applied Research and Exploratory Development (R&D). Signed on 2005-03-03. Completion date: 2007-07-30.
$244,999, same as above.Signed on 2006-04-12. Completion date: 2007-07-30.
$200,000 with Air Force for Defense Electronics and Communication Equipment -- Management and Support (R&D). Signed on 2006-04-25. Completion date: 2008-08-19.
$130,000 with Air Force for Defense Aircraft -- Applied Research and Exploratory Development (R&D). Signed on 2005-09-15. Completion date: 2007-07-30.
ILT CORP (101 ALMA ST APT 703 in PALO ALTO, CA; small business) : $1,290,158 in 9 contractsfrom 2000 to 2005
Contracts for Defense Missile and Space Systems -- Management and Support (R&D), Defense Missile and Space Systems -- Basic Research (R&D), Services -- Basic Research (R&D) by Air Force, Missile Defense Agency, Navy Signed by year:2000: $95,501; 2001: $562,500; 2002: $346,627; 2003: $0; 2004: $161,451; 2005: $124,079; 2006: $0.
Biggest contracts:
$375,000 with Air Force for Defense Missile and Space Systems -- Management and Support (R&D). Signed on 2001-07-02. Completion date: 2003-09-30.
$346,627, same as above.Signed on 2002-02-20. Completion date: 2003-09-30.
$117,500, same as above.Signed on 2001-07-09. Completion date: 2003-09-30.
$99,951 with Missile Defense Agency for Defense Missile and Space Systems -- Basic Research (R&D). Signed on 2004-06-15. Completion date: 2004-12-15.
RATIONAL DISCOVERY LLC (560 FOREST AVE in PALO ALTO, CA; small business) : $849,355 in 3 contractsfrom 2001 to 2003
$375,000 with Air Force for Other Research and Development -- Management and Support (R&D). Signed on 2002-07-24. Completion date: 2004-07-31.
$374,898, same as above.Signed on 2003-04-11. Completion date: 2004-07-30.
$99,457 with Air Force for Other Research and Development -- Basic Research (R&D). Signed on 2001-04-26. Completion date: 2002-02-28.
INSTITUTE FOR THE FUTURE (124 UNIVERSITY AVENUE, 2ND in PALO ALTO, CA) : $440,000 in 5 contractsfrom 2000 to 2004
Contracts for Other Defense -- Advanced Development (R&D), Other Defense -- Applied Research and Exploratory Development (R&D), Lectures For Training, Tuition, Registration, and Membership Fees by Air Force, Defense Advanced Research Projects Agency, Department of Defense Signed by year:2000: $20,000; 2001: $0; 2002: $65,000; 2003: $65,000; 2004: $290,000; 2005: $0; 2006: $0.
Biggest contracts:
$225,000 with Air Force for Other Defense -- Advanced Development (R&D). Signed on 2004-11-10. Completion date: 2005-10-11.
$65,000 with Defense Advanced Research Projects Agency for Other Defense -- Applied Research and Exploratory Development (R&D). Signed on 2004-08-18. Completion date: 2005-08-17.
$65,000 with Department of Defense for Lectures For Training. Signed on 2002-10-04. Completion date: 2003-10-03.
$65,000 with Department of Defense for Tuition, Registration, and Membership Fees. Signed on 2003-08-13. Completion date: 2004-08-12.
Hammer & associates (1143 Bryant Street in Palo Alto, CA) : $290,895 in 4 contractsfrom 2004 to 2005
$130,000 with Offices, Boards and Divisions (includes Attorney General, Deputy Attorney General, etc.) for Expert Witness. Signed on 2004-09-28. Completion date: 2006-09-16.
$60,000, same as above.Signed on 2004-09-16. Completion date: 2008-09-30.
$54,157, same as above.Signed on 2005-05-02. Completion date: 2007-05-01.
$46,738, same as above.Signed on 2005-04-04. Completion date: 2007-04-03.
FASTMARK, INC (125 UNIVERSITY AVE #250 in PALO ALTO, CA; small business) : $52,729 in 2 contractsfrom 2000 to 2003
$44,329 with Army for Books and Pamphlets. Taking place in VA. Signed on 2000-05-19. Completion date: 2000-06-30.
$8,400, same as above.Signed on 2003-05-20. Completion date: 2003-06-22.
LISTA TOOLBOXES (555 BRYANT ST 233 in PALO ALTO, CA; small business) : $39,109 in 3 contractsfrom 2005 to 2006
$17,616 with Army for Cabinets, Lockers, Bins, and Shelving. Signed on 2005-09-06. Completion date: 2005-10-31.
$16,110 with Air Force for Cabinets, Lockers, Bins, and Shelving. Signed on 2005-09-22. Completion date: 2005-10-26.
$5,383, same as above.Signed on 2006-04-06. Completion date: 2006-05-09.
CRYSTAL DECISIONS, INC (FORMER (895 EMERSON STREET in PALO ALTO, CA) : $26,713 in 2 contractsfrom 2002 to 2004
$18,167 with Army for Musical Instruments. Signed on 2002-08-28. Completion date: 2002-09-13.
$8,546 with Army for ADP Software. Signed on 2004-01-27. Completion date: 2005-01-21.
TALL TREE ELECTRONIC SYSTEMS (360 EVERETT AVE APT 3A in PALO ALTO, CA; small business) : $18,165 in 3 contractsin 2005
$8,780 with Navy for Maintenance, Repair and Rebuilding of Equipment -- Communication, Detection, and Coherent Radiation Equipment. Signed on 2005-06-23. Completion date: 2005-10-21.
$4,995, same as above.Signed on 2005-03-08. Completion date: 2005-05-27.
$4,390, same as above.Signed on 2005-09-02. Completion date: 2005-12-23.
PACIFIC IMPERIAL INC (120 HAWTHORNE AVE STE 101 in PALO ALTO, CA) : $17,500 in 7 contractsfrom 2003 to 2006
Contracts for ADP Software, Other ADP and Telecommunications Services (includes data storage on tapes, compact disks, etc.), ADP Components, Maintenance, Repair and Rebuilding of Equipment -- Automatic Data Processing Equipment (Including Firmware), Software, Supplies and Support Equipment by Federal Technology Service, Navy Signed by year:2000: $0; 2001: $0; 2002: $0; 2003: $3,375; 2004: $4,500; 2005: $5,160; 2006: $4,465.
Biggest contracts:
$4,500 with Federal Technology Service for ADP Software. Signed on 2004-09-24. Completion date: 2004-09-24.
$4,465 with Navy for Other ADP and Telecommunications Services (includes data storage on tapes, compact disks, etc.). Signed on 2006-02-07. Completion date: 2006-02-07.
$4,465 with Navy for ADP Components. Signed on 2005-02-15. Completion date: 2006-02-14.
$3,375 with Navy for ADP Software. Signed on 2003-09-16. Completion date: 2003-09-30.
Top industries in this zip code by the number of employees in 2005:
2007 - 2018 National Fire Incident Reporting System (NFIRS) incidents
Based on the data from the years 2007 - 2018 the average number of fire incidents per year is 39. The highest number of fire incidents - 65 took place in 2017, and the least - 10 in 2007. The data has a growing trend.
When looking into fire subcategories, the most incidents belonged to: Structure Fires (41.8%), and Outside Fires (36.6%).
Fire incident types reported to NFIRS in Zip Code 94301

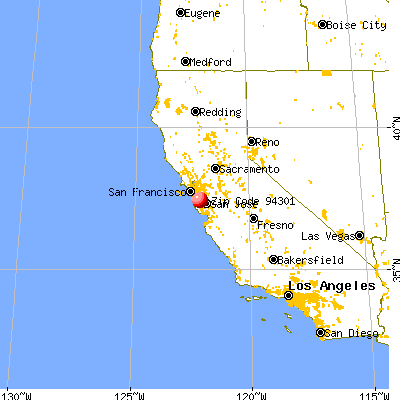


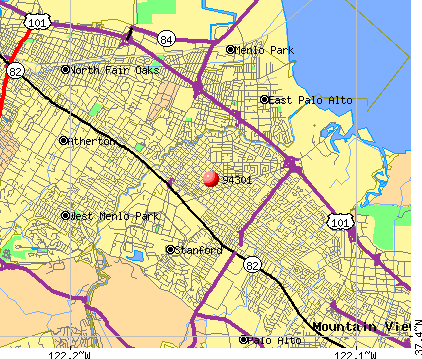 Nearest zip codes: 94025, 94305, 94306, 94303, 94027, 94063.


 Based on the data from the years 2007 - 2018 the average number of fire incidents per year is 39. The highest number of fire incidents - 65 took place in 2017, and the least - 10 in 2007. The data has a growing trend.
 When looking into fire subcategories, the most incidents belonged to: Structure Fires (41.8%), and Outside Fires (36.6%).