Estimated zip code population in 2022: 40,676 Zip code population in 2010: 40,526 Zip code population in 2000: 39,061
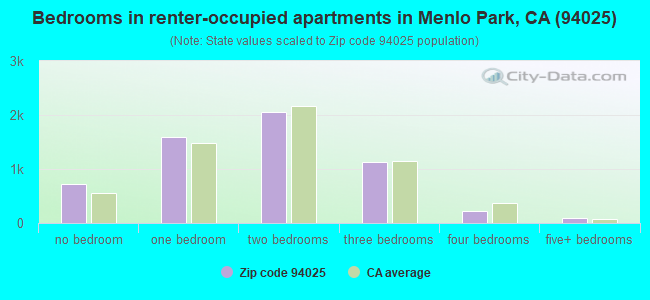
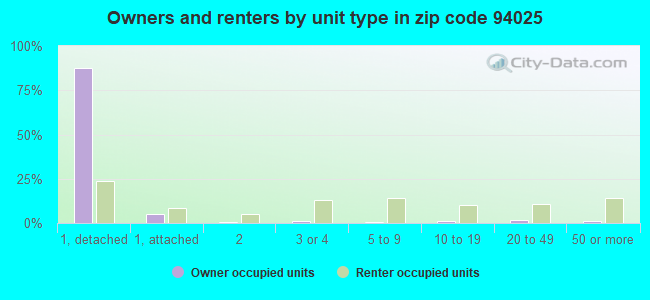
Houses and condos: 16,455 Renter-occupied apartments: 5,799
% of renters here:
40%
State:
44%
March 2022 cost of living index in zip code 94025: 132.8 (high, U.S. average is 100)
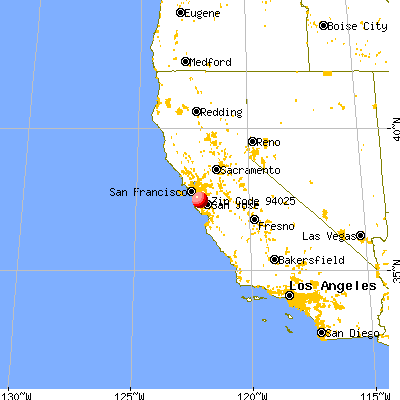
Land area: 11.7 sq. mi. Water area: 0.0 sq. mi.
Population density: 3,462 people per square mile
(average).
OSM Map
General Map
Google Map
MSN Map
OSM Map
General Map
Google Map
MSN Map
OSM Map
General Map
Google Map
MSN Map
OSM Map
General Map
Google Map
MSN Map
Please wait while loading the map...
Real estate property taxes paid for housing units in 2022:
This zip code:
0.5% ($10,292)
California:
0.7% ($4,831)
Median real estate property taxes paid for housing units with mortgages in 2022: $10,330 (0.5%) Median real estate property taxes paid for housing units with no mortgage in 2022: $10,094 (0.5%)
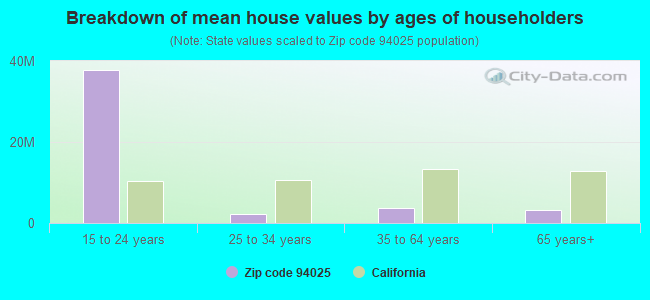
Estimated median house/condo value in 2022: $2,171,698
94025:
$2,171,698
California:
$715,900
According to our research of California and other state lists, there were 20 registered sex offenders living in 94025 zip code as of April 27, 2024. The ratio of all residents to sex offenders in zip code 94025 is 2,104 to 1. The ratio of registered sex offenders to all residents in this zip code is much lower than the state average.
Median resident age:
This zip code:
39.2 years
California median age:
37.9 years
Average household size:
This zip code:
2.7 people
California:
2.8 people
Averages for the 2020 tax year for zip code 94025, filed in 2021:
Average Adjusted Gross Income (AGI) in 2020: $487,202 (Individual Income Tax Returns)
Here:
$487,202
State:
$95,910
Salary/wage: $360,199 (reported on 78.0% of returns)
Here:
$360,199
State:
$77,331
(% of AGI for various income ranges: 1317.5% for AGIs below $25k, 4096.1% for AGIs $25k-50k, 7495.8% for AGIs $50k-75k, 10486.9% for AGIs $75k-100k, 20638.3% for AGIs $100k-200k, 349576.4% for AGIs over 200k)
Taxable interest for individuals: $8,394 (reported on 60.0% of returns)
This zip code:
$8,394
California:
$2,294
(% of AGI for various income ranges: 51.3% for AGIs below $25k, 63.2% for AGIs $25k-50k, 127.3% for AGIs $50k-75k, 161.1% for AGIs $75k-100k, 384.5% for AGIs $100k-200k, 6255.3% for AGIs over 200k)
Ordinary dividends: $32,581 (reported on 54.7% of returns)
Here:
$32,581
State:
$10,949
(% of AGI for various income ranges: 169.8% for AGIs below $25k, 237.1% for AGIs $25k-50k, 477.1% for AGIs $50k-75k, 744.4% for AGIs $75k-100k, 1571.6% for AGIs $100k-200k, 21766.0% for AGIs over 200k)
Net capital gain/loss in AGI: +$229,148 (reported on 53.6% of returns)
Here:
+$229,148
State:
+$49,306
(% of AGI for various income ranges: 83.1% for AGIs below $25k, 208.5% for AGIs $25k-50k, 308.6% for AGIs $50k-75k, 634.8% for AGIs $75k-100k, 1596.0% for AGIs $100k-200k, 168085.1% for AGIs over 200k)
Profit/loss from business: +$56,389 (reported on 20.4% of returns)
Here:
+$56,389
State:
+$15,671
(% of AGI for various income ranges: 282.6% for AGIs below $25k, 344.7% for AGIs $25k-50k, 449.5% for AGIs $50k-75k, 600.4% for AGIs $75k-100k, 1200.1% for AGIs $100k-200k, 13289.4% for AGIs over 200k)
Taxable individual retirement arrangement distribution: $36,533 (reported on 10.6% of returns)
94025:
$36,533
California:
$23,505
(% of AGI for various income ranges: 67.7% for AGIs below $25k, 156.7% for AGIs $25k-50k, 348.1% for AGIs $50k-75k, 575.6% for AGIs $75k-100k, 1217.6% for AGIs $100k-200k, 3176.5% for AGIs over 200k)
Self-employed (Keogh) retirement plans: $42,020 (reported on 4.7% of returns)
94025:
$42,020
California:
$30,163
(% of AGI for various income ranges: 55.7% for AGIs $50k-75k, 195.8% for AGIs $100k-200k, 2487.8% for AGIs over 200k)
Total itemized deductions: $87,027 (reported on 32.3% of returns)
Here:
$87,027
State:
$39,517
(% of AGI for various income ranges: 330.0% for AGIs below $25k, 468.4% for AGIs $25k-50k, 803.9% for AGIs $50k-75k, 1176.9% for AGIs $75k-100k, 2491.8% for AGIs $100k-200k, 34154.8% for AGIs over 200k)
Charity contributions: $56,447 (reported on 27.7% of returns)
Here:
$56,447
State:
$12,598
(% of AGI for various income ranges: 11.7% for AGIs below $25k, 30.5% for AGIs $25k-50k, 79.9% for AGIs $50k-75k, 137.0% for AGIs $75k-100k, 415.1% for AGIs $100k-200k, 21075.5% for AGIs over 200k)
Taxes paid: $9,403 (reported on 32.3% of returns)
94025:
$9,403
State:
$8,807
(% of AGI for various income ranges: 76.0% for AGIs below $25k, 102.3% for AGIs $25k-50k, 178.8% for AGIs $50k-75k, 311.4% for AGIs $75k-100k, 616.9% for AGIs $100k-200k, 3021.9% for AGIs over 200k)
Earned income credit: $1,700 (reported on 3.9% of returns)
Here:
$1,700
State:
$2,074
(% of AGI for various income ranges: 51.3% for AGIs below $25k, 32.4% for AGIs $25k-50k)
Percentage of individuals using paid preparers for their 2020 taxes: 92.3%
Here:
92%
State:
92%
(% for various income ranges: 88.7% for AGIs below $25k, 91.1% for AGIs $25k-50k, 91.8% for AGIs $50k-75k, 91.5% for AGIs $75k-100k, 92.4% for AGIs $100k-200k, 94.7% for AGIs over 200k)
Averages for the 2012 tax year for zip code 94025, filed in 2013:
Average Adjusted Gross Income (AGI) in 2012: $332,152 (Individual Income Tax Returns)
Here:
$332,152
State:
$72,726
Salary/wage: $261,538 (reported on 78.5% of returns)
Here:
$261,538
State:
$59,079
(% of AGI for various income ranges: 66.7% for AGIs below $25k, 73.4% for AGIs $25k-50k, 70.9% for AGIs $50k-75k, 66.7% for AGIs $75k-100k, 70.0% for AGIs $100k-200k, 60.5% for AGIs over 200k)
Taxable interest for individuals: $6,043 (reported on 59.3% of returns)
This zip code:
$6,043
California:
$2,146
(% of AGI for various income ranges: 2.5% for AGIs below $25k, 1.4% for AGIs $25k-50k, 1.3% for AGIs $50k-75k, 1.3% for AGIs $75k-100k, 1.1% for AGIs $100k-200k, 1.0% for AGIs over 200k)
Ordinary dividends: $24,134 (reported on 49.3% of returns)
Here:
$24,134
State:
$9,308
(% of AGI for various income ranges: 7.5% for AGIs below $25k, 3.6% for AGIs $25k-50k, 4.2% for AGIs $50k-75k, 4.7% for AGIs $75k-100k, 4.2% for AGIs $100k-200k, 3.4% for AGIs over 200k)
Net capital gain/loss in AGI: +$139,793 (reported on 46.4% of returns)
Here:
+$139,793
State:
+$30,460
(% of AGI for various income ranges: 0.4% for AGIs below $25k, 1.1% for AGIs $25k-50k, 1.4% for AGIs $50k-75k, 1.6% for AGIs $75k-100k, 2.6% for AGIs $100k-200k, 22.5% for AGIs over 200k)
Profit/loss from business: +$60,215 (reported on 21.7% of returns)
Here:
+$60,215
State:
+$17,064
(% of AGI for various income ranges: 13.5% for AGIs below $25k, 8.1% for AGIs $25k-50k, 7.1% for AGIs $50k-75k, 6.1% for AGIs $75k-100k, 6.5% for AGIs $100k-200k, 3.4% for AGIs over 200k)
Taxable individual retirement arrangement distribution: $33,556 (reported on 13.3% of returns)
94025:
$33,556
California:
$19,557
(% of AGI for various income ranges: 3.8% for AGIs below $25k, 2.6% for AGIs $25k-50k, 3.7% for AGIs $50k-75k, 5.0% for AGIs $75k-100k, 4.1% for AGIs $100k-200k, 0.9% for AGIs over 200k)
Self-employment retirement plans: $33,632 (reported on 5.4% of returns)
94025:
$33,632
California:
$24,530
(% of AGI for various income ranges: 0.5% for AGIs $25k-50k, 0.4% for AGIs $50k-75k, 0.6% for AGIs $75k-100k, 0.7% for AGIs $100k-200k, 0.5% for AGIs over 200k)
Total itemized deductions: $92,323 (17% of AGI, reported on 56.4% of returns)
Here:
$92,323
State:
$34,004
Here:
16.5% of AGI
State:
22.7% of AGI
(% of AGI for various income ranges: 23.4% for AGIs below $25k, 15.5% for AGIs $25k-50k, 15.8% for AGIs $50k-75k, 18.6% for AGIs $75k-100k, 19.5% for AGIs $100k-200k, 15.2% for AGIs over 200k)
Charity contributions: $12,063 (reported on 47.8% of returns)
Here:
$12,063
State:
$4,659
(% of AGI for various income ranges: 1.1% for AGIs below $25k, 1.0% for AGIs $25k-50k, 1.5% for AGIs $50k-75k, 1.6% for AGIs $75k-100k, 1.8% for AGIs $100k-200k, 1.8% for AGIs over 200k)
Taxes paid: $60,116 (reported on 56.2% of returns)
94025:
$60,116
State:
$14,448
(% of AGI for various income ranges: 5.4% for AGIs below $25k, 4.0% for AGIs $25k-50k, 5.5% for AGIs $50k-75k, 7.5% for AGIs $75k-100k, 9.1% for AGIs $100k-200k, 10.6% for AGIs over 200k)
Earned income credit: $1,859 (reported on 5.8% of returns)
Here:
$1,859
State:
$2,286
(% of AGI for various income ranges: 3.2% for AGIs below $25k, 0.5% for AGIs $25k-50k)
Percentage of individuals using paid preparers for their 2012 taxes: 58.4%
Here:
58%
State:
64%
(% for various income ranges: 55.2% for AGIs below $25k, 54.7% for AGIs $25k-50k, 51.0% for AGIs $50k-75k, 54.3% for AGIs $75k-100k, 55.0% for AGIs $100k-200k, 70.3% for AGIs over 200k)
Averages for the 2004 tax year for zip code 94025, filed in 2005:
Average Adjusted Gross Income (AGI) in 2004: $176,727 (Individual Income Tax Returns)
Here:
$176,727
State:
$58,600
Salary/wage: $124,545 (reported on 75.3% of returns)
Here:
$124,545
State:
$49,455
(% of AGI for various income ranges: 65.6% for AGIs $10k-25k, 71.6% for AGIs $25k-50k, 68.3% for AGIs $50k-75k, 70.1% for AGIs $75k-100k, 50.1% for AGIs over 100k)
Taxable interest for individuals: $6,884 (reported on 65.7% of returns)
This zip code:
$6,884
California:
$2,365
(% of AGI for various income ranges: 3.9% for AGIs $10k-25k, 2.7% for AGIs $25k-50k, 2.3% for AGIs $50k-75k, 2.3% for AGIs $75k-100k, 2.5% for AGIs over 100k)
Taxable dividends: $12,676 (reported on 53.0% of returns)
Here:
$12,676
State:
$4,746
(% of AGI for various income ranges: 5.6% for AGIs $10k-25k, 3.6% for AGIs $25k-50k, 4.0% for AGIs $50k-75k, 3.8% for AGIs $75k-100k, 3.7% for AGIs over 100k)
Net capital gain/loss: +$86,151 (reported on 49.0% of returns)
Here:
+$86,151
State:
+$23,418
(% of AGI for various income ranges: 1.6% for AGIs $10k-25k, 1.8% for AGIs $25k-50k, 2.0% for AGIs $50k-75k, 2.8% for AGIs $75k-100k, 27.3% for AGIs over 100k)
Profit/loss from business: +$38,499 (reported on 21.5% of returns)
Here:
+$38,499
State:
+$16,826
(% of AGI for various income ranges: 10.7% for AGIs $10k-25k, 7.2% for AGIs $25k-50k, 6.9% for AGIs $50k-75k, 6.5% for AGIs $75k-100k, 4.2% for AGIs over 100k)
Profit/loss from farming: +$29,870 (reported on 0.1% of returns)
Here:
+$29,870
State:
-$7,562
IRA payment deduction: $3,408 (reported on 3.2% of returns)
94025:
$3,408
California:
$3,192
(% of AGI for various income ranges: 0.3% for AGIs $10k-25k, 0.3% for AGIs $25k-50k, 0.2% for AGIs $50k-75k, 0.2% for AGIs $75k-100k, 0.0% for AGIs over 100k)
Self-employed pension: $23,539 (reported on 5.6% of returns)
Here:
$23,539
California:
$17,688
(% of AGI for various income ranges: 0.4% for AGIs $10k-25k, 0.3% for AGIs $25k-50k, 0.5% for AGIs $50k-75k, 0.8% for AGIs $75k-100k, 0.8% for AGIs over 100k)
Total itemized deductions: $51,454 (17% of AGI, reported on 55.1% of returns)
Here:
$51,454
State:
$28,113
Here:
17.5% of AGI
State:
25.3% of AGI
(% of AGI for various income ranges: 24.1% for AGIs $10k-25k, 17.2% for AGIs $25k-50k, 22.3% for AGIs $50k-75k, 20.6% for AGIs $75k-100k, 15.2% for AGIs over 100k)
Charity contributions deductions: $9,572 (3% of AGI, reported on 48.7% of returns)
Here:
$9,572
State:
$3,923
Here:
3.0% of AGI
State:
3.3% of AGI
(% of AGI for various income ranges: 1.4% for AGIs $10k-25k, 1.4% for AGIs $25k-50k, 1.9% for AGIs $50k-75k, 2.1% for AGIs $75k-100k, 2.8% for AGIs over 100k)
Total tax: $41,324 (reported on 84.4% of returns)
94025:
$41,324
State:
$10,761
(% of AGI for various income ranges: 5.2% for AGIs $10k-25k, 8.4% for AGIs $25k-50k, 11.4% for AGIs $50k-75k, 12.7% for AGIs $75k-100k, 21.1% for AGIs over 100k)
Earned income credit: $1,390 (reported on 5.2% of returns)
Here:
$1,390
State:
$1,763
Percentage of individuals using paid preparers for their 2004 taxes: 60.0%
Here:
60%
State:
66%
(% for various income ranges: 56.1% for AGIs below $10k, 59.3% for AGIs $10k-25k, 57.0% for AGIs $25k-50k, 58.0% for AGIs $50k-75k, 56.7% for AGIs $75k-100k, 65.0% for AGIs over 100k)
Likely homosexual households (counted as self-reported same-sex unmarried-partner households)
Lesbian couples: 0.3% of all households
Gay men: 0.1% of all households
Household received Food Stamps/SNAP in the past 12 months: 486 Household did not receive Food Stamps/SNAP in the past 12 months: 13,822
Women who had a birth in the past 12 months: 573 (471 now married, 100 unmarried) Women who did not have a birth in the past 12 months: 9,361 (4,218 now married, 5,121 unmarried)
Housing units in zip code 94025 with a mortgage: 5,864 (843 second mortgage, 18 home equity loan, 768 both second mortgage and home equity loan) Houses without a mortgage: 64
Median monthly owner costs for units with a mortgage: $3,876 Median monthly owner costs for units without a mortgage: $1,524
Residents with income below the poverty level in 2022:
This zip code:
5.4%
Whole state:
12.2%
Residents with income below 50% of the poverty level in 2022:
This zip code:
2.7%
Whole state:
6.2%
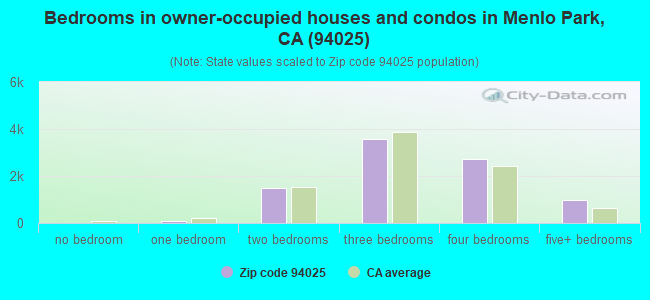
Median number of rooms in houses and condos:
Here:
6.5
State:
6.0
Median number of rooms in apartments:
Here:
3.8
State:
3.9
Notable locations in this zip code not listed on our city pages
Notable locations in zip code 94025: Allied Arts Guild (A), Menlo McCandless Office Park (B), Menlo Park Civic Center (C), Menlo Park Office Center (D), Vallombrosa Catholic Retreat Center (E), Bohannon Industrial Park (F), Sharon Heights Golf and Country Club (G), Stanford Linear Accelerator (H), McKeon Memorial Library (I), Harris Community Center (J), Burgess Theater (K), Belle Haven Office of Public Services (L), Menlo Park City Hall (M), Menlo Park Central Library (N), Menlo Park Fire Protection District Station 6 (O), Menlo Park Fire Protection District Station 77 (P), Menlo Park Fire Protection District Station 5 (Q), Menlo Park Fire Protection District Station 4 (R), Menlo Park Fire Protection District Station 1 Headquarters (S), Palo Alto Fire Department Station 7 (T). Display/hide their locations on the map
Churches in zip code 94025 include: Bethany Lutheran Church (A), Christ Temple Apostolic Church (B), The Church of Jesus Christ of Latter Day Saints (C), Corpus Christi Monastery (D), First United Pentecostal Church (E), Greater Friendship Baptist Church (F), Holy Trinity Episcopal Church (G), Macedonia Baptist Church (H), Menalto Baptist Church (I). Display/hide their locations on the map
Parks in zip code 94025 include: Nealon Park (1), Sharon Hills Park (2), Burgess Park (3), Camp Fremont Park (4), Flood County Park (5), Sharon Park (6), Stanford Hills Park (7), Bayfront Park (8), Joseph P Kelly Park (9). Display/hide their locations on the map
7,482 married couples with children.
1,069 single-parent households (156 men, 913 women).
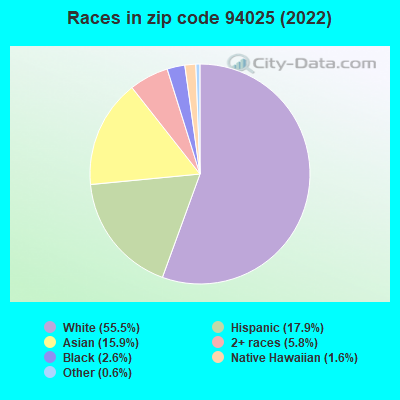
63.5% of residents of 94025 zip code speak English at home.
14.4% of residents speak Spanish at home (71% very well, 15% well, 10% not well, 4% not at all).
9.9% of residents speak other Indo-European language at home (89% very well, 9% well, 2% not well).
10.4% of residents speak Asian or Pacific Island language at home (77% very well, 14% well, 7% not well, 2% not at all).
2.1% of residents speak other language at home (95% very well, 5% not well).
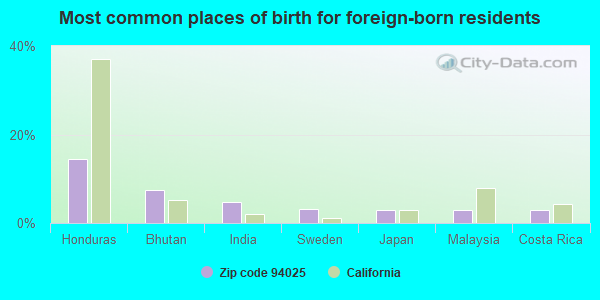
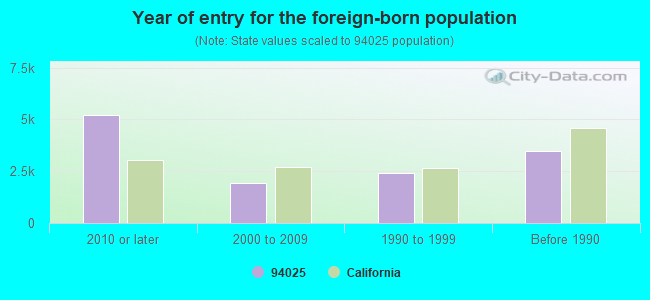
Foreign born population: 11,834 (29.1%) (46.2% of them are naturalized citizens)
Major facilities with environmental interests located in this zip code:
ALZA CORP (1050 HAMILTON CT in MENLO PARK, CA)
STATE MASTER (California - Hazardous Waste Tracking) - HAZARDOU WASTE PROGRAM PERFORMANCE TRACK (National Environmental Performance Track) HAZARDOUS WASTE BIENNIAL REPORTER (Resource Conservation and Recovery Act (tracking hazardous waste)) Large Quantity Generators, more that 1000 kg of hazardous waste/month (Resource Conservation and Recovery Act (tracking hazardous waste)) - notification Large Quantity Generators, more that 1000 kg of hazardous waste/month (Resource Conservation and Recovery Act (tracking hazardous waste)) - notification (Resource Conservation and Recovery Act (tracking hazardous waste)) Business NAICS classification: PHARMACEUTICAL PREPARATION MANUFACTURING. Organizations: ALZA CORP (MP2, MP1, MP4) (CONTACT/OPERATOR)
Alternative names: NEUREX CORP
IPT SRI COGENERATION INC (333 RAVENSWOOD DRIVE in MENLO PARK, CA)
STATE MASTER (California - Hazardous Waste Tracking) - HAZARDOU WASTE PROGRAM (Integrated Compliance Information System) - ICIS-09-1992-0059, FORMAL ENFORCEMENT ACTION COMPLIANCE ACTIVITY (Tracking inspections of insecticide, fungicide, and rodenticide, and toxic substances) CRITERIA AND HAZARDOUS AIR POLLUTANT INVENTORY (Inventory of air pollution sources) HAZARDOUS WASTE BIENNIAL REPORTER (Resource Conservation and Recovery Act (tracking hazardous waste)) Large Quantity Generators, more that 1000 kg of hazardous waste/month (Resource Conservation and Recovery Act (tracking hazardous waste)) Business SIC classification: ELECTRIC SERVICES; COMMERCIAL PHYSICAL AND BIOLOGICAL RESEARCH Organizations: SRI INTERNATIONAL (CONTACT/OPERATOR)
Alternative names: SRI INTERNATIONAL, SRI INTL-200
MEMRY CORPORATION (4020 CAMPBELL AVENUE in MENLO PARK, CA)
STATE MASTER (California - Hazardous Waste Tracking) - HAZARDOU WASTE PROGRAM HAZARDOUS WASTE BIENNIAL REPORTER (Resource Conservation and Recovery Act (tracking hazardous waste)) Large Quantity Generators, more that 1000 kg of hazardous waste/month (Resource Conservation and Recovery Act (tracking hazardous waste)) - notification Small Quantity Generators, between 100 kg and 1000 kg of hazardous waste/month (Resource Conservation and Recovery Act (tracking hazardous waste)) - notification Organizations: ALBERT M GOUNOD (CONTACT/OWNER)
Alternative names: MEMRY CORP WEST, MEMRY CORP WESTERN OPERATIONS, MEMRY STENT CAMPUS
MENLOTECH INCORPORATED (188 CONSTITUTION DRIVE in MENLO PARK, CA)
STATE MASTER (California - Hazardous Waste Tracking) - HAZARDOU WASTE PROGRAM CRITERIA AND HAZARDOUS AIR POLLUTANT INVENTORY (Inventory of air pollution sources) HAZARDOUS WASTE BIENNIAL REPORTER (Resource Conservation and Recovery Act (tracking hazardous waste)) Large Quantity Generators, more that 1000 kg of hazardous waste/month (Resource Conservation and Recovery Act (tracking hazardous waste)) (Resource Conservation and Recovery Act (tracking hazardous waste)) TRI REPORTER (Tracking of toxic chemicals releasing facilities) Business SIC classification: PRINTED CIRCUIT BOARDS Business NAICS classification: BARE PRINTED CIRCUIT BOARD MANUFACTURING.; OTHER ELECTRONIC COMPONENT MANUFACTURING. Organizations: RAY MAUBERRET (CONTACT/OPERATOR)
, JAY SUH (CONTACT/OWNER)
, RAY MAUBERRETT (CONTACT/OWNER)
GYNECARE INCORPORATED (235 CONSTITUTION DRIVE in MENLO PARK, CA)
STATE MASTER (California - Hazardous Waste Tracking) - HAZARDOU WASTE PROGRAM CRITERIA AND HAZARDOUS AIR POLLUTANT INVENTORY (Inventory of air pollution sources) Large Quantity Generators, more that 1000 kg of hazardous waste/month (Resource Conservation and Recovery Act (tracking hazardous waste)) - notification Business SIC classification: PHARMACEUTICAL PREPARATIONS; SURGICAL AND MEDICAL INSTRUMENTS AND APPARATUS Business NAICS classification: PHARMACEUTICAL PREPARATION MANUFACTURING. Organizations: ALZA CORP (CONTACT/OPERATOR)
, DAVID D BOHANNON ORGANIZATION (CONTACT/OWNER)
Alternative names: ORTHO MCNEIL PHARMACEUTICAL, ORTHO MCNEIL PHARMACEUTICALS
CHEVRON STATION NO 98880 (100 MIDDLEFIELD RD in MENLO PARK, CA)
STATE MASTER (California - Hazardous Waste Tracking) - HAZARDOU WASTE PROGRAM Large Quantity Generators, more that 1000 kg of hazardous waste/month (Resource Conservation and Recovery Act (tracking hazardous waste)) Organizations: CHEVRON PRODUCTS CO. (CONTACT/OPERATOR)
KOB AUTO INC (3717 HAVEN AVENUE in MENLO PARK, CA)
STATE MASTER (California - Hazardous Waste Tracking) - HAZARDOU WASTE PROGRAM Small Quantity Generators, between 100 kg and 1000 kg of hazardous waste/month (Resource Conservation and Recovery Act (tracking hazardous waste)) Small Quantity Generators, between 100 kg and 1000 kg of hazardous waste/month (Resource Conservation and Recovery Act (tracking hazardous waste)) - notification Business NAICS classification: PRIMARY SMELTING AND REFINING OF NONFERROUS METAL (EXCEPT COPPER AND ALUMINUM).; ALL OTHER INDUSTRIAL MACHINERY MANUFACTURING.; OTHER ELECTRONIC COMPONENT MANUFACTURING. Organizations: SILTEC CORPORATION (CONTACT/OPERATOR)
, JAM SAUERBRY (CONTACT/OWNER)
Alternative names: K O B AUTO, MITSUBISHI SILICON AMERICA, R I CHEMICAL INC
ANDERSON CADILLAC-OLDSMOBILE (1300 EL CAMINO REAL in MENLO PARK, CA)
STATE MASTER (California - Hazardous Waste Tracking) - HAZARDOU WASTE PROGRAM CRITERIA AND HAZARDOUS AIR POLLUTANT INVENTORY (Inventory of air pollution sources) Small Quantity Generators, between 100 kg and 1000 kg of hazardous waste/month (Resource Conservation and Recovery Act (tracking hazardous waste)) - notification Business SIC classification: MOTOR VEHICLE DEALERS (NEW AND USED) Organizations: JOHN ANDERSON (CONTACT/OWNER)
Alternative names: CADILLAC OF MENLO PARK
LANDEC CORPORATION (3603 HAVEN AVE in MENLO PARK, CA)
STATE MASTER (California - Hazardous Waste Tracking) - HAZARDOU WASTE PROGRAM CRITERIA AND HAZARDOUS AIR POLLUTANT INVENTORY (Inventory of air pollution sources) HAZARDOUS WASTE BIENNIAL REPORTER (Resource Conservation and Recovery Act (tracking hazardous waste)) Small Quantity Generators, between 100 kg and 1000 kg of hazardous waste/month (Resource Conservation and Recovery Act (tracking hazardous waste)) - notification Business SIC classification: ORTHOPEDIC, PROSTHETIC, AND SURGICAL APPLIANCES AND SUPPLIES Organizations: BROWN INVESTMENT GROUP (CONTACT/OWNER)
Alternative names: SUNESIS PHARMACEUTICALS
CHEVRON 207718 (1399 WILLOW RD in MENLO PARK, CA)
STATE MASTER (California - Hazardous Waste Tracking) - HAZARDOU WASTE PROGRAM Small Quantity Generators, between 100 kg and 1000 kg of hazardous waste/month (Resource Conservation and Recovery Act (tracking hazardous waste)) Organizations: CHEVRON PRODUCTS CO. (CONTACT/OWNER)
NOREN PRODUCTS (1010 OBRIEN DR in MENLO PARK, CA)
STATE MASTER (California - Hazardous Waste Tracking) - HAZARDOU WASTE PROGRAM Small Quantity Generators, between 100 kg and 1000 kg of hazardous waste/month (Resource Conservation and Recovery Act (tracking hazardous waste)) - notification Business NAICS classification: INSTRUMENTS AND RELATED PRODUCTS MANUFACTURING FOR MEASURING, DISPLAYING, AND CONTROLLING INDUSTRIAL PROCESS VARIABLES. Organizations: DON NOREN (CONTACT/OWNER)
ELDORADO FORKLIFT CO (3607 HAVEN AVE in MENLO PARK, CA)
STATE MASTER (California - Hazardous Waste Tracking) - HAZARDOU WASTE PROGRAM Small Quantity Generators, between 100 kg and 1000 kg of hazardous waste/month (Resource Conservation and Recovery Act (tracking hazardous waste)) - notification Organizations: PHILIP PHILIPOPOULOS (CONTACT/OWNER)
LA ENTRADA MIDDLE SCHOOL (2200 SHARON RD in MENLO PARK, CA)
COMPLIANCE ACTIVITY (Tracking inspections of insecticide, fungicide, and rodenticide, and toxic substances) (National Center for Education Statistics) - STATE ID-6044093 Organizations: LAS LOMITAS ELEMENTARY (SCHOOL DISTRICT)
Housing units lacking complete plumbing facilities: 0.4% Housing units lacking complete kitchen facilities: 1.2%
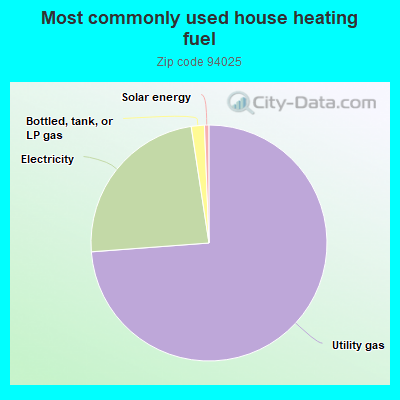
73.3%Utility gas
23.6%Electricity
1.8%Bottled, tank, or LP gas
0.6%Solar energy
Population in 1990: 38,383. Population change in the 1990s: +678 (+1.8%).
Place of birth for U.S.-born residents:
This state: 18,140
Northeast: 3,196
Midwest: 2,661
South: 2,489
West: 1,432
58% of the 94025 zip code residents lived in the same house 5 years ago. Out of people who lived in different houses, 41% lived in this county. Out of people who lived in different counties, 50% lived in California.
83% of the 94025 zip code residents lived in the same house 1 year ago. Out of people who lived in different houses, 25% moved from this county. Out of people who lived in different houses, 40% moved from different county within same state. Out of people who lived in different houses, 21% moved from different state. Out of people who lived in different houses, 16% moved from abroad.
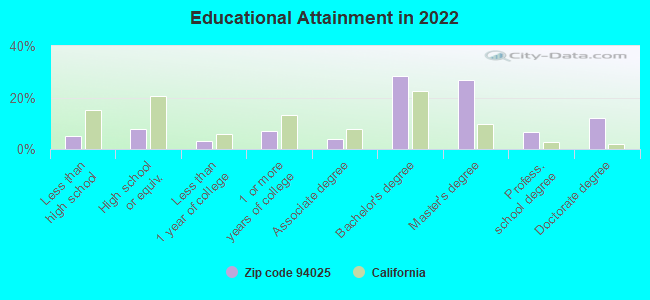
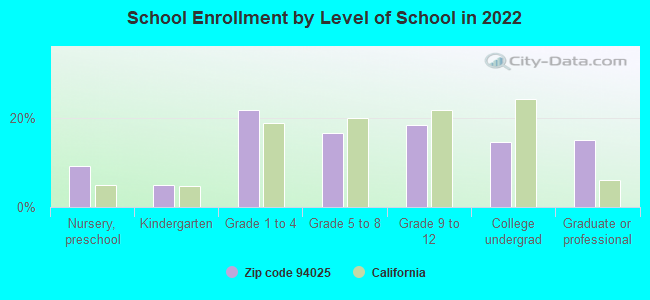
Private vs. public school enrollment:
Students in private schools in grades 1 to 8 (elementary and middle school): 759
Here:
18.4%
California:
10.5%
Students in private schools in grades 9 to 12 (high school): 509
Here:
25.9%
California:
8.5%
Students in private undergraduate colleges: 454
Here:
28.9%
California:
15.9%
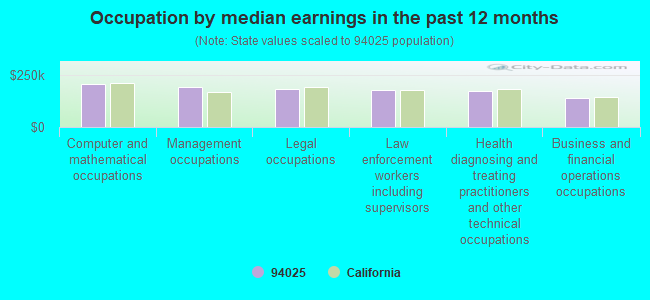
Occupation by median earnings in the past 12 months ($)
208,053Computer and mathematical occupations
190,725Management occupations
184,475Legal occupations
177,425Law enforcement workers including supervisors
175,273Health diagnosing and treating practitioners and other technical occupations
140,180Business and financial operations occupations
Companies with biggest federal contracts located in this zip code (MENLO PARK, CA):
SRI INTERNATIONAL (333 RAVENSWOOD AVE) : $701,214,475 in 1547 contractsfrom 1999 to 2006
Contracts for Office Information System Equipment, Other Research and Development -- Applied Research and Exploratory Development (R&D), Physical Sciences -- Applied Research and Exploratory Development (R&D), Engineering and Technical Services, and moreby Navy, Office of Policy, Management and Budget/Chief Financial Officer, National Institutes of Health, Defense Advanced Research Projects Agency, and others Signed by year:2000: $79,953,448; 2001: $138,657,329; 2002: $72,813,204; 2003: $82,714,544; 2004: $126,345,055; 2005: $98,893,716; 2006: $89,593,664.
Biggest contracts:
$88,117,180 with Navy for Office Information System Equipment. Signed on 2001-09-29. Completion date: 2002-09-28.
$24,380,000 with Office of Policy, Management and Budget/Chief Financial Officer for Other Research and Development -- Applied Research and Exploratory Development (R&D). Signed on 2005-09-19. Completion date: 2006-11-18.
$21,692,188 with National Institutes of Health for Physical Sciences -- Applied Research and Exploratory Development (R&D). Signed on 2006-09-14. Effective on 2006-09-15. Completion date: 2011-09-14.
$21,381,000 with Navy for Engineering and Technical Services. Signed on 2000-06-06. Completion date: 2001-01-18.
GOODMAN BALL INC (3639 HAVEN AVE; small business) : $39,327,359 in 290 contractsfrom 1999 to 2006
Contracts for Generators and Generators Sets, Electrical, Night Vision Equipment, Emitted and Reflected Radiation, Motor Vehicle Maintenance and Repair Shop Specialized Equipment, Airframe Structural Components, and moreby Army, Air Force, Defense Logistics Agency, Navy, and others Signed by year:2000: $5,027,662; 2001: $3,717,795; 2002: $1,969,789; 2003: $7,261,720; 2004: $7,984,852; 2005: $10,437,168; 2006: $2,845,261.
Biggest contracts:
$3,116,172 with Army for Generators and Generators Sets, Electrical. Signed on 2004-07-28. Completion date: 2005-07-31.
$3,048,061, same as above.Signed on 2003-09-04. Completion date: 2006-06-24.
$2,398,084, same as above.Signed on 2006-03-14. Completion date: 2006-09-04.
$2,199,516, same as above.Signed on 2005-11-23. Completion date: 2006-03-16.
RANDTRON ANTENNA SYSTEMS (130 CONSTITUTION DR) : $23,595,770 in 126 contractsfrom 1999 to 2006
Contracts for Antennas, Waveguides, and Related Equipment, Other Defense -- Advanced Development (R&D), Miscellaneous Communication Equipment, Maintenance, Repair and Rebuilding of Equipment -- Electrical and Electronic Equipment Components, and moreby Air Force, Navy, Defense Logistics Agency, Army, and others Signed by year:2000: $3,671,981; 2001: $3,817,564; 2002: $4,789,152; 2003: $3,247,443; 2004: $1,959,732; 2005: $2,415,950; 2006: $2,915,558.
Biggest contracts:
$2,113,536 with Air Force for Antennas, Waveguides, and Related Equipment. Signed on 2002-11-15. Completion date: 2004-06-30.
$1,899,360 with Navy for Antennas, Waveguides, and Related Equipment. Signed on 2003-09-22. Completion date: 2004-01-02.
$1,375,000 with Air Force for Antennas, Waveguides, and Related Equipment. Signed on 2000-05-19. Completion date: 2001-11-30.
$1,015,000, same as above.Signed on 2000-09-11. Completion date: 2003-04-28.
TYCO ELECTRONICS (300 CONSTITUTION DR) : $10,466,510 in 780 contractsfrom 1999 to 2006
Contracts for Connectors, Electrical, Hose and Flexible Tubing, Lugs, Terminals, and Terminal Strips, Miscellaneous Maintenance and Repair Shop Specialized Equipment, and moreby Defense Logistics Agency, Navy, Bureau of Prisoners/Federal Prison System, Air Force, and others Signed by year:2000: $783,725; 2001: $1,354,067; 2002: $1,865,479; 2003: $707,429; 2004: $2,226,886; 2005: $2,078,096; 2006: $1,369,828.
Biggest contracts:
$640,000 with Defense Logistics Agency for Connectors, Electrical. Signed on 2002-09-27. Completion date: 2003-02-24.
$443,134 with Navy for Hose and Flexible Tubing. Signed on 2006-04-25. Completion date: 2006-08-18.
$320,000 with Defense Logistics Agency for Connectors, Electrical. Signed on 2004-08-24. Completion date: 2005-01-21.
$306,600 with Defense Logistics Agency for Lugs, Terminals, and Terminal Strips. Signed on 2001-11-29. Completion date: 2002-01-29.
L-3 COMMUNICATIONS CORPORATION (130 CONSTITUTION DR) : $7,279,081 in 67 contractsfrom 2000 to 2006
Contracts for Antennas, Waveguides, and Related Equipment, Engineering and Technical Services, Airframe Structural Components, Connectors, Electrical, and moreby Air Force, Defense Logistics Agency Signed by year:2000: $482,056; 2001: $45,084; 2002: $220,640; 2003: $1,438,281; 2004: $1,413,852; 2005: $3,285,573; 2006: $393,595.
Biggest contracts:
$1,874,545 with Air Force for Antennas, Waveguides, and Related Equipment. Signed on 2005-05-18. Completion date: 2009-03-17.
$509,856, same as above.Signed on 2005-08-09. Completion date: 2005-08-08.
$359,326, same as above.Signed on 2005-05-13. Completion date: 2006-06-01.
$336,875 with Defense Logistics Agency for Antennas, Waveguides, and Related Equipment. Signed on 2000-06-26. Completion date: 2001-06-23.
ACUITY TECHNOLOGIES, INC (3475 EDISON WAY STE P; small business) 50 employees, $0 revenue. : $2,273,154 in 11 contractsfrom 2002 to 2006
Contracts for Other Defense -- Applied Research and Exploratory Development (R&D), Weapons -- Management and Support (R&D), Other Defense -- Basic Research (R&D), Defense Electronics and Communication Equipment -- Basic Research (R&D), and moreby Army, Air Force, Navy, NASA, and others Signed by year:2000: $0; 2001: $0; 2002: $98,608; 2003: $99,748; 2004: $1,099,957; 2005: $429,923; 2006: $544,918.
Biggest contracts:
$1,000,000 with Army for Other Defense -- Applied Research and Exploratory Development (R&D). Signed on 2004-06-14. Completion date: 2006-09-25.
$374,929 with Air Force for Weapons -- Management and Support (R&D). Signed on 2006-05-31. Completion date: 2008-05-30.
$250,000 with Army for Other Defense -- Applied Research and Exploratory Development (R&D). Signed on 2005-05-26. Completion date: 2006-09-25.
$100,000 with Air Force for Other Defense -- Basic Research (R&D). Signed on 2006-06-16. Completion date: 2007-03-30.
INFORMIX SOFTWARE INC (4100 BOHANNON DR) : $2,257,116 in 27 contractsfrom 1999 to 2003
Contracts for ADP Central Processing Unit (CPU, Computer), Analog, ADP Software, Other ADP and Telecommunications Services (includes data storage on tapes, compact disks, etc.), ADP Systems Development Services, and moreby Navy, Employment Standards Administration, Army, Minerals Management Service, and others Signed by year:2000: $445,861; 2001: $1,031,073; 2002: $210,878; 2003: $143,493; 2004: $0; 2005: $0; 2006: $0.
Biggest contracts:
$652,389 with Navy for ADP Central Processing Unit (CPU, Computer), Analog. Signed on 2001-10-01. Completion date: 2001-10-01.
$318,000 with Employment Standards Administration for ADP Software. Taking place in DC. Signed on 1999-10-15. Completion date: 2000-09-15.
$164,402 with Army for ADP Software. Taking place in VA. Signed on 2000-12-12. Completion date: 2001-01-31.
$145,000 with Minerals Management Service for Other ADP and Telecommunications Services (includes data storage on tapes, compact disks, etc.). Signed on 2001-06-15. Completion date: 2002-07-15.
CARCO ELECTRONICS (195 CONSTITUTION DR; small business) : $2,020,331 in 16 contractsfrom 1999 to 2005
Contracts for Operation Training Devices, Combination and Miscellaneous Instruments, Flight Instruments, Other Defense -- Applied Research and Exploratory Development (R&D), and moreby Air Force, Navy, Army Signed by year:2000: $474,910; 2001: $107,114; 2002: $160,833; 2003: $55,968; 2004: $21,042; 2005: -$10,185; 2006: $0.
Biggest contracts:
$1,210,649 with Air Force for Operation Training Devices. Signed on 1999-11-01. Completion date: 2001-01-04.
$256,686 with Navy for Combination and Miscellaneous Instruments. Signed on 2000-09-30. Completion date: 2001-08-29.
$107,114 with Air Force for Flight Instruments. Signed on 2001-12-28. Completion date: 2002-06-14.
$81,207, same as above.Signed on 2002-02-07. Completion date: 2002-06-24.
MITEM CORPORATION (640 MENLO AVE; small business) : $1,455,600 in 3 contractsfrom 2004 to 2005
$659,640 with Defense Information Systems Agency for Other ADP and Telecommunications Services (includes data storage on tapes, compact disks, etc.). Signed on 2004-02-20. Completion date: 2005-02-19.
$615,960, same as above.Signed on 2004-08-06. Completion date: 2005-08-05.
$180,000 with Department of Defense for Other ADP and Telecommunications Services (includes data storage on tapes, compact disks, etc.). Taking place in OK. Signed on 2005-06-15. Completion date: 2006-08-05.
BAY MATERIALS LLC (3700 HAVEN COURT; small business) : $948,513 in 6 contractsfrom 2002 to 2006
Contracts for Other Medical -- Basic Research (R&D), Other Research and Development -- Basic Research (R&D) by Army, Air Force Signed by year:2000: $0; 2001: $0; 2002: $70,000; 2003: $397,980; 2004: $381,820; 2005: $0; 2006: $98,713.
Biggest contracts:
$381,800 with Army for Other Medical -- Basic Research (R&D). Signed on 2004-11-24. Completion date: 2005-11-15.
$347,980, same as above.Signed on 2003-11-06. Completion date: 2003-11-15.
$98,713 with Air Force for Other Research and Development -- Basic Research (R&D). Signed on 2006-05-02. Completion date: 2007-01-31.
$70,000 with Army for Other Medical -- Basic Research (R&D). Signed on 2002-12-13. Completion date: 2003-07-15.
Top industries in this zip code by the number of employees in 2005:
Administrative and Support and Waste Management and Remediation Services: Employment Placement Agencies (over 1000: 1, 1-4: 4)
Professional, Scientific, and Technical Services: Research and Development in the Physical, Engineering, and Life Sciences (500-999: 1, 50-99: 5, 20-49: 6, 10-19: 4, 5-9: 13, 1-4: 8)
Professional, Scientific, and Technical Services: Offices of Lawyers (100-249: 3, 50-99: 4, 20-49: 1, 10-19: 8, 5-9: 4, 1-4: 32)
2005 - 2018 National Fire Incident Reporting System (NFIRS) incidents
According to the data from the years 2005 - 2018 the average number of fires per year is 59. The highest number of reported fire incidents - 123 took place in 2009, and the least - 15 in 2015. The data has an increasing trend.
When looking into fire subcategories, the most incidents belonged to: Structure Fires (39.1%), and Outside Fires (37.6%).
Fire incident types reported to NFIRS in Zip Code 94025


+$29,870
-$7,562
 Nearest zip codes: 94027, 94301, 94305, 94063, 94061, 94303.
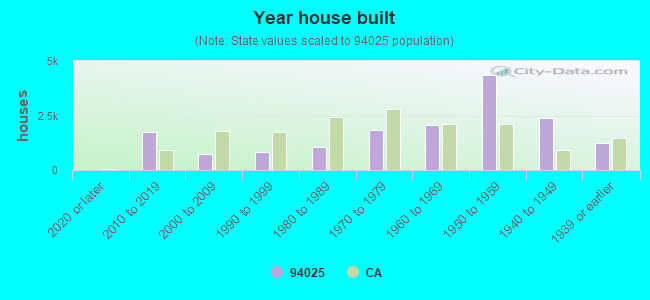


 According to the data from the years 2005 - 2018 the average number of fires per year is 59. The highest number of reported fire incidents - 123 took place in 2009, and the least - 15 in 2015. The data has an increasing trend.
 When looking into fire subcategories, the most incidents belonged to: Structure Fires (39.1%), and Outside Fires (37.6%).