Estimated zip code population in 2022: 37,227 Zip code population in 2010: 36,245 Zip code population in 2000: 35,718
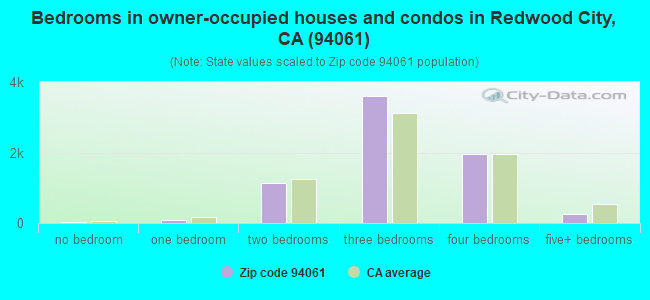
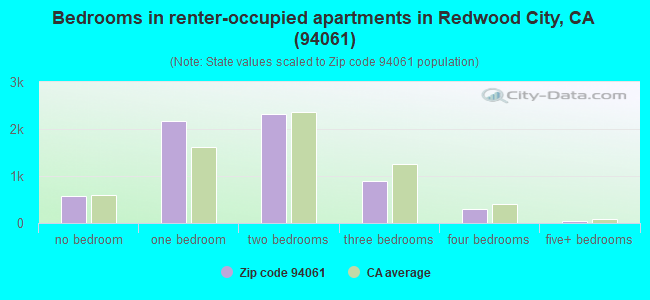
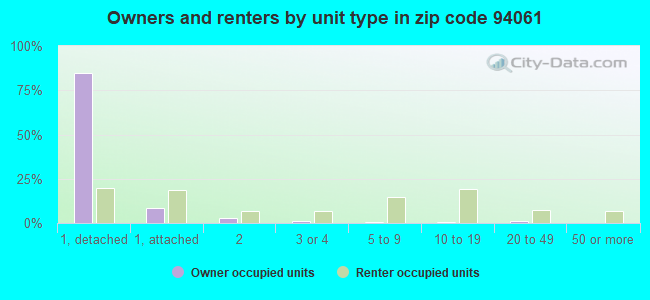
Houses and condos: 14,362 Renter-occupied apartments: 6,318
% of renters here:
47%
State:
44%
March 2022 cost of living index in zip code 94061: 137.2 (high, U.S. average is 100)
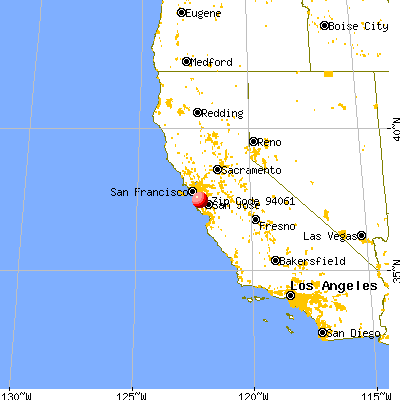
Land area: 3.9 sq. mi. Water area: 0.0 sq. mi.
Population density: 9,643 people per square mile
(high).
OSM Map
General Map
Google Map
MSN Map
OSM Map
General Map
Google Map
MSN Map
OSM Map
General Map
Google Map
MSN Map
OSM Map
General Map
Google Map
MSN Map
Please wait while loading the map...
Real estate property taxes paid for housing units in 2022:
This zip code:
0.5% ($9,103)
California:
0.7% ($4,831)
Median real estate property taxes paid for housing units with mortgages in 2022: $10,330 (0.5%) Median real estate property taxes paid for housing units with no mortgage in 2022: $5,097 (0.3%)
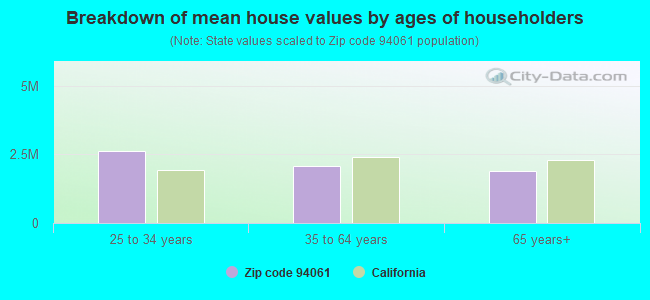
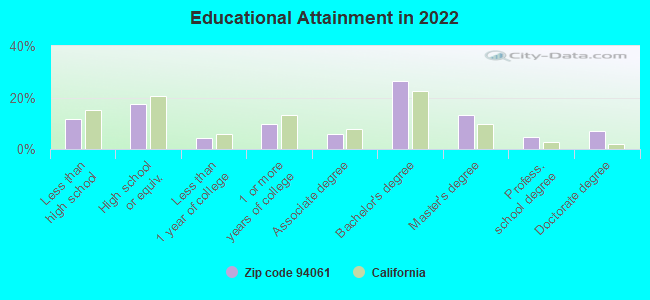
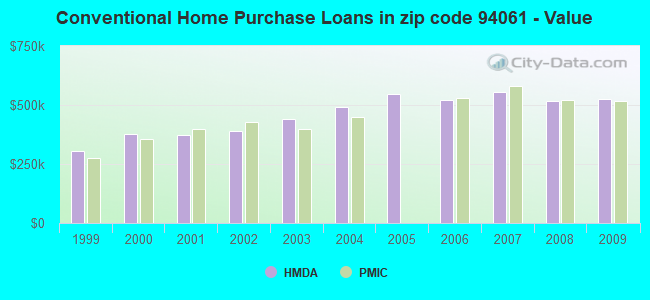
Estimated median house/condo value in 2022: $2,003,391
94061:
$2,003,391
California:
$715,900
According to our research of California and other state lists, there were 23 registered sex offenders living in 94061 zip code as of April 27, 2024. The ratio of all residents to sex offenders in zip code 94061 is 1,707 to 1. The ratio of registered sex offenders to all residents in this zip code is lower than the state average.
Median resident age:
This zip code:
37.9 years
California median age:
37.9 years
Average household size:
This zip code:
2.7 people
California:
2.8 people
Averages for the 2020 tax year for zip code 94061, filed in 2021:
Average Adjusted Gross Income (AGI) in 2020: $167,483 (Individual Income Tax Returns)
Here:
$167,483
State:
$95,910
Salary/wage: $157,469 (reported on 80.0% of returns)
Here:
$157,469
State:
$77,331
(% of AGI for various income ranges: 1339.3% for AGIs below $25k, 4164.4% for AGIs $25k-50k, 7605.9% for AGIs $50k-75k, 11274.1% for AGIs $75k-100k, 21361.0% for AGIs $100k-200k, 175024.0% for AGIs over 200k)
Taxable interest for individuals: $2,486 (reported on 44.8% of returns)
This zip code:
$2,486
California:
$2,294
(% of AGI for various income ranges: 34.9% for AGIs below $25k, 42.5% for AGIs $25k-50k, 80.1% for AGIs $50k-75k, 122.7% for AGIs $75k-100k, 239.5% for AGIs $100k-200k, 1357.6% for AGIs over 200k)
Ordinary dividends: $10,970 (reported on 36.3% of returns)
Here:
$10,970
State:
$10,949
(% of AGI for various income ranges: 66.5% for AGIs below $25k, 86.5% for AGIs $25k-50k, 217.8% for AGIs $50k-75k, 322.8% for AGIs $75k-100k, 772.3% for AGIs $100k-200k, 5478.2% for AGIs over 200k)
Net capital gain/loss in AGI: +$41,371 (reported on 34.6% of returns)
Here:
+$41,371
State:
+$49,306
(% of AGI for various income ranges: 32.0% for AGIs below $25k, 64.3% for AGIs $25k-50k, 134.8% for AGIs $50k-75k, 302.6% for AGIs $75k-100k, 933.4% for AGIs $100k-200k, 25600.2% for AGIs over 200k)
Profit/loss from business: +$26,002 (reported on 19.3% of returns)
Here:
+$26,002
State:
+$15,671
(% of AGI for various income ranges: 396.3% for AGIs below $25k, 469.3% for AGIs $25k-50k, 393.4% for AGIs $50k-75k, 670.1% for AGIs $75k-100k, 1130.9% for AGIs $100k-200k, 4745.7% for AGIs over 200k)
Taxable individual retirement arrangement distribution: $22,231 (reported on 8.8% of returns)
94061:
$22,231
California:
$23,505
(% of AGI for various income ranges: 56.3% for AGIs below $25k, 126.6% for AGIs $25k-50k, 223.6% for AGIs $50k-75k, 386.7% for AGIs $75k-100k, 816.4% for AGIs $100k-200k, 1323.1% for AGIs over 200k)
Self-employed (Keogh) retirement plans: $29,561 (reported on 1.8% of returns)
94061:
$29,561
California:
$30,163
(% of AGI for various income ranges: 15.2% for AGIs $25k-50k, 41.2% for AGIs $75k-100k, 96.3% for AGIs $100k-200k, 793.4% for AGIs over 200k)
Total itemized deductions: $46,669 (reported on 22.6% of returns)
Here:
$46,669
State:
$39,517
(% of AGI for various income ranges: 185.5% for AGIs below $25k, 275.7% for AGIs $25k-50k, 540.8% for AGIs $50k-75k, 935.1% for AGIs $75k-100k, 2369.9% for AGIs $100k-200k, 13856.9% for AGIs over 200k)
Charity contributions: $9,926 (reported on 18.3% of returns)
Here:
$9,926
State:
$12,598
(% of AGI for various income ranges: 5.5% for AGIs below $25k, 18.8% for AGIs $25k-50k, 50.3% for AGIs $50k-75k, 88.7% for AGIs $75k-100k, 238.3% for AGIs $100k-200k, 2926.7% for AGIs over 200k)
Taxes paid: $9,218 (reported on 22.6% of returns)
94061:
$9,218
State:
$8,807
(% of AGI for various income ranges: 36.7% for AGIs below $25k, 54.1% for AGIs $25k-50k, 129.3% for AGIs $50k-75k, 243.3% for AGIs $75k-100k, 641.4% for AGIs $100k-200k, 2352.0% for AGIs over 200k)
Earned income credit: $1,827 (reported on 6.3% of returns)
Here:
$1,827
State:
$2,074
(% of AGI for various income ranges: 60.3% for AGIs below $25k, 43.6% for AGIs $25k-50k)
Percentage of individuals using paid preparers for their 2020 taxes: 91.8%
Here:
92%
State:
92%
(% for various income ranges: 87.1% for AGIs below $25k, 90.1% for AGIs $25k-50k, 92.3% for AGIs $50k-75k, 93.1% for AGIs $75k-100k, 93.3% for AGIs $100k-200k, 95.9% for AGIs over 200k)
Averages for the 2012 tax year for zip code 94061, filed in 2013:
Average Adjusted Gross Income (AGI) in 2012: $94,771 (Individual Income Tax Returns)
Here:
$94,771
State:
$72,726
Salary/wage: $83,113 (reported on 81.3% of returns)
Here:
$83,113
State:
$59,079
(% of AGI for various income ranges: 70.6% for AGIs below $25k, 78.8% for AGIs $25k-50k, 73.4% for AGIs $50k-75k, 73.9% for AGIs $75k-100k, 78.1% for AGIs $100k-200k, 65.4% for AGIs over 200k)
Taxable interest for individuals: $1,841 (reported on 42.3% of returns)
This zip code:
$1,841
California:
$2,146
(% of AGI for various income ranges: 1.3% for AGIs below $25k, 0.9% for AGIs $25k-50k, 1.0% for AGIs $50k-75k, 0.8% for AGIs $75k-100k, 0.7% for AGIs $100k-200k, 0.8% for AGIs over 200k)
Ordinary dividends: $7,682 (reported on 29.2% of returns)
Here:
$7,682
State:
$9,308
(% of AGI for various income ranges: 2.6% for AGIs below $25k, 1.8% for AGIs $25k-50k, 2.4% for AGIs $50k-75k, 2.0% for AGIs $75k-100k, 1.9% for AGIs $100k-200k, 2.8% for AGIs over 200k)
Net capital gain/loss in AGI: +$29,156 (reported on 26.2% of returns)
Here:
+$29,156
State:
+$30,460
(% of AGI for various income ranges: 0.4% for AGIs $25k-50k, 0.7% for AGIs $50k-75k, 0.7% for AGIs $75k-100k, 1.4% for AGIs $100k-200k, 16.4% for AGIs over 200k)
Profit/loss from business: +$25,145 (reported on 19.0% of returns)
Here:
+$25,145
State:
+$17,064
(% of AGI for various income ranges: 16.1% for AGIs below $25k, 7.3% for AGIs $25k-50k, 5.3% for AGIs $50k-75k, 6.0% for AGIs $75k-100k, 4.6% for AGIs $100k-200k, 3.7% for AGIs over 200k)
Taxable individual retirement arrangement distribution: $16,858 (reported on 9.7% of returns)
94061:
$16,858
California:
$19,557
(% of AGI for various income ranges: 2.7% for AGIs below $25k, 2.1% for AGIs $25k-50k, 3.0% for AGIs $50k-75k, 2.9% for AGIs $75k-100k, 2.1% for AGIs $100k-200k, 0.9% for AGIs over 200k)
Self-employment retirement plans: $20,680 (reported on 1.7% of returns)
94061:
$20,680
California:
$24,530
(% of AGI for various income ranges: 0.2% for AGIs $25k-50k, 0.1% for AGIs $50k-75k, 0.3% for AGIs $75k-100k, 0.4% for AGIs $100k-200k, 0.5% for AGIs over 200k)
Total itemized deductions: $38,690 (21% of AGI, reported on 40.1% of returns)
Here:
$38,690
State:
$34,004
Here:
21.3% of AGI
State:
22.7% of AGI
(% of AGI for various income ranges: 12.7% for AGIs below $25k, 9.8% for AGIs $25k-50k, 14.0% for AGIs $50k-75k, 16.8% for AGIs $75k-100k, 19.1% for AGIs $100k-200k, 16.7% for AGIs over 200k)
Charity contributions: $3,422 (reported on 32.6% of returns)
Here:
$3,422
State:
$4,659
(% of AGI for various income ranges: 0.5% for AGIs below $25k, 0.7% for AGIs $25k-50k, 1.1% for AGIs $50k-75k, 1.3% for AGIs $75k-100k, 1.4% for AGIs $100k-200k, 1.2% for AGIs over 200k)
Taxes paid: $17,317 (reported on 40.0% of returns)
94061:
$17,317
State:
$14,448
(% of AGI for various income ranges: 2.3% for AGIs below $25k, 2.2% for AGIs $25k-50k, 3.7% for AGIs $50k-75k, 6.1% for AGIs $75k-100k, 8.1% for AGIs $100k-200k, 9.1% for AGIs over 200k)
Earned income credit: $1,888 (reported on 8.8% of returns)
Here:
$1,888
State:
$2,286
(% of AGI for various income ranges: 3.3% for AGIs below $25k, 0.6% for AGIs $25k-50k)
Percentage of individuals using paid preparers for their 2012 taxes: 61.5%
Here:
62%
State:
64%
(% for various income ranges: 61.3% for AGIs below $25k, 63.1% for AGIs $25k-50k, 58.8% for AGIs $50k-75k, 62.0% for AGIs $75k-100k, 59.1% for AGIs $100k-200k, 66.5% for AGIs over 200k)
Averages for the 2004 tax year for zip code 94061, filed in 2005:
Average Adjusted Gross Income (AGI) in 2004: $66,529 (Individual Income Tax Returns)
Here:
$66,529
State:
$58,600
Salary/wage: $62,834 (reported on 79.8% of returns)
Here:
$62,834
State:
$49,455
(% of AGI for various income ranges: 174.4% for AGIs below $10k, 69.3% for AGIs $10k-25k, 77.6% for AGIs $25k-50k, 74.8% for AGIs $50k-75k, 76.6% for AGIs $75k-100k, 74.5% for AGIs over 100k)
Taxable interest for individuals: $2,172 (reported on 53.7% of returns)
This zip code:
$2,172
California:
$2,365
(% of AGI for various income ranges: 15.1% for AGIs below $10k, 3.1% for AGIs $10k-25k, 2.0% for AGIs $25k-50k, 2.1% for AGIs $50k-75k, 1.6% for AGIs $75k-100k, 1.4% for AGIs over 100k)
Taxable dividends: $3,941 (reported on 33.9% of returns)
Here:
$3,941
State:
$4,746
(% of AGI for various income ranges: 12.8% for AGIs below $10k, 2.7% for AGIs $10k-25k, 1.7% for AGIs $25k-50k, 2.0% for AGIs $50k-75k, 1.7% for AGIs $75k-100k, 2.0% for AGIs over 100k)
Net capital gain/loss: +$10,291 (reported on 29.9% of returns)
Here:
+$10,291
State:
+$23,418
(% of AGI for various income ranges: -5.5% for AGIs below $10k, 0.1% for AGIs $10k-25k, 0.6% for AGIs $25k-50k, 0.6% for AGIs $50k-75k, 1.3% for AGIs $75k-100k, 7.7% for AGIs over 100k)
Profit/loss from business: +$22,085 (reported on 17.6% of returns)
Here:
+$22,085
State:
+$16,826
(% of AGI for various income ranges: 16.9% for AGIs below $10k, 11.7% for AGIs $10k-25k, 6.7% for AGIs $25k-50k, 5.8% for AGIs $50k-75k, 5.8% for AGIs $75k-100k, 5.0% for AGIs over 100k)
IRA payment deduction: $3,250 (reported on 2.9% of returns)
94061:
$3,250
California:
$3,192
(% of AGI for various income ranges: 0.7% for AGIs below $10k, 0.2% for AGIs $10k-25k, 0.2% for AGIs $25k-50k, 0.2% for AGIs $50k-75k, 0.2% for AGIs $75k-100k, 0.1% for AGIs over 100k)
Self-employed pension: $13,698 (reported on 2.3% of returns)
Here:
$13,698
California:
$17,688
(% of AGI for various income ranges: 0.2% for AGIs $10k-25k, 0.2% for AGIs $25k-50k, 0.4% for AGIs $50k-75k, 0.4% for AGIs $75k-100k, 0.6% for AGIs over 100k)
Total itemized deductions: $28,861 (25% of AGI, reported on 42.3% of returns)
Here:
$28,861
State:
$28,113
Here:
25.0% of AGI
State:
25.3% of AGI
(% of AGI for various income ranges: 61.1% for AGIs below $10k, 15.3% for AGIs $10k-25k, 13.3% for AGIs $25k-50k, 17.5% for AGIs $50k-75k, 20.4% for AGIs $75k-100k, 19.2% for AGIs over 100k)
Charity contributions deductions: $2,801 (2% of AGI, reported on 37.4% of returns)
Here:
$2,801
State:
$3,923
Here:
2.3% of AGI
State:
3.3% of AGI
(% of AGI for various income ranges: 1.8% for AGIs below $10k, 1.0% for AGIs $10k-25k, 1.0% for AGIs $25k-50k, 1.6% for AGIs $50k-75k, 1.8% for AGIs $75k-100k, 1.7% for AGIs over 100k)
Total tax: $11,434 (reported on 82.1% of returns)
94061:
$11,434
State:
$10,761
(% of AGI for various income ranges: 8.5% for AGIs below $10k, 5.1% for AGIs $10k-25k, 7.9% for AGIs $25k-50k, 10.7% for AGIs $50k-75k, 11.7% for AGIs $75k-100k, 17.7% for AGIs over 100k)
Earned income credit: $1,463 (reported on 7.7% of returns)
Here:
$1,463
State:
$1,763
Percentage of individuals using paid preparers for their 2004 taxes: 64.2%
Here:
64%
State:
66%
(% for various income ranges: 56.6% for AGIs below $10k, 66.0% for AGIs $10k-25k, 65.6% for AGIs $25k-50k, 64.7% for AGIs $50k-75k, 63.0% for AGIs $75k-100k, 66.2% for AGIs over 100k)
Likely homosexual households (counted as self-reported same-sex unmarried-partner households)
Lesbian couples: 0.3% of all households
Gay men: 0.3% of all households
Household received Food Stamps/SNAP in the past 12 months: 1,138 Household did not receive Food Stamps/SNAP in the past 12 months: 12,148
Women who had a birth in the past 12 months: 601 (560 now married, 38 unmarried) Women who did not have a birth in the past 12 months: 8,545 (4,210 now married, 4,300 unmarried)
Housing units in zip code 94061 with a mortgage: 4,833 (856 second mortgage, 83 home equity loan, 743 both second mortgage and home equity loan) Houses without a mortgage: 49
Median monthly owner costs for units with a mortgage: $3,876 Median monthly owner costs for units without a mortgage: $1,041
Residents with income below the poverty level in 2022:
This zip code:
4.7%
Whole state:
12.2%
Residents with income below 50% of the poverty level in 2022:
This zip code:
2.1%
Whole state:
6.2%
Median number of rooms in houses and condos:
Here:
6.0
State:
6.0
Median number of rooms in apartments:
Here:
3.6
State:
3.9
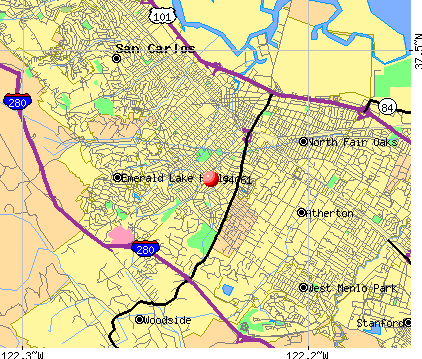
Notable locations in this zip code not listed on our city pages
Notable locations in zip code 94061: Emerald Hills Golf Course (A), Schaberg Branch Redwood City Public Library (B). Display/hide their locations on the map
Shopping Centers: Woodside Central Shopping Center (1), Woodside Plaza Shopping Center (2), Woodside Manor Shopping Center (3), Jefferson Plaza Shopping Center (4). Display/hide their locations on the map
Churches in zip code 94061 include: Peninsula Covenant Church (A), Mount Alverno Convent (B), Woodside Road Methodist Church (C), Temple Beth Jacob (D), Saint Pius Catholic Church (E), Redwood Church (F), Mount Zion Baptist Church (G), Lutheran Church of the Messiah (H), Kingdom Hall of Jehovahs Witnesses (I). Display/hide their locations on the map
Parks in zip code 94061 include: Stulsaft Park (1), Fleishman Park (2), Hawes Park (3), Linden Park (4), Maddux Park (5), Palm Park (6), Red Morton Community Park (7). Display/hide their locations on the map
5,304 married couples with children.
1,176 single-parent households (406 men, 770 women).
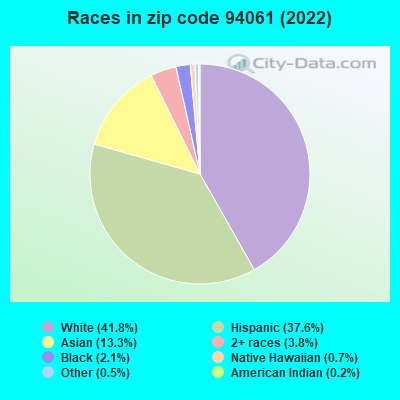
54.4% of residents of 94061 zip code speak English at home.
29.9% of residents speak Spanish at home (64% very well, 15% well, 14% not well, 7% not at all).
6.0% of residents speak other Indo-European language at home (83% very well, 12% well, 5% not well).
9.0% of residents speak Asian or Pacific Island language at home (72% very well, 23% well, 4% not well, 2% not at all).
0.6% of residents speak other language at home (38% very well, 44% well, 17% not well).
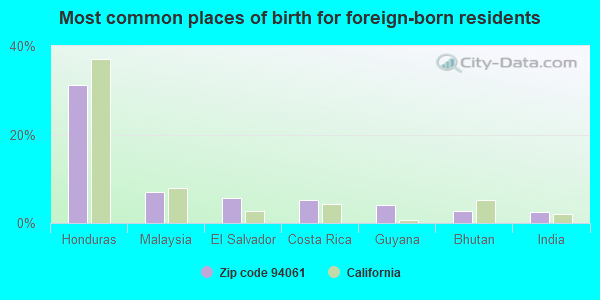
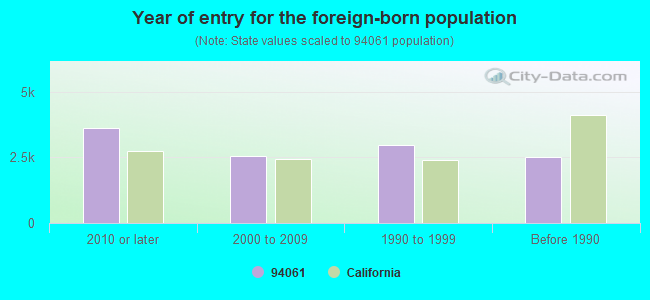
Foreign born population: 10,897 (29.3%) (44.9% of them are naturalized citizens)
Major facilities with environmental interests located in this zip code:
HELENS CLEANERS (1594 WOODSIDE ROAD in REDWOOD CITY, CA)
STATE MASTER (California - Hazardous Waste Tracking) - HAZARDOU WASTE PROGRAM CRITERIA AND HAZARDOUS AIR POLLUTANT INVENTORY (Inventory of air pollution sources) Small Quantity Generators, between 100 kg and 1000 kg of hazardous waste/month (Resource Conservation and Recovery Act (tracking hazardous waste)) Business SIC classification: DRYCLEANING PLANTS, EXCEPT RUG CLEANING
CANADA COLLEGE (4200 FARM HILL BLVD in REDWOOD CITY, CA)
STATE MASTER (California - Hazardous Waste Tracking) - HAZARDOU WASTE PROGRAM Small Quantity Generators, between 100 kg and 1000 kg of hazardous waste/month (Resource Conservation and Recovery Act (tracking hazardous waste)) - notification Organizations: SAN MATEO COUNTY OF (CONTACT/OWNER)
Alternative names: SMCCCD CANADA COLLEGE
CHEVRON STATION 92034 (975 WOODSIDE RD in REDWOOD CITY, CA)
STATE MASTER (California - Hazardous Waste Tracking) - HAZARDOU WASTE PROGRAM Small Quantity Generators, between 100 kg and 1000 kg of hazardous waste/month (Resource Conservation and Recovery Act (tracking hazardous waste)) - notification Organizations: CHEVRON PRODUCTS CO (CONTACT/OWNER)
CHEVRON STATION NO 93591 (710 WOODSIDE RD in REDWOOD CITY, CA)
STATE MASTER (California - Hazardous Waste Tracking) - HAZARDOU WASTE PROGRAM Small Quantity Generators, between 100 kg and 1000 kg of hazardous waste/month (Resource Conservation and Recovery Act (tracking hazardous waste)) - notification Organizations: CHEVRON PRODUCTS CO (CONTACT/OWNER)
ADELANTE SPANISH IMMERSION (ELEM) (3150 GRANGER WAY in REDWOOD CITY, CA)
(National Center for Education Statistics) - STATE ID-6114037 Organizations: REDWOOD CITY ELEMENTARY (SCHOOL DISTRICT)
FORD (HENRY) ELEMENTARY (2498 MASSACHUSETTS AVE. in REDWOOD CITY, CA)
(National Center for Education Statistics) - STATE ID-6044499 Organizations: REDWOOD CITY ELEMENTARY (SCHOOL DISTRICT)
HAWES ELEMENTARY (909 ROOSEVELT AVE. in REDWOOD CITY, CA)
(National Center for Education Statistics) - STATE ID-6044481 Organizations: REDWOOD CITY ELEMENTARY (SCHOOL DISTRICT)
KENNEDY (JOHN F.) MIDDLE (2521 GOODWIN AVE. in REDWOOD CITY, CA)
(National Center for Education Statistics) - STATE ID-6044531 Organizations: REDWOOD CITY ELEMENTARY (SCHOOL DISTRICT)
FASHION CLEANERS (336 WOODSIDE PLAZA in REDWOOD CITY, CA)
CRITERIA AND HAZARDOUS AIR POLLUTANT INVENTORY (Inventory of air pollution sources) Small Quantity Generators, between 100 kg and 1000 kg of hazardous waste/month (Resource Conservation and Recovery Act (tracking hazardous waste)) Business SIC classification: DRYCLEANING PLANTS, EXCEPT RUG CLEANING Organizations: DARRYL FOWN (CONTACT/OWNER)
ENGINES LIMITED (968 WOODSIDE RD in REDWOOD CITY, CA)
Small Quantity Generators, between 100 kg and 1000 kg of hazardous waste/month (Resource Conservation and Recovery Act (tracking hazardous waste)) - notification Organizations: ANITA M ENGELS (CONTACT/OWNER)
LEES CLEANERS (1926 EL CAMINO REAL in REDWOOD CITY, CA)
Small Quantity Generators, between 100 kg and 1000 kg of hazardous waste/month (Resource Conservation and Recovery Act (tracking hazardous waste)) Organizations: LEE BONG (CONTACT/OWNER)
MCNAMARA TRANSPORT INC (1459 ALAMEDA DE LAS PULGAS in REDWOOD CITY, CA)
CAL 1 HOUR PHOTO (615 WOODSIDE RD NO 4 in REDWOOD CITY, CA)
Small Quantity Generators, between 100 kg and 1000 kg of hazardous waste/month (Resource Conservation and Recovery Act (tracking hazardous waste)) - notification Organizations: SUSAN SEO (CONTACT/OWNER)
Housing units lacking complete plumbing facilities: 0.6% Housing units lacking complete kitchen facilities: 0.7%
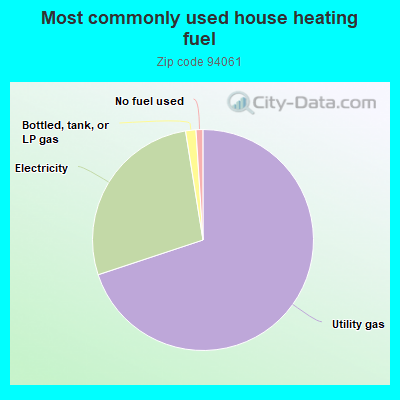
69.5%Utility gas
27.4%Electricity
1.5%Bottled, tank, or LP gas
1.0%No fuel used
Population in 1990: 33,316. Population change in the 1990s: +2,402 (+7.2%).
Place of birth for U.S.-born residents:
This state: 19,585
Northeast: 1,823
Midwest: 1,514
South: 1,802
West: 1,011
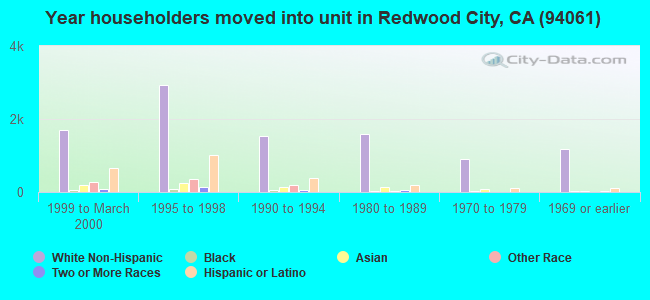
54% of the 94061 zip code residents lived in the same house 5 years ago. Out of people who lived in different houses, 64% lived in this county. Out of people who lived in different counties, 50% lived in California.
88% of the 94061 zip code residents lived in the same house 1 year ago. Out of people who lived in different houses, 35% moved from this county. Out of people who lived in different houses, 39% moved from different county within same state. Out of people who lived in different houses, 19% moved from different state. Out of people who lived in different houses, 9% moved from abroad.
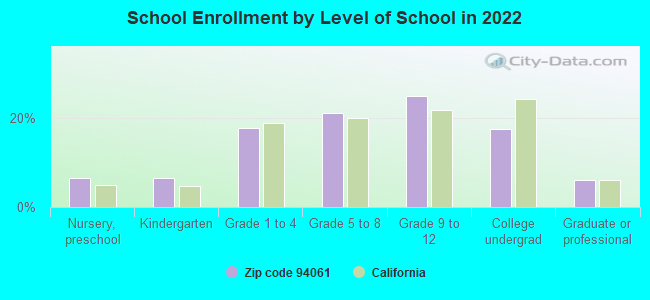
Private vs. public school enrollment:
Students in private schools in grades 1 to 8 (elementary and middle school): 784
Here:
25.1%
California:
10.5%
Students in private schools in grades 9 to 12 (high school): 241
Here:
12.2%
California:
8.5%
Students in private undergraduate colleges: 315
Here:
22.8%
California:
15.9%
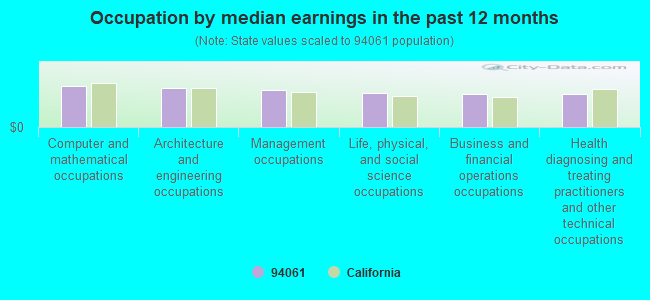
Occupation by median earnings in the past 12 months ($)
147,216Computer and mathematical occupations
141,414Architecture and engineering occupations
134,818Management occupations
123,839Life, physical, and social science occupations
121,070Business and financial operations occupations
118,352Health diagnosing and treating practitioners and other technical occupations
Companies with federal contracts located in this zip code:
CBL TECHNOLOGIES INC (1095 EDEN BOWER WAY in REDWOOD CITY, CA; small business) : $239,345 in 3 contractsfrom 2002 to 2004
$99,599 with Army for Other Research and Development -- Basic Research (R&D). Signed on 2004-07-15. Completion date: 2005-01-31.
$69,924 with Army for Defense Missile and Space Systems -- Advanced Development (R&D). Signed on 2002-09-30. Completion date: 2003-03-26.
$69,822, same as above.Signed on 2002-12-17. Completion date: 2003-06-18.
WAYS OF WELLNESS INC (2395 CARSON STREET in REDWOOD CITY, CA; small business)
$14,717 with Army for Athletic and Sporting Equipment. Signed on 2004-04-29. Completion date: 2004-06-04.
SCBA SAFETY CHECK INC (1807 BARTON ST in REDWOOD CITY, CA; small business) : $8,049 in 2 contractsin 2004
$8,289 with Army for Sets, Kits, and Outfits of Hand Tools. Signed on 2004-05-20. Completion date: 2004-06-25.
-$240 with Defense Logistics Agency for Other Education and Training Services. Signed on 2004-10-01. Completion date: 2004-10-30.
Top industries in this zip code by the number of employees in 2005:
2005 - 2018 National Fire Incident Reporting System (NFIRS) incidents
According to the data from the years 2005 - 2018 the average number of fire incidents per year is 54. The highest number of fire incidents - 76 took place in 2009, and the least - 21 in 2013. The data has a decreasing trend.
When looking into fire subcategories, the most incidents belonged to: Structure Fires (51.8%), and Outside Fires (24.7%).
Fire incident types reported to NFIRS in Zip Code 94061


 Nearest zip codes: 94027, 94070, 94063, 94025, 94065, 94305.
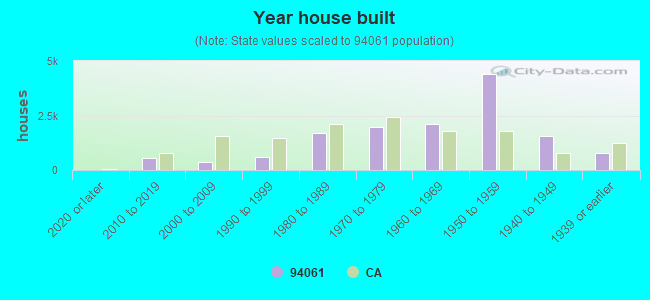


 According to the data from the years 2005 - 2018 the average number of fire incidents per year is 54. The highest number of fire incidents - 76 took place in 2009, and the least - 21 in 2013. The data has a decreasing trend.
 When looking into fire subcategories, the most incidents belonged to: Structure Fires (51.8%), and Outside Fires (24.7%).