Kentfield Commons (Kentfield) neighborhood in Redwood City, California (CA), 94061 detailed profile
Settings
X

Business Search - 14 Million verified businesses
Area: 0.073 square miles
Population: 585
Population density:
| Kentfield Commons (Kentfield): | 7,994 people per square mile |
| Redwood City: | 4,134 people per square mile |

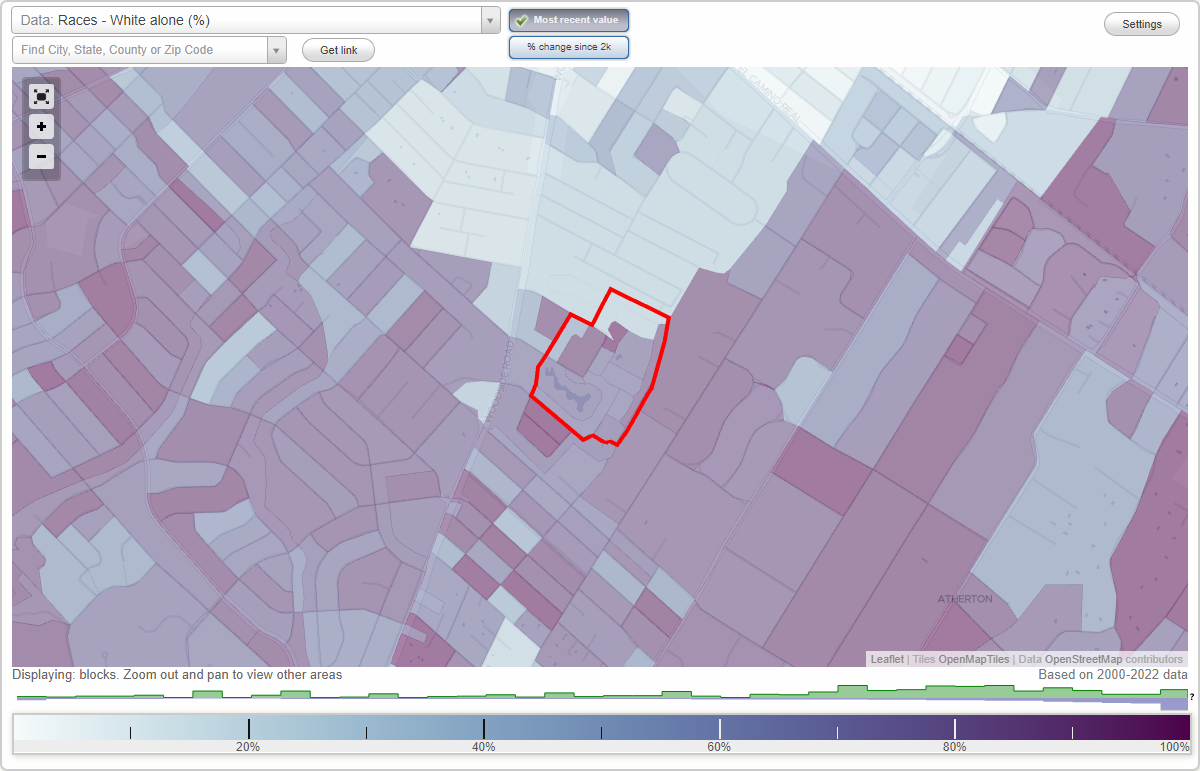
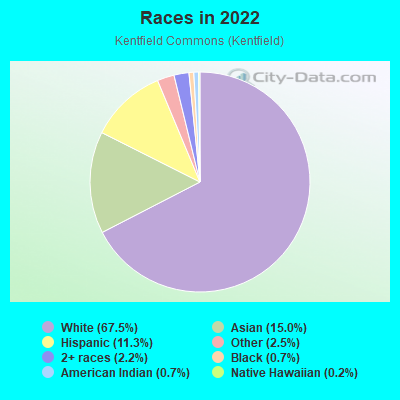
- 40567.5%White
- 9015.0%Asian
- 6811.3%Hispanic or Latino
- 152.5%Some other race
- 132.2%Two or more races
- 40.7%Black
- 40.7%American Indian
- 10.2%Native Hawaiian and Other
Pacific Islander
Distribution of median household income
![Distribution of median household income]()
- 7Less than $10,000
- 7$10,000 to $19,999
- 13$20,000 to $29,999
- 14$30,000 to $39,999
- 29$40,000 to $49,999
- 7$50,000 to $59,999
- 19$60,000 to $74,999
- 17$75,000 to $99,999
- 26$100,000 to $124,999
- 21$125,000 to $149,999
- 15$150,000 to $199,999
- 116$200,000 or more

Distribution of owner-occupied house/condo value
![Distribution of owner-occupied house/condo value]()
- 2Less than $50,000
- 8$150,000 to $199,999
- 1$400,000 to $499,999
- 3$500,000 to $749,999
- 13$750,000 to $999,999
- 177$1,000,000 or more

Distribution of rent paid by renters
![Distribution of rent paid by renters]()
- 1Less than $100
- 4$200 to $299
- 3$1,000 to $1,249
- 3$1,250 to $1,499
- 3$1,500 to $1,999
- 75$2,000 or more

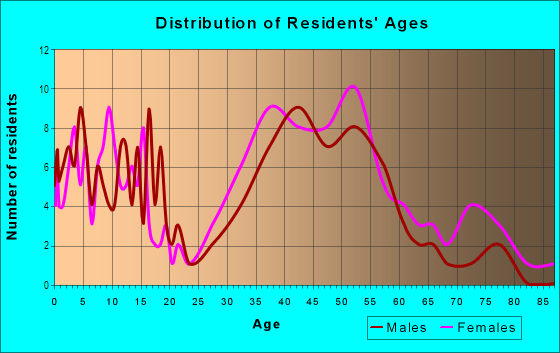
| Males: | 291 |
| Females: | 294 |
Males:
| This neighborhood: | 39.4 years |
| Whole city: | 34.0 years |
| This neighborhood: | 58.4 years |
| Whole city: | 37.5 years |
Average household size:
| Kentfield Commons (Kentfield): | 3.1 people |
| Redwood City: | 2.6 people |
Percentage of family households:
| Kentfield Commons (Kentfield): | 42.7% |
| Redwood City: | 48.9% |
| Here: | 46.4% |
| Redwood City: | 49.5% |
Percentage of married-couple families with children (among all households):
| Kentfield Commons (Kentfield): | 31.2% |
| Redwood City: | 30.8% |
Percentage of single-mother households (among all households):
| Kentfield Commons (Kentfield): | 14.0% |
| Redwood City: | 5.0% |
Percentage of never married males 15 years old and over:
Percentage of never married females 15 years old and over:
| Kentfield Commons (Kentfield): | 19.9% |
| Redwood City: | 20.9% |
Percentage of never married females 15 years old and over:
| Kentfield Commons (Kentfield): | 12.3% |
| city: | 15.9% |
Percentage of people that speak English not well or not at all:
| Kentfield Commons (Kentfield): | 1.4% |
| Redwood City: | 7.0% |
Percentage of people born in this state:
Percentage of people born in another U.S. state:
Percentage of native residents but born outside the U.S.:
Percentage of foreign born residents:
| Here: | 49.4% |
| Redwood City: | 50.0% |
Percentage of people born in another U.S. state:
| Kentfield Commons (Kentfield): | 24.4% |
| Redwood City: | 16.0% |
Percentage of native residents but born outside the U.S.:
| Here: | 1.6% |
| city: | 2.1% |
Percentage of foreign born residents:
| Here: | 24.6% |
| Redwood City: | 31.9% |
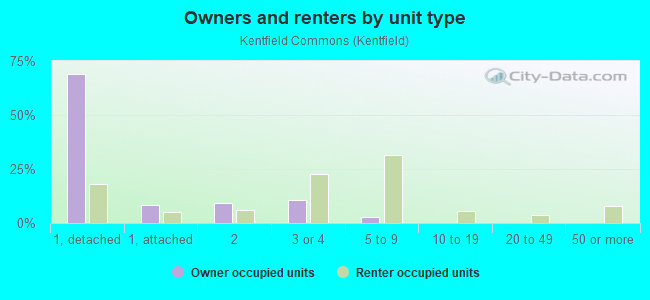
Owner-occupied
Renter-occupied

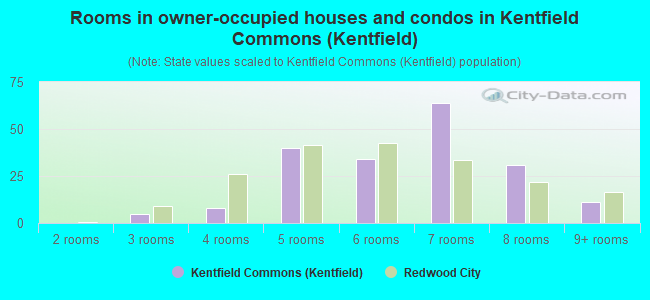
- Rooms in owner-occupied houses and condos in Kentfield Commons <
> - 01 room
- 02 rooms
- 53 rooms
- 84 rooms
- 405 rooms
- 346 rooms
- 647 rooms
- 318 rooms
- 119+ rooms
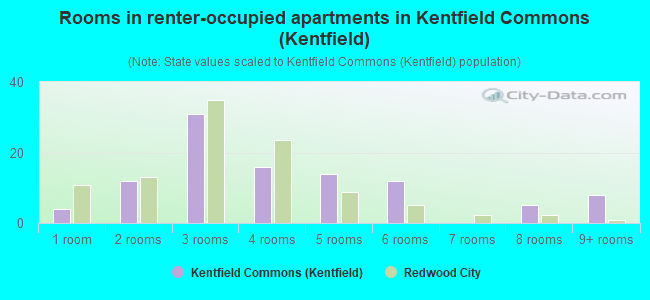
- Rooms in renter-occupied apartments in Kentfield Commons <
> - 41 room
- 122 rooms
- 313 rooms
- 164 rooms
- 145 rooms
- 126 rooms
- 07 rooms
- 58 rooms
- 89+ rooms
Owner-occupied
Renter-occupied
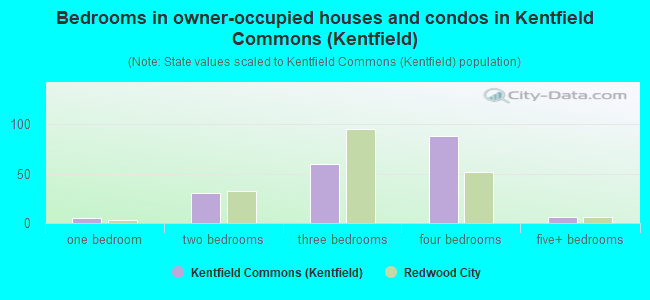
- Bedrooms in owner-occupied houses and condos in Kentfield Commons <
> - 0no bedroom
- 51 bedroom
- 302 bedrooms
- 603 bedrooms
- 884 bedrooms
- 65+ bedrooms
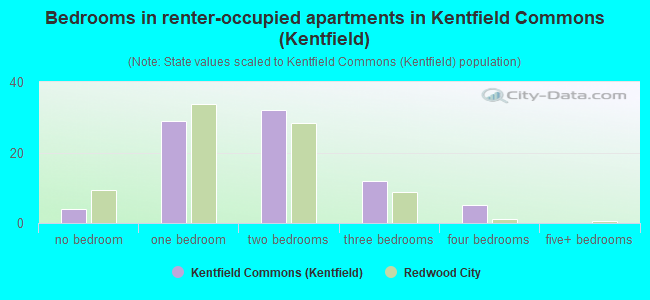
- Bedrooms in renter-occupied apartments in Kentfield Commons <
> - 4no bedroom
- 291 bedroom
- 322 bedrooms
- 123 bedrooms
- 54 bedrooms
- 05+ bedrooms
Average number of cars or other vehicles available in houses/condos:
Average number of cars or other vehicles available in apartments:
| This neighborhood: | 2.1 |
| Redwood City: | 2.1 |
Average number of cars or other vehicles available in apartments:
| Here: | 1.6 |
| city: | 1.5 |
Percentage of units with a mortgage:
| Kentfield Commons (Kentfield): | 64.7% |
| Redwood City: | 71.1% |
Housing prices:
- Average estimated value of detached houses in 2022 (62.3% of all units):
Kentfield Commons (Kentfield): $11,154,058 California: $988,808
- Average estimated value of townhouses or other attached units in 2022 (7.5% of all units):
This neighborhood: $1,812,310 California: $838,546
- Average estimated value of housing units in 2-unit structures in 2022 (1.9% of all units):
This neighborhood: $1,607,198 California: $1,138,100
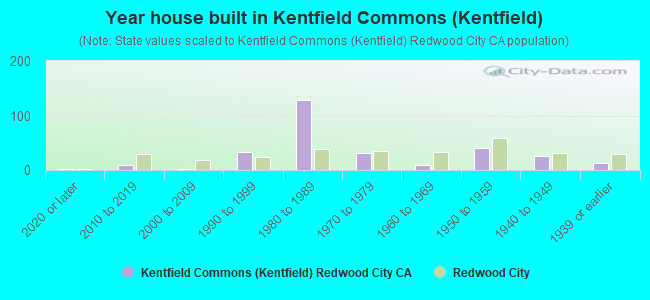
- Year house built in Kentfield Commons <
> - 22020 or later
- 92010 to 2019
- 12000 to 2009
- 331990 to 1999
- 1291980 to 1989
- 321970 to 1979
- 101960 to 1969
- 401950 to 1959
- 251940 to 1949
- 131939 or earlier
City-data.com crime index for city in 2020 (higher means more crime):
| City: | 167.5 |
| U.S. average: | 219.5 |
Travel time to work (commute)
![Travel time to work (commute)]()
- 5Less than 5 minutes
- 95 to 9 minutes
- 1910 to 14 minutes
- 3515 to 19 minutes
- 5420 to 24 minutes
- 2125 to 29 minutes
- 3830 to 34 minutes
- 435 to 39 minutes
- 640 to 44 minutes
- 2345 to 59 minutes
- 660 to 89 minutes
- 290 or more minutes

Means of transportation to work
![Means of transportation to work]()
- 63.4%185Drove a car alone
- 4.8%14Carpooled
- 4.5%13Taxi
- 0.3%1Motorcycle
- 1.7%5Bicycle
- 0.7%2Walked
- 1.0%3Other means
- 26.0%76Worked at home

Time leaving home to go to work
![Time leaving home to go to work]()
- 412:00 a.m. to 4:59 a.m.
- 45:30 a.m. to 5:59 a.m.
- 86:00 a.m. to 6:29 a.m.
- 106:30 a.m. to 6:59 a.m.
- 287:00 a.m. to 7:29 a.m.
- 267:30 a.m. to 7:59 a.m.
- 478:00 a.m. to 8:29 a.m.
- 218:30 a.m. to 8:59 a.m.
- 349:00 a.m. to 9:59 a.m.
- 1010:00 a.m. to 10:59 a.m.
- 311:00 a.m. to 11:59 a.m.
- 712:00 p.m. to 3:59 p.m.
- 144:00 p.m. to 11:59 p.m.

Occupations of males:
- Percentage of males in management occupations (except farmers):
Here: 8.2% city: 16.8%
- Percentage of males in business and financial operations occupations:
Here: 10.5% city: 5.3%
- Percentage of males in computer and mathematical occupations:
Here: 19.3% city: 12.5%
- Percentage of males in architecture and engineering occupations:
Here: 2.9% city: 5.7%
- Percentage of males in life, physical, and social science occupations:
Here: 4.3% city: 3.9%
- Percentage of males in education, training, and library occupations:
Here: 7.1% city: 3.3%
- Percentage of males in arts, design, entertainment, sports, and media occupations:
Here: 6.1% city: 2.7%
- Percentage of males in service occupations:
Here: 16.0% city: 13.8%
- Percentage of males in sales and office occupations:
Here: 17.9% city: 10.3%
- Percentage of males in construction, extraction, and maintenance occupations:
Here: 3.9% city: 9.2%
- Percentage of males in transportation occupations:
Here: 1.7% city: 3.3%
- Percentage of males in material moving occupations:
Here: 3.0% city: 3.3%
Occupations of females:
- Percentage of females in management occupations (except farmers):
Here: 23.7% city: 15.2%
- Percentage of females in business and financial operations occupations:
Here: 3.3% city: 7.3%
- Percentage of females in computer and mathematical occupations:
Here: 6.4% city: 5.3%
- Percentage of females in life, physical, and social science occupations:
Here: 3.2% city: 4.4%
- Percentage of females in community and social services occupations:
Here: 1.3% city: 1.4%
- Percentage of females in legal occupations:
Here: 6.3% city: 2.3%
- Percentage of females in education, training, and library occupations:
Here: 6.3% city: 9.3%
- Percentage of females in arts, design, entertainment, sports, and media occupations:
Here: 2.3% city: 2.9%
- Percentage of females in healthcare practitioners and technical occupations:
Here: 16.9% city: 7.4%
- Percentage of females in service occupations:
Here: 12.5% city: 17.8%
- Percentage of females in sales and office occupations:
Here: 22.2% city: 20.9%
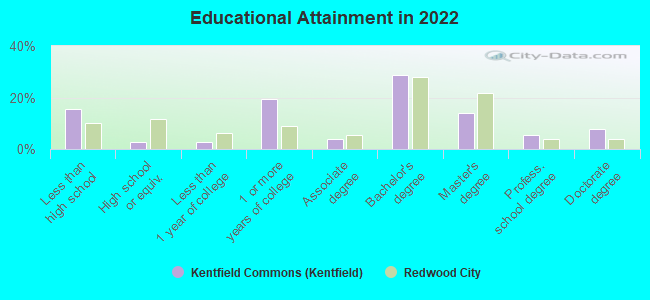
Education in this neighborhood (subdivision or community):
- Percentage of people 3 years and older in K-12 schools:
Kentfield Commons (Kentfield): 11.1% Redwood City: 16.6%
- Percentage of people 3 years and older in undergraduate colleges:
Kentfield Commons (Kentfield): 2.3% Redwood City: 5.1%
- Percentage of people 3 years and older in grad. or professional schools:
Kentfield Commons (Kentfield): 3.9% Redwood City: 2.0%
- Percentage of students K-12 enrolled in private schools:
Kentfield Commons (Kentfield): 69.8% Redwood City: 23.2%
Percentage of population below poverty level:
| Kentfield Commons (Kentfield): | 4.7% |
| Redwood City: | 6.2% |
Median year renter moved in (as recorded in 2022):
| Kentfield Commons (Kentfield): | 2010 |
| Redwood City: | 2020 |
Percentage of married-couple families with both working:
| Kentfield Commons (Kentfield): | 123.1% |
| Redwood City: | 67.4% |
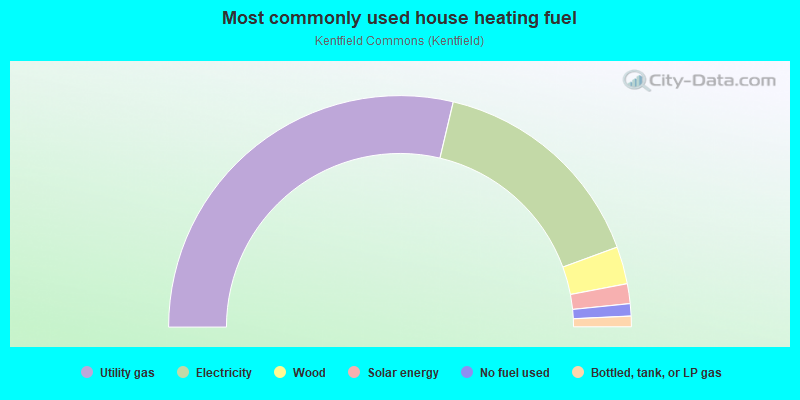
- 57.4%Utility gas
- 31.4%Electricity
- 5.2%Wood
- 2.8%Solar energy
- 1.7%No fuel used
- 1.5%Bottled, tank, or LP gas
Roads and streets:
Chelsea Way
Length: 0.39 miles
Directions: E-W, N-S, SE-NW, SW-NE
Address range: 100 to 2098
Directions: E-W, N-S, SE-NW, SW-NE
Address range: 100 to 2098
Whitehall Ln
Length: 0.29 miles
Directions: E-W, N-S, SE-NW, SW-NE
Address range: 801 to 1099
Directions: E-W, N-S, SE-NW, SW-NE
Address range: 801 to 1099
Kentfield Ave
Length: 0.21 miles
Directions: E-W, N-S, SE-NW, SW-NE
Address range: 1878 to 1999
Directions: E-W, N-S, SE-NW, SW-NE
Address range: 1878 to 1999
Sheffield Ln
Length: 0.15 miles
Directions: E-W, N-S, SE-NW
Address range: 200 to 299
Directions: E-W, N-S, SE-NW
Address range: 200 to 299
Newcastle Dr
Length: 0.15 miles
Directions: E-W, SE-NW, SW-NE
Address range: 300 to 399
Directions: E-W, SE-NW, SW-NE
Address range: 300 to 399
Yarborough Ln
Length: 0.14 miles
Directions: E-W, SE-NW
Address range: 200 to 299
Directions: E-W, SE-NW
Address range: 200 to 299
Knightsbridge Ln
Length: 0.14 miles
Directions: N-S, SW-NE
Address range: 916 to 930
Directions: N-S, SW-NE
Address range: 916 to 930
Kingsford Ln
Length: 0.12 miles
Directions: E-W, SE-NW
Address range: 200 to 299
Directions: E-W, SE-NW
Address range: 200 to 299
Brighton Ln
Length: 0.11 miles
Directions: E-W, SE-NW
Address range: 200 to 299
Directions: E-W, SE-NW
Address range: 200 to 299
Chatsworth Ln
Length: 0.10 miles
Directions: E-W, N-S, SE-NW, SW-NE
Address range: 800 to 999
Directions: E-W, N-S, SE-NW, SW-NE
Address range: 800 to 999
Wembley Ct
Length: 0.07 miles
Direction: SE-NW
Address range: 400 to 499
Direction: SE-NW
Address range: 400 to 499
Gregory Ln
Length: 0.07 miles
Directions: E-W, N-S, SE-NW, SW-NE
Address range: 232 to 1019
Directions: E-W, N-S, SE-NW, SW-NE
Address range: 232 to 1019
Horgan Ave
Length: 0.05 miles
Directions: E-W, N-S, SE-NW
Address range: 67 to 99
Directions: E-W, N-S, SE-NW
Address range: 67 to 99
Cardiff Ln
Length: 0.05 miles
Direction: SW-NE
Address range: 1000 to 1018
Direction: SW-NE
Address range: 1000 to 1018
Newcastle Ct
Length: 0.05 miles
Direction: SE-NW
Address range: 200 to 299
Direction: SE-NW
Address range: 200 to 299
Atherwood Ave
Length: 0.03 miles
Direction: SW-NE
Direction: SW-NE