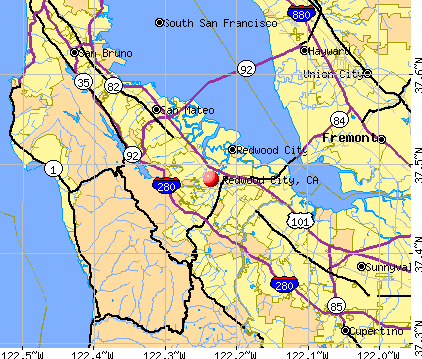
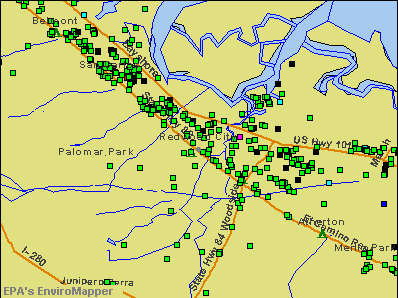
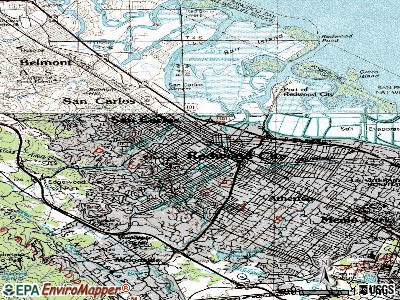
Redwood City, California
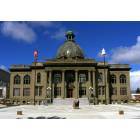
Redwood City: San Mateo County History Museum (formerly the old San Mateo County Courthouse)
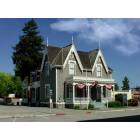
Redwood City: The Lathrop House (627 Hamilton Street)
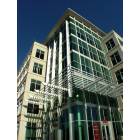
Redwood City: San Mateo County Office Building (555 County Center)
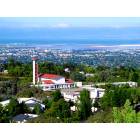
Redwood City: From a parking lot at Canada College - looking east towards San Francisco Bay
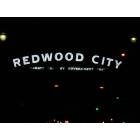
Redwood City: Redwood City Sign on Broadway Street
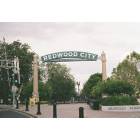
Redwood City: Redwood City Gateway sign
Redwood City: Gateway to downtown Redwood City
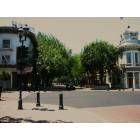
Redwood City: @Broadway&Main
- add
your
Submit your own pictures of this city and show them to the world
- OSM Map
- General Map
- Google Map
- MSN Map
Population change since 2000: +6.8%
 |
| Males: 41,075 | |
| Females: 39,437 |
| Median resident age: | 36.1 years |
| California median age: | 37.9 years |
Zip codes: 94065.
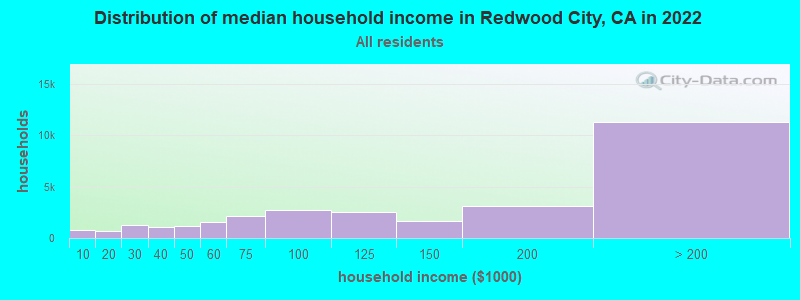
| Redwood City: | $137,512 |
| CA: | $91,551 |
Estimated per capita income in 2022: $79,509 (it was $34,042 in 2000)
Redwood City city income, earnings, and wages data
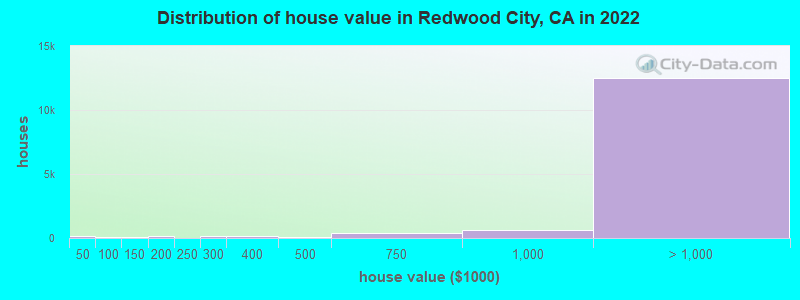
Estimated median house or condo value in 2022: over $1,000,000 (it was $487,600 in 2000)
| Redwood City: | over $1,000,000 |
| CA: | $715,900 |
Mean prices in 2022: all housing units: over $1,000,000; detached houses: over $1,000,000; townhouses or other attached units: over $1,000,000; in 2-unit structures: over $1,000,000; in 3-to-4-unit structures: over $1,000,000; in 5-or-more-unit structures: over $1,000,000; mobile homes: $344,470
Median gross rent in 2022: $2,645.
(5.3% for White Non-Hispanic residents, 8.4% for Black residents, 9.0% for Hispanic or Latino residents, 7.4% for American Indian residents, 1.7% for Native Hawaiian and other Pacific Islander residents, 9.1% for other race residents, 5.4% for two or more races residents)
Detailed information about poverty and poor residents in Redwood City, CA


Compare current foreclosures near Redwood City, CA:
| Photo | Address | Area | Beds / Baths | Price | Details |
|---|---|---|---|---|---|

|
#1
Alameda De Las Pulgas
Redwood City, CA 94061
|
1,250 sq. feet
|
2 baths 3 beds |
show details | |

|
#2
Hempstead Pl
Redwood City, CA 94061
|
1,020 sq. feet
|
1 baths 3 beds |
show details | |

|
#3
Bay Rd
Redwood City, CA 94063
|
1,400 sq. feet
|
2 baths 3 beds |
show details | |

|
#4
Patrol Rd
Redwood City, CA 94062
|
2,740 sq. feet
|
3 baths 4 beds |
show details | |

|
#5
Alameda De Las Pulgas
Redwood City, CA 94061
|
1,250 sq. feet
|
2 baths 3 beds |
show details | |

|
#6
Devon Way
Redwood City, CA 94061
|
1,420 sq. feet
|
1 baths 3 beds |
show details | |

|
#7
Devon Way
Redwood City, CA 94061
|
1,420 sq. feet
|
1 baths 3 beds |
show details | |

|
#8
Hempstead Pl
Redwood City, CA 94061
|
1,020 sq. feet
|
1 baths 3 beds |
show details | |

|
#9
Valota Rd
Redwood City, CA 94061
|
950 sq. feet
|
1 baths 2 beds |
show details | |

|
#10
Hoover St
Redwood City, CA 94063
|
1,250 sq. feet
|
1 baths 3 beds |
show details |
| Photo | Address | Area | Beds / Baths | Price | Details |
|---|---|---|---|---|---|

|
#11
Avocet Dr Apt 7309
Redwood City, CA 94065
|
- sq. feet
|
- baths - beds |
show details | |

|
#12
Demi Ln
Redwood City, CA 94065
|
- sq. feet
|
- baths - beds |
show details | |

|
#13
Regent St # A
Redwood City, CA 94061
|
- sq. feet
|
- baths - beds |
show details | |

|
#14
Milton St
Redwood City, CA 94061
|
- sq. feet
|
- baths - beds |
show details | |

|
#15
Maple St Apt 1304
Redwood City, CA 94063
|
- sq. feet
|
- baths - beds |
show details | |

|
#16
Nueva Ave
Redwood City, CA 94061
|
- sq. feet
|
- baths - beds |
show details | |

|
#17
Oxford St Apt 10
Redwood City, CA 94061
|
- sq. feet
|
- baths - beds |
show details | |

|
#18
Redwood Shores Pkwy # 828
Redwood City, CA 94065
|
- sq. feet
|
- baths - beds |
show details | |

|
#19
Spring St Ste D
Redwood City, CA 94063
|
- sq. feet
|
- baths - beds |
show details | |

|
#20
Valota Rd
Redwood City, CA 94061
|
- sq. feet
|
- baths - beds |
show details |
| Photo | Address | Area | Beds / Baths | Price | Details |
|---|---|---|---|---|---|

|
#21
Middlefield Rd Apt 23
Redwood City, CA 94063
|
- sq. feet
|
- baths - beds |
show details | |

|
#22
Veterans Blvd Unit 483
Redwood City, CA 94063
|
- sq. feet
|
- baths - beds |
show details | |

|
#23
Cardinal Way # 3
Redwood City, CA 94063
|
- sq. feet
|
- baths - beds |
show details | |

|
#24
E Bayshore Rd Spc 452
Redwood City, CA 94063
|
1,456 sq. feet
|
- baths - beds |
show details | |

|
#25
Woodside Rd Ste 195
Redwood City, CA 94061
|
- sq. feet
|
- baths - beds |
show details | |

|
#26
Central Ave
Redwood City, CA 94061
|
- sq. feet
|
- baths - beds |
show details | |

|
#27
Regent St
Redwood City, CA 94061
|
- sq. feet
|
- baths - beds |
show details | |

|
#28
Wickman Pl
San Lorenzo, CA 94580
|
900 sq. feet
|
1 baths 2 beds |
show details | |

|
#29
Tribune Ave
Hayward, CA 94542
|
2,234 sq. feet
|
2 baths 4 beds |
show details | |

|
#30
Begonia Dr
San Leandro, CA 94578
|
2,741 sq. feet
|
3 baths 5 beds |
show details |
| Photo | Address | Area | Beds / Baths | Price | Details |
|---|---|---|---|---|---|

|
#31
Fleetwood Dr
San Bruno, CA 94066
|
1,440 sq. feet
|
3 baths 5 beds |
show details | |

|
#32
Toyonita Rd
Los Altos, CA 94024
|
4,833 sq. feet
|
3 baths 5 beds |
show details | |

|
#33
3rd St
Hayward, CA 94541
|
1,324 sq. feet
|
1 baths 2 beds |
show details | |

|
#34
Middlefield Ave
Fremont, CA 94539
|
3,624 sq. feet
|
2 baths 3 beds |
show details | |

|
#35
Marcella St
San Leandro, CA 94578
|
1,426 sq. feet
|
1 baths 3 beds |
show details | |

|
#36
Mulberry St
Newark, CA 94560
|
984 sq. feet
|
1 baths 3 beds |
show details | |

|
#37
Dewey Pl
Fremont, CA 94538
|
1,232 sq. feet
|
2 baths 3 beds |
show details | |

|
#38
Saratoga Ave
Palo Alto, CA 94303
|
750 sq. feet
|
1 baths 3 beds |
show details | |

|
#39
S Humboldt St
San Mateo, CA 94401
|
1,290 sq. feet
|
2 baths 3 beds |
show details | |

|
#40
Mirada Rd
Half Moon Bay, CA 94019
|
2,450 sq. feet
|
4 baths 4 beds |
show details |
| Photo | Address | Area | Beds / Baths | Price | Details |
|---|---|---|---|---|---|

|
#41
Cavanaugh St
San Mateo, CA 94401
|
- sq. feet
|
1 baths 2 beds |
show details | |

|
#42
Lorenzo Ave
San Lorenzo, CA 94580
|
1,937 sq. feet
|
1 baths 3 beds |
show details | |

|
#43
Acapulco Rd
San Leandro, CA 94577
|
1,196 sq. feet
|
2 baths 3 beds |
show details | |

|
#44
Lorenzo Ave
San Lorenzo, CA 94580
|
2,037 sq. feet
|
2 baths 2 beds |
show details | |

|
#45
Chestnut St
San Carlos, CA 94070
|
1,390 sq. feet
|
2 baths 3 beds |
show details | |

|
#46
Joyce St
Hayward, CA 94544
|
1,000 sq. feet
|
1 baths 3 beds |
show details | |

|
#47
Cymbidium Cir
South San Francisco, CA 94080
|
1,610 sq. feet
|
2 baths 3 beds |
show details | |

|
#48
Endicott St
San Leandro, CA 94579
|
1,164 sq. feet
|
1 baths 2 beds |
show details | |

|
#49
7th Ave
Menlo Park, CA 94025
|
1,689 sq. feet
|
2 baths 3 beds |
show details | |

|
Check over 1 million property listings on Foreclosure.com!
|
browse all offers | |||


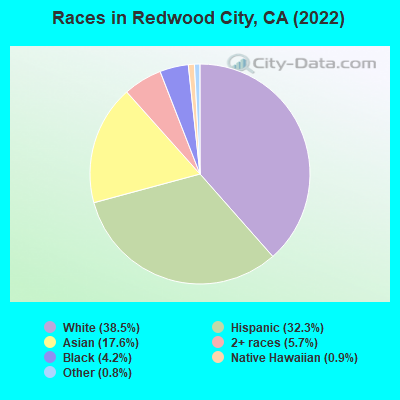
- 30,98538.5%White alone
- 25,99432.3%Hispanic
- 14,13317.6%Asian alone
- 4,5815.7%Two or more races
- 3,4164.2%Black alone
- 6850.9%Native Hawaiian and Other
Pacific Islander alone - 6790.8%Other race alone
- 560.07%American Indian alone
According to our research of California and other state lists, there were 121 registered sex offenders living in Redwood City, California as of April 27, 2024.
The ratio of all residents to sex offenders in Redwood City is 702 to 1.
The ratio of registered sex offenders to all residents in this city is near the state average.
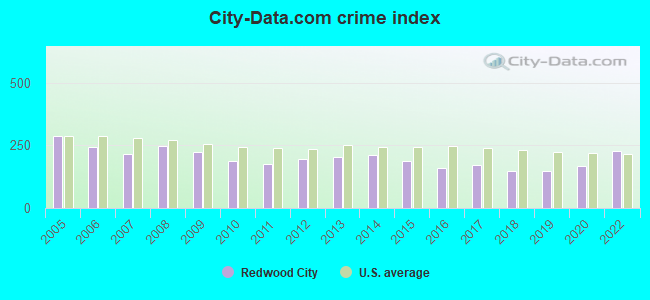
The City-Data.com crime index weighs serious crimes and violent crimes more heavily. Higher means more crime, U.S. average is 246.1. It adjusts for the number of visitors and daily workers commuting into cities.
- means the value is smaller than the state average.- means the value is about the same as the state average.
- means the value is bigger than the state average.
- means the value is much bigger than the state average.
Crime rate in Redwood City detailed stats: murders, rapes, robberies, assaults, burglaries, thefts, arson
Full-time law enforcement employees in 2021, including police officers: 115 (83 officers - 75 male; 8 female).
| Officers per 1,000 residents here: | 0.97 |
| California average: | 2.30 |
 Recent articles from our blog. Our writers, many of them Ph.D. graduates or candidates, create easy-to-read articles on a wide variety of topics.

 | Why is fremont so much cheaper than Redwood City? (96 replies) |
| Commute east bay & tri-valley to Redwood City (16 replies) |
| Redwood city vs Salt Lake City (8 replies) |
| Redwood City, CA Safety Concerns (0 replies) |
| Redwood City to East Bay Bridges best access? (5 replies) |
| Redwood City neighborhoods? (12 replies) |
Latest news from Redwood City, CA collected exclusively by city-data.com from local newspapers, TV, and radio stations
Ancestries: American (4.9%), Italian (2.8%), English (2.7%), Irish (2.5%), German (2.3%), European (2.1%).
Current Local Time: PST time zone
Elevation: 15 feet
Land area: 19.5 square miles.
Population density: 4,134 people per square mile (average).
26,646 residents are foreign born (15.2% Latin America, 11.1% Asia, 4.2% Europe).
| This city: | 33.2% |
| California: | 26.5% |
Median real estate property taxes paid for housing units with mortgages in 2022: $10,001 (0.5%)
Median real estate property taxes paid for housing units with no mortgage in 2022: $6,319 (0.4%)
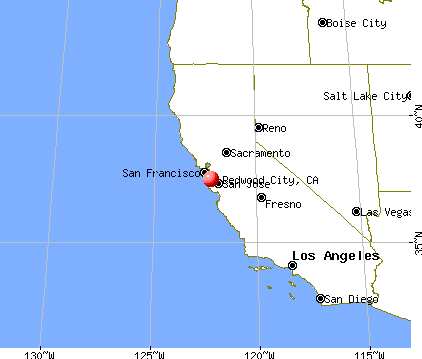
Nearest city with pop. 200,000+: Fremont, CA  (14.5 miles , pop. 203,413).
Nearest city with pop. 1,000,000+: Los Angeles, CA (319.5 miles , pop. 3,694,820).
Nearest cities:
), ), ), Latitude: 37.48 N, Longitude: 122.24 W
Daytime population change due to commuting: +8,939 (+11.1%)
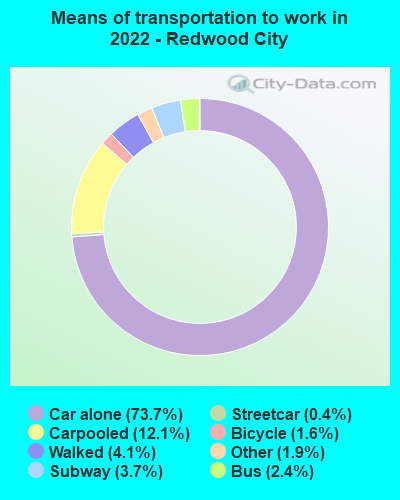
Workers who live and work in this city: 18,530 (44.9%)
Area code: 650
Property values in Redwood City, CA
Redwood City, California accommodation & food services, waste management - Economy and Business Data
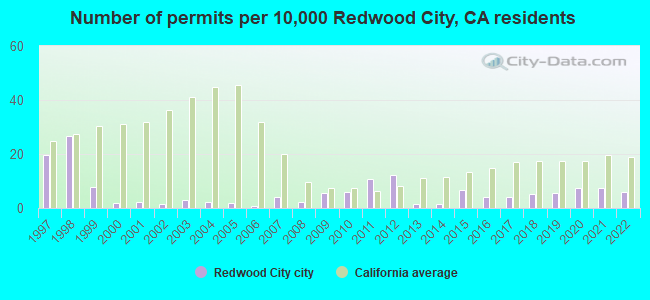
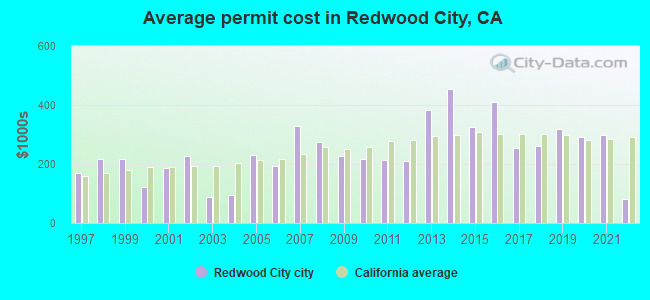
Single-family new house construction building permits:
- 2022: 44 buildings, average cost: $79,900
- 2021: 56 buildings, average cost: $297,600
- 2020: 55 buildings, average cost: $291,100
- 2019: 41 buildings, average cost: $319,200
- 2018: 40 buildings, average cost: $260,600
- 2017: 32 buildings, average cost: $254,100
- 2016: 32 buildings, average cost: $409,600
- 2015: 51 buildings, average cost: $323,800
- 2014: 10 buildings, average cost: $454,800
- 2013: 10 buildings, average cost: $382,000
- 2012: 93 buildings, average cost: $210,600
- 2011: 82 buildings, average cost: $212,600
- 2010: 46 buildings, average cost: $217,400
- 2009: 41 buildings, average cost: $226,600
- 2008: 17 buildings, average cost: $275,900
- 2007: 30 buildings, average cost: $328,200
- 2006: 6 buildings, average cost: $194,000
- 2005: 14 buildings, average cost: $230,200
- 2004: 16 buildings, average cost: $94,300
- 2003: 22 buildings, average cost: $89,000
- 2002: 11 buildings, average cost: $227,800
- 2001: 18 buildings, average cost: $184,600
- 2000: 14 buildings, average cost: $121,200
- 1999: 59 buildings, average cost: $218,200
- 1998: 200 buildings, average cost: $216,500
- 1997: 147 buildings, average cost: $170,500
| Here: | 3.1% |
| California: | 5.1% |
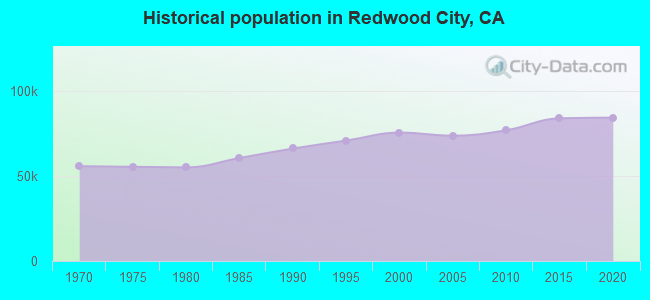
Population change in the 1990s: +9,233 (+14.0%).
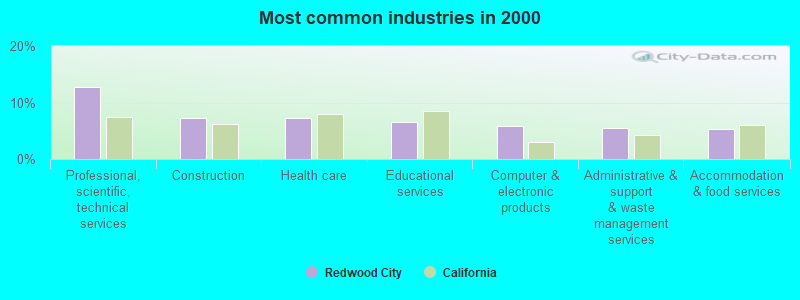
- Professional, scientific, technical services (12.8%)
- Construction (7.2%)
- Health care (7.2%)
- Educational services (6.6%)
- Computer & electronic products (5.9%)
- Administrative & support & waste management services (5.4%)
- Accommodation & food services (5.4%)
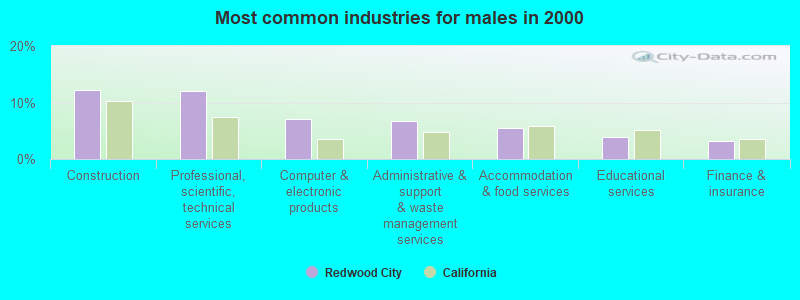
- Construction (12.2%)
- Professional, scientific, technical services (12.1%)
- Computer & electronic products (7.1%)
- Administrative & support & waste management services (6.7%)
- Accommodation & food services (5.5%)
- Educational services (3.8%)
- Finance & insurance (3.3%)
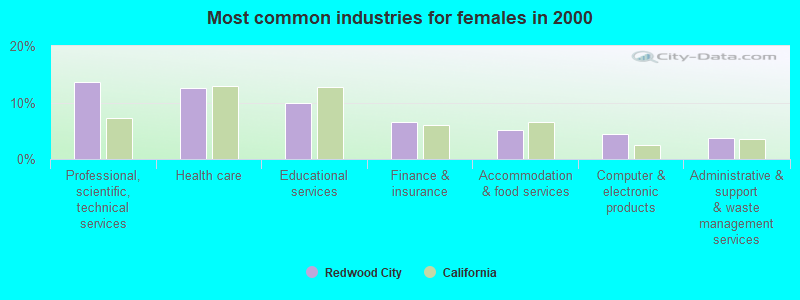
- Professional, scientific, technical services (13.7%)
- Health care (12.6%)
- Educational services (10.0%)
- Finance & insurance (6.6%)
- Accommodation & food services (5.1%)
- Computer & electronic products (4.5%)
- Administrative & support & waste management services (3.8%)
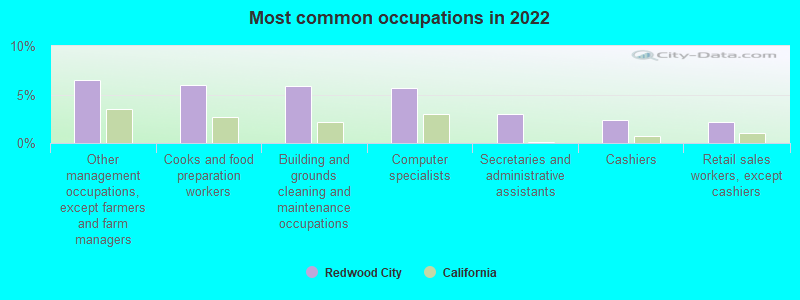
- Other management occupations, except farmers and farm managers (6.5%)
- Cooks and food preparation workers (6.0%)
- Building and grounds cleaning and maintenance occupations (5.9%)
- Computer specialists (5.6%)
- Secretaries and administrative assistants (3.0%)
- Cashiers (2.4%)
- Retail sales workers, except cashiers (2.1%)
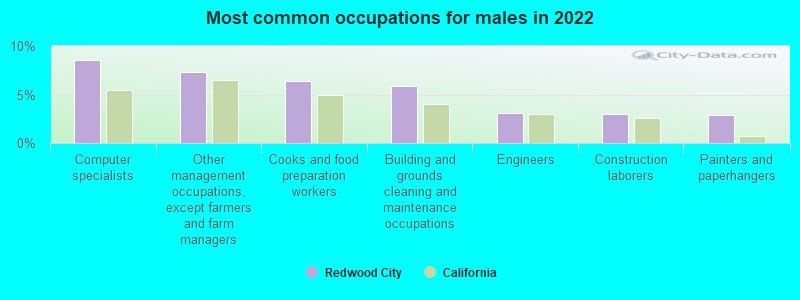
- Computer specialists (8.5%)
- Other management occupations, except farmers and farm managers (7.4%)
- Cooks and food preparation workers (6.4%)
- Building and grounds cleaning and maintenance occupations (5.9%)
- Engineers (3.1%)
- Construction laborers (3.0%)
- Painters and paperhangers (2.9%)
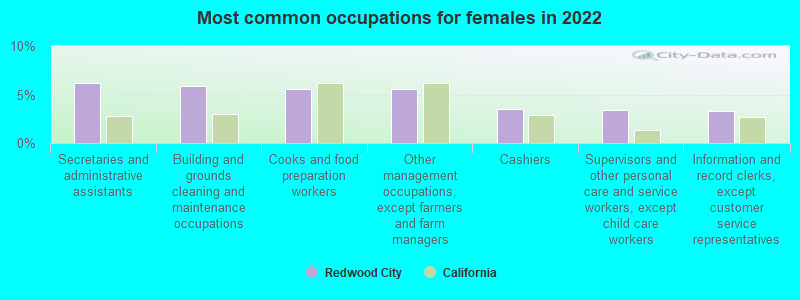
- Secretaries and administrative assistants (6.2%)
- Building and grounds cleaning and maintenance occupations (5.9%)
- Cooks and food preparation workers (5.6%)
- Other management occupations, except farmers and farm managers (5.5%)
- Cashiers (3.5%)
- Supervisors and other personal care and service workers, except child care workers (3.4%)
- Information and record clerks, except customer service representatives (3.2%)
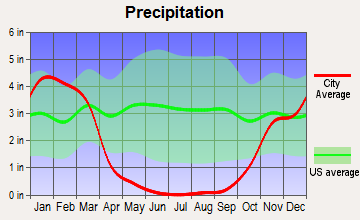
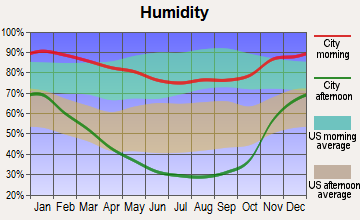
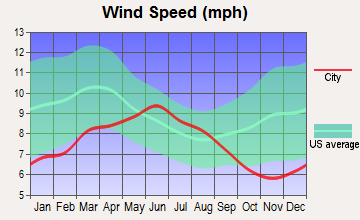
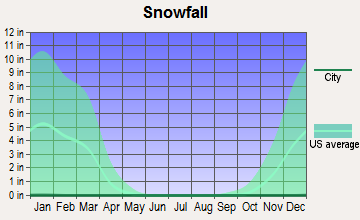
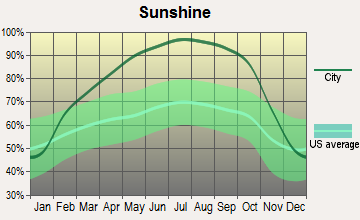
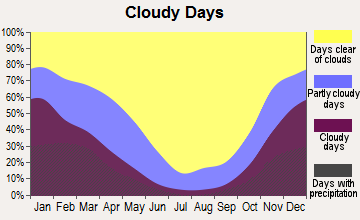
Average climate in Redwood City, California
Based on data reported by over 4,000 weather stations

|
|

(lower is better)
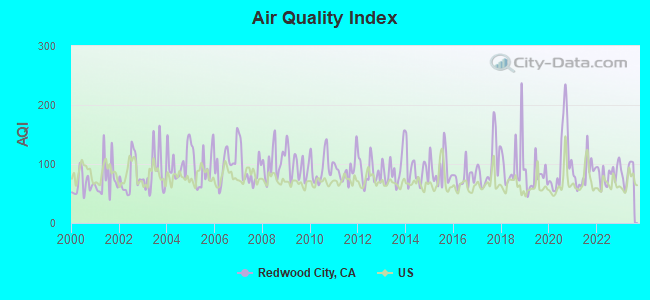
Air Quality Index (AQI) level in 2023 was 85.6. This is about average.
| City: | 85.6 |
| U.S.: | 72.6 |
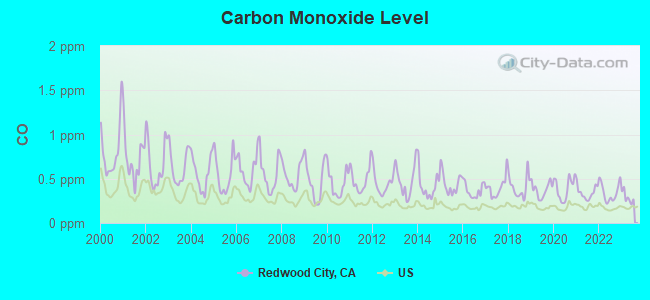
Carbon Monoxide (CO) [ppm] level in 2023 was 0.290. This is about average. Closest monitor was 1.8 miles away from the city center.
| City: | 0.290 |
| U.S.: | 0.251 |
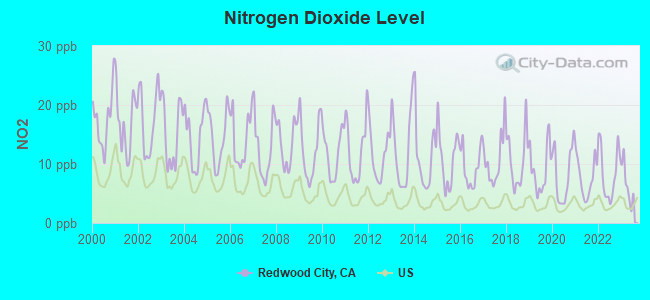
Nitrogen Dioxide (NO2) [ppb] level in 2023 was 6.57. This is worse than average. Closest monitor was 1.8 miles away from the city center.
| City: | 6.57 |
| U.S.: | 5.11 |
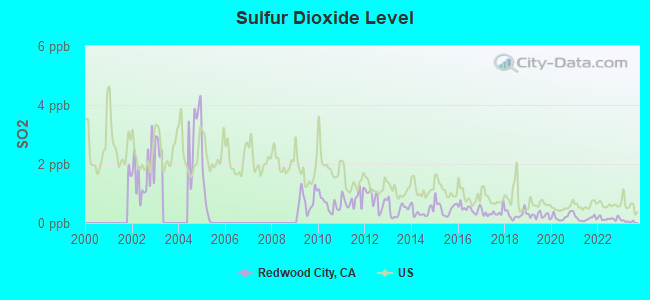
Sulfur Dioxide (SO2) [ppb] level in 2023 was 0.0574. This is significantly better than average. Closest monitor was 14.6 miles away from the city center.
| City: | 0.0574 |
| U.S.: | 1.5147 |
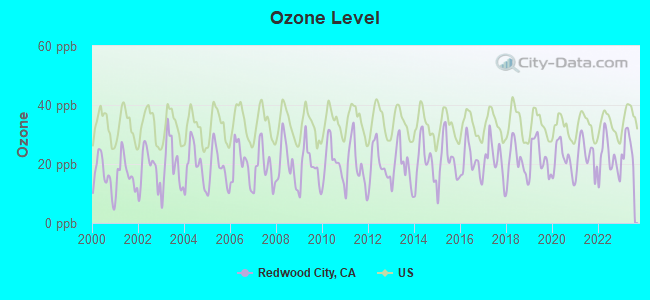
Ozone [ppb] level in 2023 was 26.1. This is better than average. Closest monitor was 1.8 miles away from the city center.
| City: | 26.1 |
| U.S.: | 33.3 |
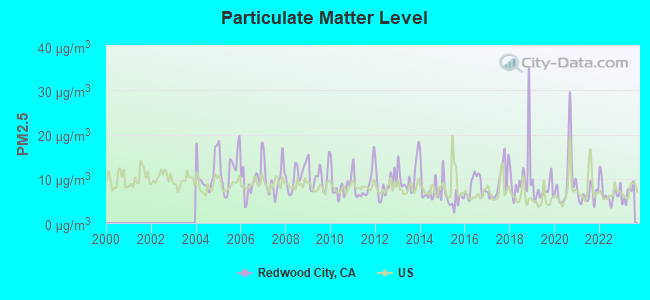
Particulate Matter (PM2.5) [µg/m3] level in 2023 was 6.54. This is better than average. Closest monitor was 1.8 miles away from the city center.
| City: | 6.54 |
| U.S.: | 8.11 |
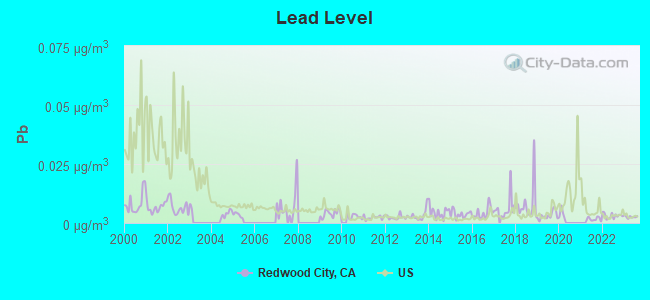
Lead (Pb) [µg/m3] level in 2023 was 0.00258. This is significantly better than average. Closest monitor was 1.8 miles away from the city center.
| City: | 0.00258 |
| U.S.: | 0.00931 |
Earthquake activity:
Redwood City-area historical earthquake activity is significantly above California state average. It is 7444% greater than the overall U.S. average.On 4/18/1906 at 13:12:21, a magnitude 7.9 (7.9 UK, Class: Major, Intensity: VIII - XII) earthquake occurred 55.0 miles away from the city center, causing $524,000,000 total damage
On 10/18/1989 at 00:04:15, a magnitude 7.1 (6.5 MB, 7.1 MS, 6.9 MW, 7.0 ML) earthquake occurred 36.4 miles away from the city center, causing 62 deaths (62 shaking deaths) and 3757 injuries, causing $1,305,032,704 total damage
On 11/4/1927 at 13:51:53, a magnitude 7.5 (7.5 UK) earthquake occurred 189.9 miles away from Redwood City center
On 7/21/1952 at 11:52:14, a magnitude 7.7 (7.7 UK) earthquake occurred 249.1 miles away from the city center, causing $50,000,000 total damage
On 1/31/1922 at 13:17:28, a magnitude 7.6 (7.6 UK) earthquake occurred 284.9 miles away from the city center
On 4/25/1992 at 18:06:04, a magnitude 7.2 (6.3 MB, 7.1 MS, 7.2 MW, 7.1 MW, Depth: 9.4 mi) earthquake occurred 221.5 miles away from Redwood City center, causing $75,000,000 total damage
Magnitude types: body-wave magnitude (MB), local magnitude (ML), surface-wave magnitude (MS), moment magnitude (MW)
Natural disasters:
The number of natural disasters in San Mateo County (18) is near the US average (15).Major Disasters (Presidential) Declared: 11
Emergencies Declared: 2
Causes of natural disasters: Floods: 11, Storms: 6, Mudslides: 5, Winter Storms: 5, Landslides: 4, Fires: 2, Drought: 1, Earthquake: 1, Freeze: 1, Hurricane: 1, Tornado: 1, Other: 1 (Note: some incidents may be assigned to more than one category).
Main business address for: THRESHOLD PHARMACEUTICALS INC (PHARMACEUTICAL PREPARATIONS), MAXYGEN INC (SERVICES-COMMERCIAL PHYSICAL & BIOLOGICAL RESEARCH), ELECTRONIC ARTS INC (SERVICES-PREPACKAGED SOFTWARE), REDWOOD MORTGAGE INVESTORS VII (MORTGAGE BANKERS & LOAN CORRESPONDENTS), AP PHARMA INC /DE/ (PHARMACEUTICAL PREPARATIONS), OPENWAVE SYSTEMS INC (SERVICES-PREPACKAGED SOFTWARE), LQ CORP INC (SERVICES-COMPUTER INTEGRATED SYSTEMS DESIGN), NIKU CORP (SERVICES-PREPACKAGED SOFTWARE) and 13 other public companies.
Hospitals in Redwood City:
- KAISER FOUNDATION HOSPITAL - REDWOOD CITY (Voluntary non-profit - Other, provides emergency services, 1150 VETERANS BOULEVARD)
- KAISER HOSPITAL HOSPICE - REDWOOD CITY (1150 VETERANS BLVD)
- MCGARVEY HOUSE (2158 MCGARVEY)
- SEQUOIA HOSPITAL (Voluntary non-profit - Private, 170 ALAMEDA DE LAS PULGAS)
- WOODSIDE WOMENS HOSPITAL (1600 GORDON ST)
Nursing Homes in Redwood City:
- CORDILLERAS MENTAL HEALTH CENTER (200 EDMONDS ROAD)
- DEVONSHIRE OAKS NURSING CENTER (3635 JEFFERSON AVENUE)
- ELLIPSE (631 WOODSIDE ROAD)
- LAUREL GLEN CONVALESCENT HOSPITAL (885 WOODSIDE ROAD)
Dialysis Facilities in Redwood City:
- REDWOOD CITY DIALYSIS CENTER (1000 MARSHALL STREET)
- SATELLITE DIALYSIS REDWOOD CITY (1410 MARSHALL STREET)
Home Health Centers in Redwood City:
Amtrak stations near Redwood City:
- 12 miles: MILLBRAE (MILLBRAE AVE. & CALIFORNIA DR.) - Bus Station . Services: fully wheelchair accessible, public payphones, free short-term parking, call for taxi service, public transit connection.
- 13 miles: SAN FRANCISCO INT'L AIRPO (SAN BRUNO, SAN FRANCISCO INTERNATIONAL AIRPORT) - Bus Station . Services: fully wheelchair accessible, enclosed waiting area, public restrooms, public payphones, snack bar, paid short-term parking, paid long-term parking, car rental agency, taxi stand, public transit connection.
- 14 miles: FREMONT (CENTERVILLE, FREMONT & PERALTA BLVDS.) . Services: fully wheelchair accessible, enclosed waiting area, public restrooms, public payphones, snack bar, free short-term parking, free long-term parking, call for car rental service, call for taxi service, public transit connection.
College/University in Redwood City:
Other colleges/universities with over 2000 students near Redwood City:
- Stanford University (about 5 miles; Stanford, CA; Full-time enrollment: 14,410)
- College of San Mateo (about 7 miles; San Mateo, CA; FT enrollment: 5,398)
- Foothill College (about 11 miles; Los Altos Hills, CA; FT enrollment: 9,635)
- Chabot College (about 14 miles; Hayward, CA; FT enrollment: 7,610)
- Mission College (about 16 miles; Santa Clara, CA; FT enrollment: 5,625)
- De Anza College (about 16 miles; Cupertino, CA; FT enrollment: 16,729)
- California State University-East Bay (about 16 miles; Hayward, CA; FT enrollment: 12,956)
Public high schools in Redwood City:
- SEQUOIA HIGH (Students: 1,180, Location: 1201 BREWSTER AVE., Grades: 9-12)
- SUMMIT PREPARATORY CHARTER HIGH (Students: 304, Location: 890 BRD.WAY, Grades: 9-12, Charter school)
- SAN MATEO COUNTY SPECIAL EDUCATION (Students: 204, Location: 101 TWIN DOLPHIN DR., Grades: KG-12)
- EVEREST PUBLIC HIGH (Students: 99, Location: 455 FIFTH AVE., Grades: 9-12, Charter school)
- CANYON OAKS YOUTH CENTER (Students: 2, Location: 400 EDMONDS RD., Grades: 8-12)
- SAN MATEO COUNTY ROP (Location: 101 TWIN DOLPHIN DR., Grades: 11-12)
- REDWOOD HIGH (Location: 1968 OLD CO RD., Grades: 9-12)
Biggest public elementary/middle schools in Redwood City:
- JOHN F. KENNEDY MIDDLE (Students: 811, Location: 2521 GOODWIN AVE., Grades: 6-8)
- CLIFFORD ELEMENTARY (Students: 566, Location: 225 CLIFFORD AVE., Grades: KG-8)
- ROY CLOUD ELEMENTARY (Students: 562, Location: 3790 RED OAK WAY, Grades: KG-8)
- NORTH STAR ACADEMY (Students: 525, Location: 400 DUANE ST., Grades: 3-8)
- SANDPIPER ELEMENTARY (Students: 419, Location: 801 REDWOOD SHORES PKWY., Grades: KG-5)
- MCKINLEY INSTITUTE OF TECHNOLOGY (Students: 331, Location: 400 DUANE ST., Grades: 6-8)
- HENRY FORD ELEMENTARY (Students: 282, Location: 2498 MASSACHUSETTS AVE., Grades: KG-5)
- ADELANTE SPANISH IMMERSION (Students: 276, Location: 3150 GRANGER WAY, Grades: KG-5)
- FAIR OAKS ELEMENTARY (Students: 268, Location: 2950 FAIR OAKS AVE., Grades: KG-5)
- HAWES ELEMENTARY (Students: 241, Location: 909 ROOSEVELT AVE., Grades: KG-5)
Private elementary/middle schools in Redwood City:
- OUR LADY OF MT CARMEL SCHOOL (Students: 310, Location: 301 GRAND ST, Grades: PK-8)
- ST PIUS ELEMENTARY SCHOOL (Students: 293, Location: 1100 WOODSIDE RD, Grades: KG-8)
- REDEEMER LUTHERAN SCHOOL (Students: 198, Location: 468 GRAND ST, Grades: KG-8)
- WEST BAY CHRISTIAN ACADEMY (Students: 73, Location: 901 MADISON AVE, Grades: PK-8)
- HOLY FAMILY SCHOOL (Students: 13, Location: 151 BUCKINGHAM AVE, Grades: 4)
User-submitted facts and corrections:
- Birthplace of Kenneth Acuna, CEO of Deloite international
- Woodside Hills Christian Academy (Private School - 105 students) 2323 Euclid Avenue Redwood City, CA 94061
Points of interest:
Notable locations in Redwood City: Emerald Hills Golf Course (A), Redwood City Municipal Services Center (B), South Bay Sewer Authority Treatment Plant (C), Redwood Marina (D), Docktown Marina (E), Press Wireless Radio Station (F), Schaberg Branch Redwood City Public Library (G), San Mateo County Government Center (H), Redwood City Public Library (I), Redwood City City Hall (J), Fair Oaks Branch Redwood City Public Library (K), Sequoia Hospital Health Sciences Library (L), San Mateo County Courthouse (M), Redwood City Fire Department Station 20 (N), Redwood City Fire Department Station 10 (O), Redwood City Fire Department Station 11 (P), Redwood City Fire Department Station 12 (Q), Redwood City Fire Department Station 9 (R). Display/hide their locations on the map
Shopping Centers: Sequoia Station Shopping Center (1), Woodside Central Shopping Center (2), Creekside Plaza Shopping Center (3), Woodside Plaza Shopping Center (4), Woodside Manor Shopping Center (5), Redwood Plaza Shopping Center (6), Mervyns Plaza Shopping Center (7), Jefferson Plaza Shopping Center (8), Community Shopping Center (9). Display/hide their locations on the map
Main business address in Redwood City include: THRESHOLD PHARMACEUTICALS INC (A), MAXYGEN INC (B), ELECTRONIC ARTS INC (C), REDWOOD MORTGAGE INVESTORS VII (D), AP PHARMA INC /DE/ (E), OPENWAVE SYSTEMS INC (F), LQ CORP INC (G), NIKU CORP (H). Display/hide their locations on the map
Churches in Redwood City include: Peninsula Covenant Church (A), Redeemer Lutheran Church (B), Mount Alverno Convent (C), Woodside Road Methodist Church (D), Temple Beth Jacob (E), Salvation Army Temple (F), Saint Pius Catholic Church (G), Saint Peter's Episcopal Church (H), Redwood Church (I). Display/hide their locations on the map
Cemetery: Union Cemetery (1). Display/hide its location on the map
Streams, rivers, and creeks: Arroyo Ojo De Agua (A), Pulgas Creek (B), Redwood Creek (C). Display/hide their locations on the map
Parks in Redwood City include: Mezes Plaza (1), Shannon Park (2), Stafford Park (3), Stulsaft Park (4), Wellesley Park (5), Jardin de Ninos Park (6), Fleishman Park (7), Dolphin Park (8), Marine View Park (9). Display/hide their locations on the map
Hotels: Best Western Executive Suites (25 5th Avenue) (1), Best Inn (1090 El Camino Real) (2), Best Western Inn (316 El Camino Real) (3), Budget Inn Motel (1402 Stafford Street) (4). Display/hide their approximate locations on the map
Birthplace of: Jon Huntsman, Jr. - Diplomat, Roy Williams (safety) - College football player, Chelsi Smith - Actress, Linda Cardellini - Child actor, Chris Carter (right-handed hitter) - Baseball player, Amini Silatolu - Football offensive lineman, Paul Shirley - Basketball player, Roy Williams - 2005 NFL player (Dallas Cowboys, born: Aug 14, 1980), Michael Roukes - Physicist, Cedric Bixler-Zavala - Rock singer.
Drinking water stations with addresses in Redwood City that have no violations reported:
- SAN MATEO COUNTY MEMORIAL PARK (Population served: 1,790, Primary Water Source Type: Surface water)
| This city: | 2.7 people |
| California: | 2.9 people |
| This city: | 65.3% |
| Whole state: | 68.7% |
| This city: | 7.5% |
| Whole state: | 7.2% |
Likely homosexual households (counted as self-reported same-sex unmarried-partner households)
- Lesbian couples: 0.6% of all households
- Gay men: 0.5% of all households
People in group quarters in Redwood City in 2010:
- 1,064 people in local jails and other municipal confinement facilities
- 117 people in group homes intended for adults
- 107 people in emergency and transitional shelters (with sleeping facilities) for people experiencing homelessness
- 80 people in workers' group living quarters and job corps centers
- 53 people in nursing facilities/skilled-nursing facilities
- 52 people in residential treatment centers for adults
- 52 people in other noninstitutional facilities
- 22 people in group homes for juveniles (non-correctional)
People in group quarters in Redwood City in 2000:
- 1,073 people in local jails and other confinement facilities (including police lockups)
- 269 people in nursing homes
- 250 people in other noninstitutional group quarters
- 133 people in mental (psychiatric) hospitals or wards
- 68 people in homes for the mentally retarded
- 44 people in homes for the mentally ill
- 41 people in homes or halfway houses for drug/alcohol abuse
- 29 people in religious group quarters
- 10 people in other group homes
- 4 people in other nonhousehold living situations
- 3 people in hospitals/wards and hospices for chronically ill
- 3 people in other hospitals or wards for chronically ill
- 3 people in orthopedic wards and institutions for the physically handicapped
Banks with most branches in Redwood City (2011 data):
- Wells Fargo Bank, National Association: Broadway-Main Branch, Sequoia Station Branch, Redwood Shores Parkway Branch, Redwood City Branch. Info updated 2011/04/05: Bank assets: $1,161,490.0 mil, Deposits: $905,653.0 mil, headquarters in Sioux Falls, SD, positive income, 6395 total offices, Holding Company: Wells Fargo & Company
- Bank of America, National Association: Redwood City Main Branch, Woodside Plaza Branch, Redwood Shores Branch. Info updated 2009/11/18: Bank assets: $1,451,969.3 mil, Deposits: $1,077,176.8 mil, headquarters in Charlotte, NC, positive income, 5782 total offices, Holding Company: Bank Of America Corporation
- JPMorgan Chase Bank, National Association: 1615 Woodside Rd Branch at 1615 Woodside Rd, branch established on 1988/12/27; Redwood City Branch at 2300 Broadway Street, branch established on 1889/01/01. Info updated 2011/11/10: Bank assets: $1,811,678.0 mil, Deposits: $1,190,738.0 mil, headquarters in Columbus, OH, positive income, International Specialization, 5577 total offices, Holding Company: Jpmorgan Chase & Co.
- First Republic Bank: Redwood City Branch at 776 El Camino Real, branch established on 2002/02/04. Info updated 2010/08/03: Bank assets: $27,791.8 mil, Deposits: $22,459.3 mil, headquarters in San Francisco, CA, positive income, Mortgage Lending Specialization, 60 total offices
- United American Bank: Mid-Peninsula at 2400 Broadway, Suite 100, branch established on 2007/10/29. Info updated 2006/11/03: Bank assets: $273.6 mil, Deposits: $253.7 mil, headquarters in San Mateo, CA, negative income in the last year, Commercial Lending Specialization, 4 total offices, Holding Company: Atbancorp
- U.S. Bank National Association: Redwood City Woodside Branch at 1475 Woodside Road, branch established on 1973/08/01. Info updated 2012/01/30: Bank assets: $330,470.8 mil, Deposits: $236,091.5 mil, headquarters in Cincinnati, OH, positive income, 3121 total offices, Holding Company: U.S. Bancorp
- Union Bank, National Association: Redwood City Branch at 675 Jefferson Avenue, branch established on 1968/11/01. Info updated 2011/09/01: Bank assets: $88,967.5 mil, Deposits: $65,286.4 mil, headquarters in San Francisco, CA, positive income, Commercial Lending Specialization, 403 total offices, Holding Company: Mitsubishi Ufj Financial Group, Inc.
- Citibank, National Association: Redwood City Branch at 702 Marshall St, branch established on 2006/10/01. Info updated 2012/01/10: Bank assets: $1,288,658.0 mil, Deposits: $882,541.0 mil, headquarters in Sioux Falls, SD, positive income, International Specialization, 1048 total offices, Holding Company: Citigroup Inc.
- First National Bank of Northern California: Redwood City Branch at 700 El Camino Real, branch established on 1993/06/07. Info updated 2006/11/03: Bank assets: $715.6 mil, Deposits: $622.4 mil, headquarters in Daly City, CA, positive income, Commercial Lending Specialization, 12 total offices, Holding Company: Fnb Bancorp
For population 15 years and over in Redwood City:
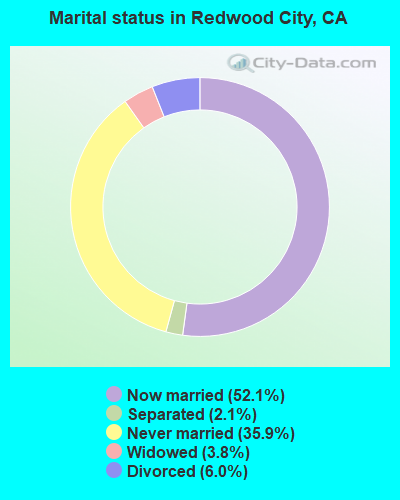
- Never married: 35.9%
- Now married: 52.1%
- Separated: 2.1%
- Widowed: 3.8%
- Divorced: 6.0%
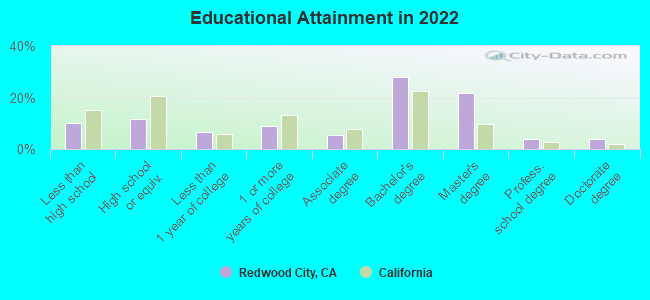
For population 25 years and over in Redwood City:
- High school or higher: 90.1%
- Bachelor's degree or higher: 57.5%
- Graduate or professional degree: 29.6%
- Unemployed: 2.6%
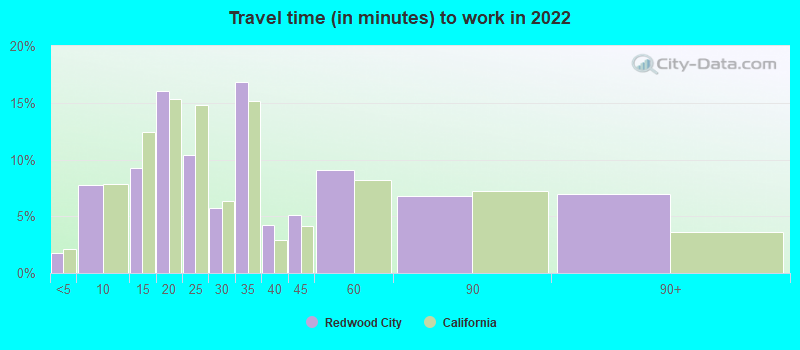
- Mean travel time to work (commute): 16.3 minutes
| Here: | 14.0 |
| California average: | 15.5 |
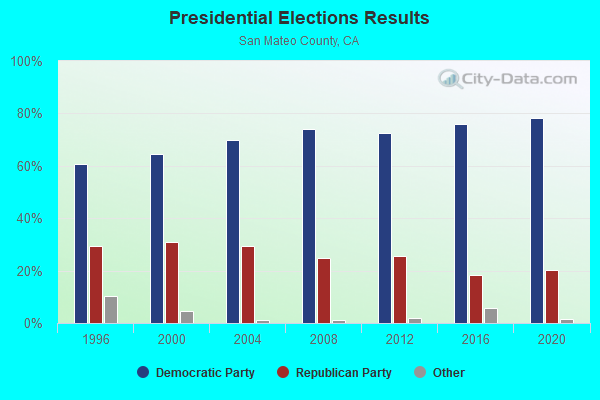
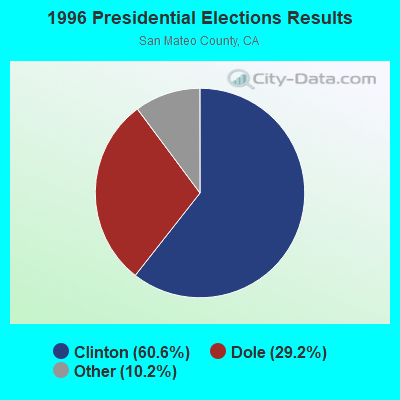
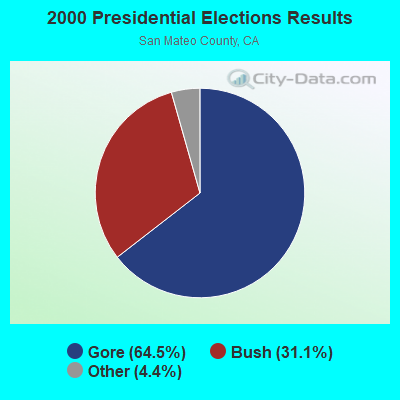
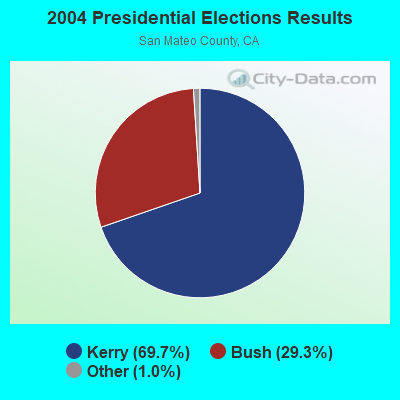

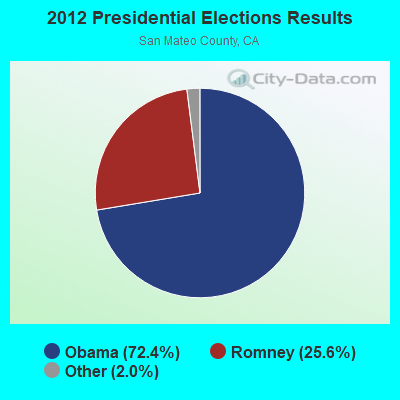
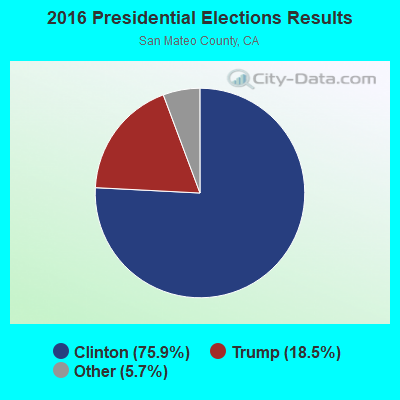
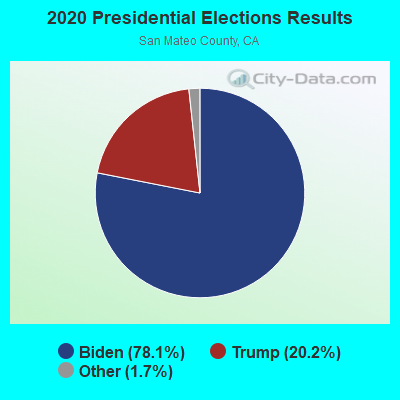
Graphs represent county-level data. Detailed 2008 Election Results
Neighborhoods in Redwood City:
(Redwood City, California Neighborhood Map)- Ampex neighborhood
- Bair Island neighborhood
- Centennial neighborhood
- Central (Central Park) neighborhood
- Cordilleras Addition neighborhood
- Dolphin neighborhood
- Downtown neighborhood
- Dumbarton neighborhood
- Eagle Hill (Eaglehill) neighborhood
- Emerald Hills neighborhood
- Farm Hill (Farm Hills) neighborhood
- Friendly Acres (East Bayshore) neighborhood
- Greco Island neighborhood
- Harbor neighborhood
- Harbor VIllage neighborhood
- Kentfield Commons (Kentfield) neighborhood
- Le Mar Mobile neighborhood
- Lido neighborhood
- Marina neighborhood
- Marina Park neighborhood
- Marine neighborhood
- Marlin neighborhood
- Mezes Park neighborhood
- Middlefield neighborhood
- Mount Carmel neighborhood
- Oak Knoll (Edgewood Park) neighborhood
- Oakwood neighborhood
- Palm Park (Palm) neighborhood
- Palomar Park (Palomar) neighborhood
- Redwood Junction neighborhood
- Redwood Oaks neighborhood
- Redwood Shores neighborhood
- Redwood Village (Hoover/Middlefield) neighborhood
- Roosevelt (Roosevelt Plaza) neighborhood
- Seaport neighborhood
- Selby neighborhood
- Sequoia neighborhood
- Shearwater neighborhood
- Stambaugh Heller neighborhood
- Steinberger neighborhood
- Westport neighborhood
- Woodside Plaza neighborhood
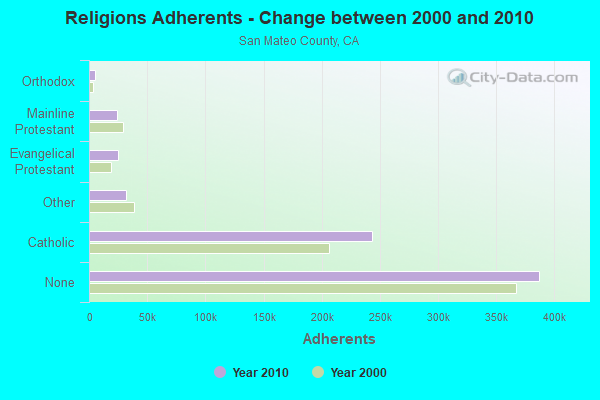
Religion statistics for Redwood City, CA (based on San Mateo County data)
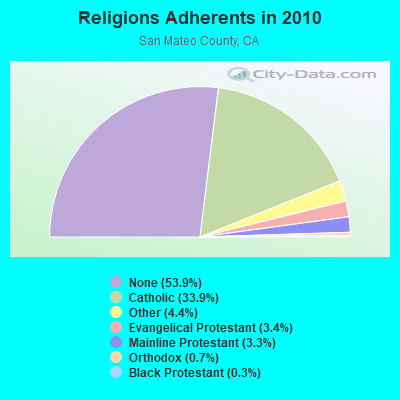
| Religion | Adherents | Congregations |
|---|---|---|
| Catholic | 243,634 | 22 |
| Other | 31,697 | 78 |
| Evangelical Protestant | 24,771 | 166 |
| Mainline Protestant | 23,840 | 74 |
| Orthodox | 5,350 | 5 |
| Black Protestant | 2,046 | 12 |
| None | 387,113 | - |
Food Environment Statistics:
| San Mateo County: | 2.44 / 10,000 pop. |
| California: | 2.14 / 10,000 pop. |
| This county: | 0.06 / 10,000 pop. |
| State: | 0.04 / 10,000 pop. |
| This county: | 0.56 / 10,000 pop. |
| State: | 0.62 / 10,000 pop. |
| Here: | 1.62 / 10,000 pop. |
| California: | 1.49 / 10,000 pop. |
| This county: | 10.02 / 10,000 pop. |
| California: | 7.42 / 10,000 pop. |
| San Mateo County: | 7.1% |
| California: | 7.3% |
| San Mateo County: | 16.9% |
| California: | 21.3% |
| San Mateo County: | 18.0% |
| State: | 17.9% |
Health and Nutrition:
| Redwood City: | 50.6% |
| State: | 49.4% |
| Redwood City: | 50.1% |
| California: | 48.0% |
| Redwood City: | 27.8 |
| California: | 28.1 |
| Here: | 19.1% |
| California: | 20.2% |
| This city: | 9.9% |
| State: | 11.2% |
| Redwood City: | 6.8 |
| State: | 6.8 |
| Here: | 30.7% |
| State: | 31.5% |
| Here: | 58.5% |
| California: | 56.4% |
| Redwood City: | 81.4% |
| California: | 80.9% |
More about Health and Nutrition of Redwood City, CA Residents
Redwood City government finances - Expenditure in 2017 (per resident):
- Construction - Regular Highways: $8,206,000 ($101.92)
Housing and Community Development: $6,098,000 ($75.74)
Water Utilities: $3,739,000 ($46.44)
Sea and Inland Port Facilities: $2,995,000 ($37.20)
Central Staff Services: $1,792,000 ($22.26)
Sewerage: $1,292,000 ($16.05)
Parks and Recreation: $626,000 ($7.78)
Libraries: $598,000 ($7.43)
Local Fire Protection: $132,000 ($1.64)
- Current Operations - Police Protection: $39,016,000 ($484.60)
Water Utilities: $31,628,000 ($392.84)
Local Fire Protection: $28,857,000 ($358.42)
Sewerage: $26,005,000 ($323.00)
Parks and Recreation: $15,657,000 ($194.47)
Regular Highways: $15,161,000 ($188.31)
Central Staff Services: $9,216,000 ($114.47)
Libraries: $8,895,000 ($110.48)
Protective Inspection and Regulation - Other: $8,889,000 ($110.41)
Sea and Inland Port Facilities: $3,534,000 ($43.89)
Financial Administration: $3,318,000 ($41.21)
Parking Facilities: $2,440,000 ($30.31)
General - Other: $1,620,000 ($20.12)
Health - Other: $824,000 ($10.23)
Housing and Community Development: $513,000 ($6.37)
- General - Interest on Debt: $4,877,000 ($60.57)
- Intergovernmental to Local - Other - Water Utilities: $16,521,000 ($205.20)
Other - Electric Utilities: $11,515,000 ($143.02)
Other - General - Other: $692,000 ($8.59)
Other - Health - Other: $664,000 ($8.25)
Other - Parking Facilities: $104,000 ($1.29)
Other - Elementary and Secondary Education: $101,000 ($1.25)
- Other Capital Outlay - Water Utilities: $5,489,000 ($68.18)
Regular Highways: $510,000 ($6.33)
General - Other: $265,000 ($3.29)
Police Protection: $62,000 ($0.77)
Central Staff Services: $20,000 ($0.25)
Financial Administration: $18,000 ($0.22)
Protective Inspection and Regulation - Other: $6,000 ($0.07)
Housing and Community Development: $4,000 ($0.05)
- Water Utilities - Interest on Debt: $2,133,000 ($26.49)
Redwood City government finances - Revenue in 2017 (per resident):
- Charges - Sewerage: $37,069,000 ($460.42)
Other: $18,360,000 ($228.04)
Sea and Inland Port Facilities: $7,128,000 ($88.53)
Parks and Recreation: $3,532,000 ($43.87)
Parking Facilities: $1,965,000 ($24.41)
Housing and Community Development: $48,000 ($0.60)
- Federal Intergovernmental - General Local Government Support: $4,128,000 ($51.27)
Housing and Community Development: $1,022,000 ($12.69)
Water Utilities: $592,000 ($7.35)
Other: $370,000 ($4.60)
- Local Intergovernmental - Other: $1,279,000 ($15.89)
Water Utilities: $62,000 ($0.77)
- Miscellaneous - Donations From Private Sources: $7,615,000 ($94.58)
Special Assessments: $6,249,000 ($77.62)
Rents: $1,881,000 ($23.36)
Interest Earnings: $1,645,000 ($20.43)
Fines and Forfeits: $923,000 ($11.46)
General Revenue - Other: $374,000 ($4.65)
- Revenue - Water Utilities: $35,887,000 ($445.73)
- State Intergovernmental - Other: $3,448,000 ($42.83)
Highways: $1,470,000 ($18.26)
General Local Government Support: $180,000 ($2.24)
- Tax - Property: $58,544,000 ($727.15)
General Sales and Gross Receipts: $24,071,000 ($298.97)
Public Utilities Sales: $14,104,000 ($175.18)
Other Selective Sales: $6,553,000 ($81.39)
Other License: $3,711,000 ($46.09)
Occupation and Business License - Other: $2,582,000 ($32.07)
Documentary and Stock Transfer: $810,000 ($10.06)
Other: $538,000 ($6.68)
Redwood City government finances - Debt in 2017 (per resident):
- Long Term Debt - Beginning Outstanding - Unspecified Public Purpose: $94,470,000 ($1173.37)
Outstanding Unspecified Public Purpose: $83,040,000 ($1031.40)
Retired Unspecified Public Purpose: $17,731,000 ($220.23)
Beginning Outstanding - Public Debt for Private Purpose: $14,755,000 ($183.26)
Outstanding Nonguaranteed - Industrial Revenue: $12,945,000 ($160.78)
Issue, Unspecified Public Purpose: $6,300,000 ($78.25)
Retired Nonguaranteed - Public Debt for Private Purpose: $1,810,000 ($22.48)
Redwood City government finances - Cash and Securities in 2017 (per resident):
- Bond Funds - Cash and Securities: $50,278,000 ($624.48)
- Other Funds - Cash and Securities: $228,248,000 ($2834.96)
- Sinking Funds - Cash and Securities: $20,645,000 ($256.42)
6.99% of this county's 2021 resident taxpayers lived in other counties in 2020 ($178,839 average adjusted gross income)
| Here: | 6.99% |
| California average: | 5.19% |
0.01% of residents moved from foreign countries ($58 average AGI)
San Mateo County: 0.01% California average: 0.03%
Top counties from which taxpayers relocated into this county between 2020 and 2021:
| from San Francisco County, CA | |
| from Santa Clara County, CA | |
| from Alameda County, CA |
9.90% of this county's 2020 resident taxpayers moved to other counties in 2021 ($222,747 average adjusted gross income)
| Here: | 9.90% |
| California average: | 6.14% |
0.01% of residents moved to foreign countries ($372 average AGI)
San Mateo County: 0.01% California average: 0.02%
Top counties to which taxpayers relocated from this county between 2020 and 2021:
| to Santa Clara County, CA | |
| to San Francisco County, CA | |
| to Alameda County, CA |
| Businesses in Redwood City, CA | ||||
| Name | Count | Name | Count | |
|---|---|---|---|---|
| 24 Hour Fitness | 1 | KFC | 2 | |
| 7-Eleven | 4 | Kmart | 1 | |
| AMF Bowling | 1 | Kohl's | 1 | |
| Applebee's | 1 | Kroger | 1 | |
| AutoZone | 1 | Lane Bryant | 1 | |
| Avenue | 1 | Lane Furniture | 1 | |
| Barnes & Noble | 1 | Little Caesars Pizza | 2 | |
| Baskin-Robbins | 2 | Marriott | 1 | |
| Bed Bath & Beyond | 1 | Marshalls | 1 | |
| Best Western | 2 | Mazda | 1 | |
| Big O Tires | 1 | McDonald's | 3 | |
| Blockbuster | 1 | Men's Wearhouse | 1 | |
| Burger King | 2 | Nike | 7 | |
| CVS | 2 | Nissan | 1 | |
| Carl\s Jr. | 1 | OfficeMax | 1 | |
| Chevrolet | 1 | Old Navy | 1 | |
| Chipotle | 1 | Panda Express | 1 | |
| Chuck E. Cheese's | 1 | Payless | 2 | |
| Circle K | 1 | Pizza Hut | 1 | |
| Comfort Inn | 1 | Quiznos | 2 | |
| Costco | 1 | RadioShack | 2 | |
| DHL | 1 | Rite Aid | 2 | |
| Dairy Queen | 1 | Safeway | 3 | |
| Days Inn | 1 | Sears | 2 | |
| Dennys | 1 | Sprint Nextel | 1 | |
| Discount Tire | 1 | Starbucks | 9 | |
| Domino's Pizza | 1 | Subaru | 1 | |
| DressBarn | 1 | Subway | 6 | |
| Dressbarn | 1 | T-Mobile | 3 | |
| FedEx | 16 | Taco Bell | 2 | |
| Firestone Complete Auto Care | 1 | Target | 1 | |
| Foot Locker | 1 | Toyota | 1 | |
| Ford | 1 | Toys"R"Us | 2 | |
| GNC | 3 | U-Haul | 2 | |
| GameStop | 2 | UPS | 8 | |
| Goodwill | 2 | Vans | 2 | |
| H&R Block | 2 | Verizon Wireless | 1 | |
| Holiday Inn | 2 | Volkswagen | 1 | |
| Honda | 1 | Vons | 2 | |
| IHOP | 1 | Wendy's | 1 | |
| Jamba Juice | 2 | Whole Foods Market | 1 | |
| Johnny Rockets | 1 | YMCA | 1 | |
| Jones New York | 2 | |||
Strongest AM radio stations in Redwood City:
- KNBR (680 AM; 50 kW; SAN FRANCISCO, CA; Owner: KNBR LICO, INC.)
- KYCY (1550 AM; 50 kW; SAN FRANCISCO, CA; Owner: INFINITY BROADCASTING OPERATIONS, INC.)
- KGO (810 AM; 50 kW; SAN FRANCISCO, CA; Owner: KGO-AM RADIO, INC.)
- KTCT (1050 AM; 50 kW; SAN MATEO, CA; Owner: SUSQUEHANNA RADIO CORP.)
- KFAX (1100 AM; 50 kW; SAN FRANCISCO, CA; Owner: GOLDEN GATE BROADCASTING CO, INC.)
- KSFB (1220 AM; 5 kW; PALO ALTO, CA; Owner: SCA-PALO ALTO, LLC)
- KTRB (860 AM; 50 kW; MODESTO, CA; Owner: PAPPAS RADIO OF CALIFORNIA, A CALIFORNIA LIMITED PARTNERSHIP)
- KLOK (1170 AM; 50 kW; SAN JOSE, CA; Owner: ENTRAVISION HOLDINGS, LLC)
- KIQI (1010 AM; 35 kW; SAN FRANCISCO, CA; Owner: RADIO UNICA OF SAN FRANCISCO LICENSE CORP.)
- KCBS (740 AM; 50 kW; SAN FRANCISCO, CA; Owner: INFINITY BROADCASTING OPERATIONS, INC.)
- KNEW (910 AM; 20 kW; OAKLAND, CA; Owner: AMFM RADIO LICENSES, L.L.C.)
- KSFO (560 AM; 5 kW; SAN FRANCISCO, CA; Owner: KGO-AM RADIO, INC.)
- KSJX (1500 AM; 10 kW; SAN JOSE, CA; Owner: MULTICULTURAL RADIO BROADCASTING INC)
Strongest FM radio stations in Redwood City:
- KFJC (89.7 FM; LOS ALTOS, CA; Owner: FOOTHILL-DE ANZA COMM. COLLEGE DIST.)
- KCSM (91.1 FM; SAN MATEO, CA; Owner: SAN MATEO COUNTY COMMUNITY COLLEGE)
- KKSF-FM1 (103.7 FM; PLEASANTON, ETC., CA; Owner: AMFM RADIO LICENSES, L.L.C.)
- KZBR-FM2 (95.7 FM; LIVERMORE, ETC., CA; Owner: BONNEVILLE HOLDING COMPANY)
- KFRC-FM3 (99.7 FM; WALNUT CREEK, CA; Owner: INFINITY KFRC-FM, INC.)
- KZBR-FM1 (95.7 FM; WALNUT CREEK, CA; Owner: BONNEVILLE HOLDING COMPANY)
- KBLX-FM2 (102.9 FM; PLEASANTON, CA; Owner: ICBC BROADCAST HOLDINGS -CA, INC.)
- KSOL-FM3 (98.9 FM; PLEASANTON, CA; Owner: TMS LICENSE CALIFORNIA, INC)
- KYLD (94.9 FM; SAN FRANCISCO, CA; Owner: AMFM RADIO LICENSES, L.L.C.)
- KFRC-FM (99.7 FM; SAN FRANCISCO, CA; Owner: INFINITY KFRC-FM, INC.)
- KISQ-FM3 (98.1 FM; CONCORD, CA; Owner: AMFM RADIO LICENSES, L.L.C.)
- KBLX-FM (102.9 FM; BERKELEY, CA; Owner: ICBC BROADCAST HOLDINGS - CA, INC.)
- KZBR (95.7 FM; SAN FRANCISCO, CA; Owner: BONNEVILLE HOLDING COMPANY)
- KMEL (106.1 FM; SAN FRANCISCO, CA; Owner: AMFM RADIO LICENSES, L.L.C.)
- KSAN (107.7 FM; SAN MATEO, CA; Owner: SUSQUEHANNA RADIO CORP.)
- KQED-FM (88.5 FM; SAN FRANCISCO, CA; Owner: KQED, INC.)
- KBAA (94.5 FM; GILROY, CA; Owner: INFINITY RADIO OPERATIONS INC.)
- KITS (105.3 FM; SAN FRANCISCO, CA; Owner: INFINITY BROADCASTING OPERATIONS, INC.)
- KMEL-FM1 (106.1 FM; CONCORD, CA; Owner: AMFM RADIO LICENSES, L.L.C.)
- KOIT-FM (96.5 FM; SAN FRANCISCO, CA; Owner: BONNEVILLE HOLDING COMPANY)
TV broadcast stations around Redwood City:
- KQED (Channel 9; SAN FRANCISCO, CA; Owner: KQED, INC.)
- KGO-TV (Channel 7; SAN FRANCISCO, CA; Owner: KGO TELEVISION, INC.)
- KPIX-TV (Channel 5; SAN FRANCISCO, CA; Owner: CBS BROADCASTING INC.)
- KTVU (Channel 2; OAKLAND, CA; Owner: KTVU PARTNERSHIP)
- KRON-TV (Channel 4; SAN FRANCISCO, CA; Owner: YOUNG BROADCASTING OF SAN FRANCISCO, INC.)
- KCSM-TV (Channel 60; SAN MATEO, CA; Owner: SAN MATEO COUNTY COMMUNITY COLLEGE DISTRICT)
- KMTP-TV (Channel 32; SAN FRANCISCO, CA; Owner: MINORITY TELEVISION PROJECT)
- KBHK-TV (Channel 44; SAN FRANCISCO, CA; Owner: VIACOM TELEVISION STATIONS GROUP OF SAN FRANCISCO INC.)
- KBWB (Channel 20; SAN FRANCISCO, CA; Owner: KBWB LICENSE, INC.)
- KFSF (Channel 66; VALLEJO, CA; Owner: TELEFUTURA SAN FRANCISCO LLC)
- KBIT-CA (Channel 28; SAN FRANCISCO, ETC., CA; Owner: POLAR BROADCASTING, INC.)
- KCNS (Channel 38; SAN FRANCISCO, CA; Owner: WRAY, INC.)
- KICU-TV (Channel 36; SAN JOSE, CA; Owner: KTVU PARTNERSHIP)
- KTEH (Channel 54; SAN JOSE, CA; Owner: KTEH FOUNDATION)
- KDTV (Channel 14; SAN FRANCISCO, CA; Owner: KDTV LICENSE PARTNERSHIP, G.P.)
- KSTS (Channel 48; SAN JOSE, CA; Owner: TELEMUNDO OF NORTHERN CALIFORNIA LICENSE CORP.)
- KTSF (Channel 26; SAN FRANCISCO, CA; Owner: LINCOLN BROADCASTING COMPANY, A CALIFORNIA LP)
- National Bridge Inventory (NBI) Statistics
- 37Number of bridges
- 574ft / 175mTotal length
- $6,331,000Total costs
- 2,225,590Total average daily traffic
- 104,307Total average daily truck traffic
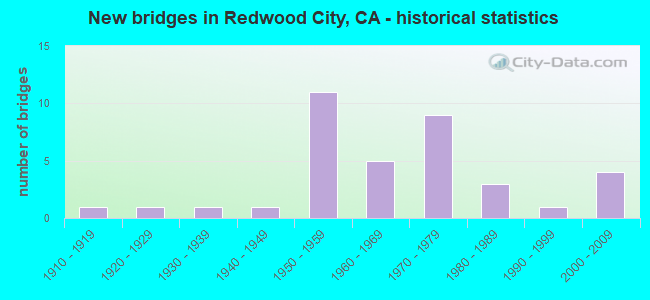
- New bridges - historical statistics
- 11910-1919
- 11920-1929
- 11930-1939
- 11940-1949
- 111950-1959
- 51960-1969
- 91970-1979
- 31980-1989
- 11990-1999
- 42000-2009
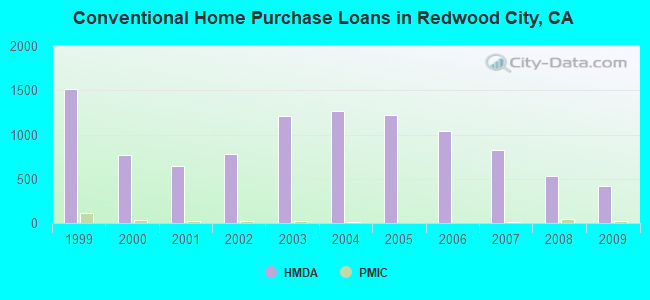
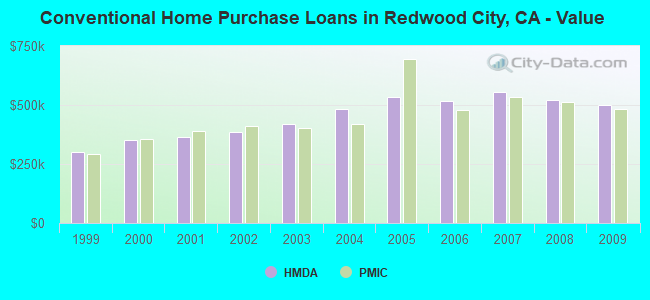
| Home Mortgage Disclosure Act Aggregated Statistics For Year 2009 (Based on 14 full and 6 partial tracts) | ||||||||||||||
| A) FHA, FSA/RHS & VA Home Purchase Loans | B) Conventional Home Purchase Loans | C) Refinancings | D) Home Improvement Loans | E) Loans on Dwellings For 5+ Families | F) Non-occupant Loans on < 5 Family Dwellings (A B C & D) | G) Loans On Manufactured Home Dwelling (A B C & D) | ||||||||
|---|---|---|---|---|---|---|---|---|---|---|---|---|---|---|
| Number | Average Value | Number | Average Value | Number | Average Value | Number | Average Value | Number | Average Value | Number | Average Value | Number | Average Value | |
| LOANS ORIGINATED | 76 | $517,621 | 419 | $499,569 | 2,334 | $417,313 | 71 | $314,265 | 10 | $4,177,600 | 127 | $349,049 | 6 | $75,870 |
| APPLICATIONS APPROVED, NOT ACCEPTED | 3 | $575,097 | 59 | $456,942 | 254 | $452,213 | 10 | $310,881 | 1 | $800,000 | 14 | $410,060 | 3 | $89,180 |
| APPLICATIONS DENIED | 9 | $426,186 | 57 | $376,732 | 553 | $482,706 | 25 | $202,667 | 6 | $1,016,127 | 48 | $339,226 | 12 | $65,638 |
| APPLICATIONS WITHDRAWN | 16 | $422,226 | 54 | $480,107 | 298 | $440,240 | 13 | $211,295 | 6 | $836,137 | 31 | $344,172 | 2 | $87,850 |
| FILES CLOSED FOR INCOMPLETENESS | 2 | $506,390 | 12 | $421,992 | 94 | $459,734 | 6 | $355,355 | 0 | $0 | 7 | $262,949 | 3 | $72,210 |
Detailed mortgage data for all 20 tracts in Redwood City, CA
| Private Mortgage Insurance Companies Aggregated Statistics For Year 2009 (Based on 12 full and 4 partial tracts) | ||||
| A) Conventional Home Purchase Loans | B) Refinancings | |||
|---|---|---|---|---|
| Number | Average Value | Number | Average Value | |
| LOANS ORIGINATED | 20 | $485,058 | 4 | $396,668 |
| APPLICATIONS APPROVED, NOT ACCEPTED | 6 | $408,325 | 4 | $516,500 |
| APPLICATIONS DENIED | 1 | $364,990 | 4 | $327,795 |
| APPLICATIONS WITHDRAWN | 1 | $593,000 | 1 | $399,000 |
| FILES CLOSED FOR INCOMPLETENESS | 1 | $417,000 | 0 | $0 |
2005 - 2018 National Fire Incident Reporting System (NFIRS) incidents
- Fire incident types reported to NFIRS in Redwood City, CA
- 95543.2%Structure Fires
- 70932.1%Outside Fires
- 37717.1%Mobile Property/Vehicle Fires
- 1697.6%Other
 Based on the data from the years 2005 - 2018 the average number of fire incidents per year is 158. The highest number of reported fire incidents - 251 took place in 2008, and the least - 42 in 2013. The data has an increasing trend.
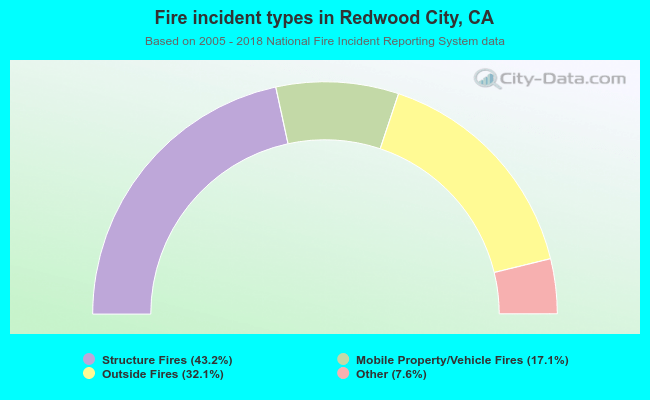 When looking into fire subcategories, the most reports belonged to: Structure Fires (43.2%), and Outside Fires (32.1%).
Fire-safe hotels and motels in Redwood City, California:
- Best Western Executive Suites, 25 Fifth Ave, Redwood City, California 94063 , Phone: (650) 366-5794, Fax: (650) 365-1429
- Pacific Inn Of Redwood City, 2610 El Camino Real, Redwood City, California 94061 , Phone: (650) 368-1495, Fax: (650) 368-1672
- Holiday Inn Express Redwood City Central, 1836 El Camino Real, Redwood City, California 94063 , Phone: (650) 299-0909, Fax: (650) 299-0907
- America's Best Inn, 1090 El Camino Real, Redwood City, California 94063 , Phone: (650) 369-1731, Fax: (650) 299-9428
- Pacific Euro Hotel, 868 Main St, Redwood City, California 94063 , Phone: (650) 363-1642, Fax: (650) 365-1582
- Redwood City Courtyard by Marriott, 600 Bair Island Rd, Redwood City, California 94063 , Phone: (650) 216-9435, Fax: (650) 216-9441
- Courtyard by Marriott Redwood City, 600 Bair Island Rd, Redwood city, California 94063 , Phone: (800) 831-0224, Fax: (650) 216-9441
- Good Nite Inn Redwood City, 485 Veterans Blvd, Redwood city, California 94063 , Phone: (650) 365-5500, Fax: (650) 365-1199
| Most common first names in Redwood City, CA among deceased individuals | ||
| Name | Count | Lived (average) |
|---|---|---|
| John | 566 | 74.1 years |
| Mary | 425 | 80.2 years |
| William | 420 | 74.5 years |
| Robert | 375 | 71.8 years |
| James | 298 | 71.4 years |
| George | 281 | 76.3 years |
| Charles | 263 | 75.8 years |
| Margaret | 237 | 79.1 years |
| Joseph | 236 | 75.8 years |
| Helen | 226 | 80.2 years |
| Most common last names in Redwood City, CA among deceased individuals | ||
| Last name | Count | Lived (average) |
|---|---|---|
| Smith | 156 | 75.9 years |
| Johnson | 113 | 76.6 years |
| Williams | 81 | 75.1 years |
| Miller | 70 | 76.4 years |
| Brown | 67 | 73.9 years |
| Anderson | 64 | 79.4 years |
| Martin | 59 | 76.3 years |
| Davis | 58 | 72.7 years |
| Wilson | 56 | 75.3 years |
| Jones | 55 | 74.9 years |
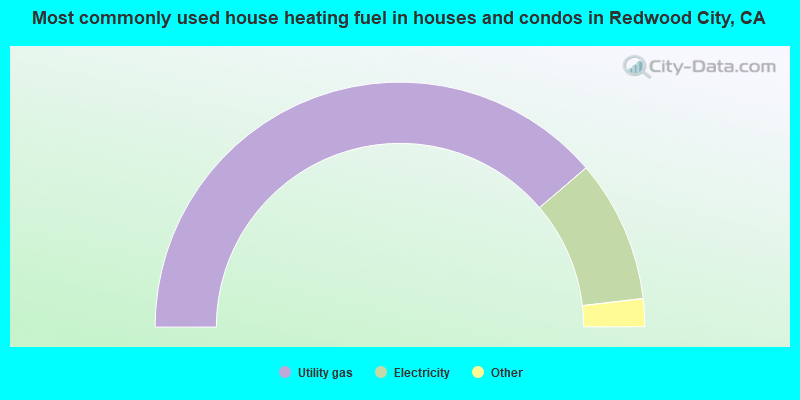
- 77.5%Utility gas
- 18.8%Electricity
- 2.0%Bottled, tank, or LP gas
- 0.5%Solar energy
- 0.4%Wood
- 0.4%Fuel oil, kerosene, etc.
- 0.3%No fuel used
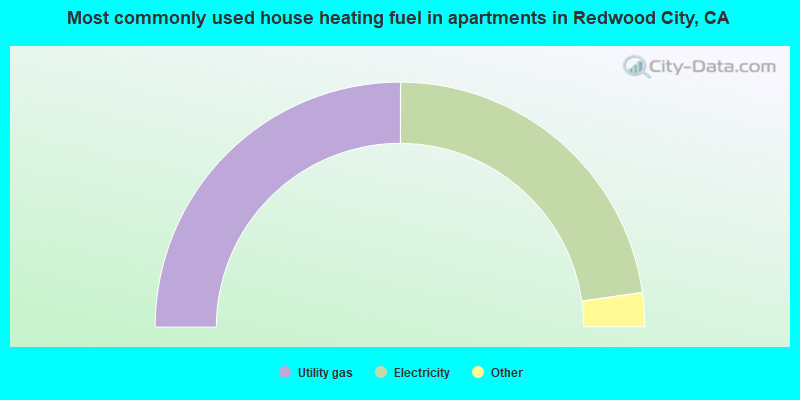
- 50.1%Utility gas
- 45.4%Electricity
- 2.7%No fuel used
- 1.2%Bottled, tank, or LP gas
- 0.3%Other fuel
- 0.2%Fuel oil, kerosene, etc.
Redwood City compared to California state average:
- Median household income above state average.
- Median house value significantly above state average.
- Unemployed percentage significantly below state average.
- Median age above state average.
- Percentage of population with a bachelor's degree or higher significantly above state average.
Redwood City on our top lists:
- #2 on the list of "Top 101 cities with the largest racial income disparity between any two races with at least 2,000 householders"
- #12 on the list of "Top 100 cities with highest median house value (pop. 50,000+)"
- #15 on the list of "Top 100 cities with highest ratio of median house value to median household income (pop. 50,000+)"
- #18 on the list of "Top 101 cities with the largest differences between morning and afternoon humidity (population 50,000+)"
- #18 on the list of "Top 101 cities with largest percentage of females in occupations: life, physical, and social science occupations (population 50,000+)"
- #18 on the list of "Top 101 cities with the largest humidity differences during a year (population 50,000+)"
- #36 on the list of "Top 101 cities with largest percentage of females in occupations: fire fighting and prevention workers including supervisors (population 50,000+)"
- #41 on the list of "Top 101 cities with largest percentage of males in occupations: life, physical, and social science occupations (population 50,000+)"
- #47 on the list of "Top 101 cities with largest percentage of males in industries: professional, scientific, and technical services (population 50,000+)"
- #47 on the list of "Top 101 cities with the most people having professional degrees (population 50,000+)"
- #51 on the list of "Top 101 cities with largest percentage of males in occupations: computer and mathematical occupations (population 50,000+)"
- #51 on the list of "Top 101 cities with the most local government spending on current operations of libraries per resident (population 10,000+)"
- #52 on the list of "Top 101 cities with the largest racial income disparity between any two races with at least 200 householders"
- #53 on the list of "Top 101 cities with largest percentage of males in occupations: education, training, and library occupations (population 50,000+)"
- #55 on the list of "Top 101 cities with largest percentage of females in industries: professional, scientific, and technical services (population 50,000+)"
- #62 on the list of "Top 101 cities with the highest average sunshine amount (population 50,000+)"
- #65 on the list of "Top 101 cities with the highest maximum monthly sunshine amount (population 50,000+)"
- #74 on the list of "Top 101 cities with largest percentage of females in occupations: legal occupations (population 50,000+)"
- #76 on the list of "Top 101 cities with the largest percentage of likely lesbian couples (counted as self-reported female-female unmarried-partner households) (population 50,000+)"
- #79 on the list of "Top 101 cities with the largest city-data.com crime index increase from 2011 to 2012 (population 50,000+)"
- #6 on the list of "Top 101 counties with the highest percentage of residents that exercised in the past month"
- #8 on the list of "Top 101 counties with the highest percentage of residents that drank alcohol in the past 30 days"
- #9 on the list of "Top 101 counties with the lowest Ozone (1-hour) air pollution readings in 2012 (ppm)"
- #10 on the list of "Top 101 counties with the highest carbon monoxide air pollution readings in 2012 (ppm)"
- #11 on the list of "Top 101 counties with the lowest average weight of females"

|
|
Total of 11008 patent applications in 2008-2024.