Estimated zip code population in 2022: 34,518 Zip code population in 2010: 30,949 Zip code population in 2000: 32,350
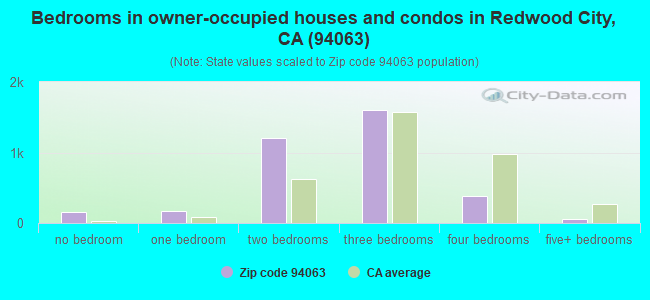
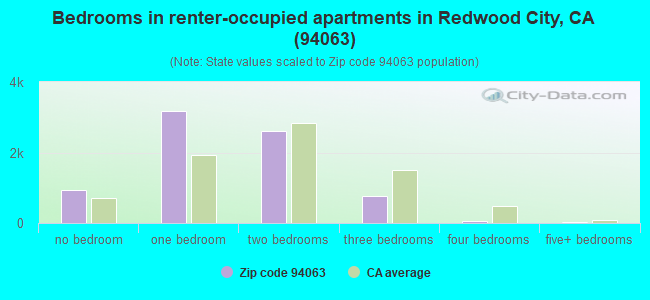
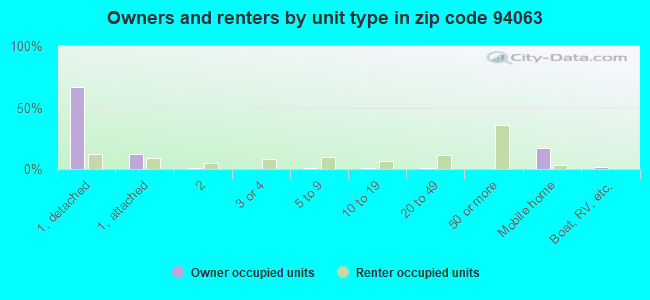
Houses and condos: 11,978 Renter-occupied apartments: 7,564
% of renters here:
68%
State:
44%
March 2022 cost of living index in zip code 94063: 132.9 (high, U.S. average is 100)
Land area: 6.8 sq. mi. Water area: 1.1 sq. mi.
Population density: 5,060 people per square mile
(average).
OSM Map
General Map
Google Map
MSN Map
OSM Map
General Map
Google Map
MSN Map
OSM Map
General Map
Google Map
MSN Map
OSM Map
General Map
Google Map
MSN Map
Please wait while loading the map...
Real estate property taxes paid for housing units in 2022:
This zip code:
0.6% ($7,031)
California:
0.7% ($4,831)
Median real estate property taxes paid for housing units with mortgages in 2022: $8,094 (0.6%) Median real estate property taxes paid for housing units with no mortgage in 2022: $4,167 (0.6%)
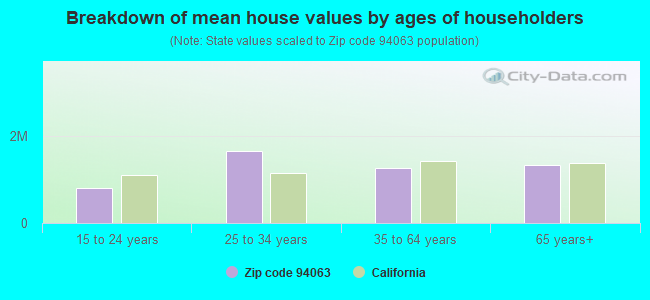
Estimated median house/condo value in 2022: $1,187,918
94063:
$1,187,918
California:
$715,900
According to our research of California and other state lists, there were 53 registered sex offenders living in 94063 zip code as of April 26, 2024. The ratio of all residents to sex offenders in zip code 94063 is 639 to 1. The ratio of registered sex offenders to all residents in this zip code is near the state average.
Median resident age:
This zip code:
33.2 years
California median age:
37.9 years
Average household size:
This zip code:
3.0 people
California:
2.8 people
Averages for the 2020 tax year for zip code 94063, filed in 2021:
Average Adjusted Gross Income (AGI) in 2020: $98,936 (Individual Income Tax Returns)
Here:
$98,936
State:
$95,910
Salary/wage: $95,178 (reported on 84.4% of returns)
Here:
$95,178
State:
$77,331
(% of AGI for various income ranges: 1466.5% for AGIs below $25k, 4579.7% for AGIs $25k-50k, 8351.8% for AGIs $50k-75k, 11823.7% for AGIs $75k-100k, 22396.4% for AGIs $100k-200k, 151421.9% for AGIs over 200k)
Taxable interest for individuals: $1,202 (reported on 28.7% of returns)
This zip code:
$1,202
California:
$2,294
(% of AGI for various income ranges: 11.7% for AGIs below $25k, 9.4% for AGIs $25k-50k, 27.9% for AGIs $50k-75k, 32.0% for AGIs $75k-100k, 82.6% for AGIs $100k-200k, 794.7% for AGIs over 200k)
Ordinary dividends: $5,357 (reported on 19.4% of returns)
Here:
$5,357
State:
$10,949
(% of AGI for various income ranges: 20.5% for AGIs below $25k, 17.7% for AGIs $25k-50k, 57.6% for AGIs $50k-75k, 67.4% for AGIs $75k-100k, 171.7% for AGIs $100k-200k, 2935.3% for AGIs over 200k)
Net capital gain/loss in AGI: +$36,716 (reported on 19.4% of returns)
Here:
+$36,716
State:
+$49,306
(% of AGI for various income ranges: 14.7% for AGIs below $25k, 16.1% for AGIs $25k-50k, 46.8% for AGIs $50k-75k, 122.0% for AGIs $75k-100k, 393.1% for AGIs $100k-200k, 25754.4% for AGIs over 200k)
Profit/loss from business: +$17,391 (reported on 19.0% of returns)
Here:
+$17,391
State:
+$15,671
(% of AGI for various income ranges: 538.9% for AGIs below $25k, 388.9% for AGIs $25k-50k, 400.4% for AGIs $50k-75k, 488.0% for AGIs $75k-100k, 651.7% for AGIs $100k-200k, 3127.0% for AGIs over 200k)
Taxable individual retirement arrangement distribution: $21,891 (reported on 3.4% of returns)
94063:
$21,891
California:
$23,505
(% of AGI for various income ranges: 27.8% for AGIs below $25k, 44.9% for AGIs $25k-50k, 89.4% for AGIs $50k-75k, 128.5% for AGIs $75k-100k, 174.3% for AGIs $100k-200k, 1300.7% for AGIs over 200k)
Self-employed (Keogh) retirement plans: $22,744 (reported on 0.5% of returns)
94063:
$22,744
California:
$30,163
(% of AGI for various income ranges: 8.7% for AGIs $25k-50k, 27.3% for AGIs $100k-200k, 337.9% for AGIs over 200k)
Total itemized deductions: $41,951 (reported on 10.0% of returns)
Here:
$41,951
State:
$39,517
(% of AGI for various income ranges: 77.9% for AGIs below $25k, 141.2% for AGIs $25k-50k, 286.7% for AGIs $50k-75k, 696.6% for AGIs $75k-100k, 1127.6% for AGIs $100k-200k, 9042.3% for AGIs over 200k)
Charity contributions: $8,652 (reported on 7.2% of returns)
Here:
$8,652
State:
$12,598
(% of AGI for various income ranges: 1.8% for AGIs below $25k, 13.3% for AGIs $25k-50k, 25.3% for AGIs $50k-75k, 71.6% for AGIs $75k-100k, 124.7% for AGIs $100k-200k, 1697.0% for AGIs over 200k)
Taxes paid: $8,796 (reported on 10.0% of returns)
94063:
$8,796
State:
$8,807
(% of AGI for various income ranges: 18.2% for AGIs below $25k, 35.6% for AGIs $25k-50k, 82.2% for AGIs $50k-75k, 196.9% for AGIs $75k-100k, 367.8% for AGIs $100k-200k, 1255.1% for AGIs over 200k)
Earned income credit: $1,992 (reported on 10.3% of returns)
Here:
$1,992
State:
$2,074
(% of AGI for various income ranges: 95.0% for AGIs below $25k, 48.0% for AGIs $25k-50k)
Percentage of individuals using paid preparers for their 2020 taxes: 90.3%
Here:
90%
State:
92%
(% for various income ranges: 85.3% for AGIs below $25k, 89.4% for AGIs $25k-50k, 91.6% for AGIs $50k-75k, 92.0% for AGIs $75k-100k, 93.5% for AGIs $100k-200k, 96.8% for AGIs over 200k)
Averages for the 2012 tax year for zip code 94063, filed in 2013:
Average Adjusted Gross Income (AGI) in 2012: $53,235 (Individual Income Tax Returns)
Here:
$53,235
State:
$72,726
Salary/wage: $47,484 (reported on 85.2% of returns)
Here:
$47,484
State:
$59,079
(% of AGI for various income ranges: 76.1% for AGIs below $25k, 87.3% for AGIs $25k-50k, 85.5% for AGIs $50k-75k, 83.7% for AGIs $75k-100k, 84.8% for AGIs $100k-200k, 53.3% for AGIs over 200k)
Taxable interest for individuals: $1,404 (reported on 22.1% of returns)
This zip code:
$1,404
California:
$2,146
(% of AGI for various income ranges: 0.3% for AGIs below $25k, 0.2% for AGIs $25k-50k, 0.3% for AGIs $50k-75k, 0.3% for AGIs $75k-100k, 0.2% for AGIs $100k-200k, 1.5% for AGIs over 200k)
Ordinary dividends: $4,432 (reported on 9.9% of returns)
Here:
$4,432
State:
$9,308
(% of AGI for various income ranges: 0.6% for AGIs below $25k, 0.3% for AGIs $25k-50k, 0.4% for AGIs $50k-75k, 0.8% for AGIs $75k-100k, 0.7% for AGIs $100k-200k, 1.7% for AGIs over 200k)
Net capital gain/loss in AGI: +$10,790 (reported on 8.7% of returns)
Here:
+$10,790
State:
+$30,460
(% of AGI for various income ranges: 0.2% for AGIs $50k-75k, 0.6% for AGIs $75k-100k, 1.0% for AGIs $100k-200k, 5.7% for AGIs over 200k)
Profit/loss from business: +$17,903 (reported on 19.0% of returns)
Here:
+$17,903
State:
+$17,064
(% of AGI for various income ranges: 17.0% for AGIs below $25k, 6.7% for AGIs $25k-50k, 5.3% for AGIs $50k-75k, 4.4% for AGIs $75k-100k, 6.4% for AGIs $100k-200k, 3.0% for AGIs over 200k)
Taxable individual retirement arrangement distribution: $13,590 (reported on 3.6% of returns)
94063:
$13,590
California:
$19,557
(% of AGI for various income ranges: 0.9% for AGIs below $25k, 0.8% for AGIs $25k-50k, 1.0% for AGIs $50k-75k, 1.0% for AGIs $75k-100k, 1.1% for AGIs $100k-200k, 0.8% for AGIs over 200k)
Self-employment retirement plans: $17,383 (reported on 0.4% of returns)
94063:
$17,383
California:
$24,530
Total itemized deductions: $30,114 (22% of AGI, reported on 22.2% of returns)
Here:
$30,114
State:
$34,004
Here:
22.2% of AGI
State:
22.7% of AGI
(% of AGI for various income ranges: 5.7% for AGIs below $25k, 7.5% for AGIs $25k-50k, 12.7% for AGIs $50k-75k, 14.4% for AGIs $75k-100k, 17.3% for AGIs $100k-200k, 14.7% for AGIs over 200k)
Charity contributions: $2,581 (reported on 15.7% of returns)
Here:
$2,581
State:
$4,659
(% of AGI for various income ranges: 0.2% for AGIs below $25k, 0.4% for AGIs $25k-50k, 0.8% for AGIs $50k-75k, 0.9% for AGIs $75k-100k, 1.1% for AGIs $100k-200k, 0.9% for AGIs over 200k)
Taxes paid: $13,233 (reported on 22.2% of returns)
94063:
$13,233
State:
$14,448
(% of AGI for various income ranges: 1.0% for AGIs below $25k, 1.7% for AGIs $25k-50k, 3.4% for AGIs $50k-75k, 5.2% for AGIs $75k-100k, 7.5% for AGIs $100k-200k, 10.0% for AGIs over 200k)
Earned income credit: $2,232 (reported on 16.8% of returns)
Here:
$2,232
State:
$2,286
(% of AGI for various income ranges: 4.9% for AGIs below $25k, 0.9% for AGIs $25k-50k)
Percentage of individuals using paid preparers for their 2012 taxes: 69.2%
Here:
69%
State:
64%
(% for various income ranges: 70.3% for AGIs below $25k, 72.4% for AGIs $25k-50k, 68.7% for AGIs $50k-75k, 62.4% for AGIs $75k-100k, 58.9% for AGIs $100k-200k, 64.5% for AGIs over 200k)
Averages for the 2004 tax year for zip code 94063, filed in 2005:
Average Adjusted Gross Income (AGI) in 2004: $55,792 (Individual Income Tax Returns)
Here:
$55,792
State:
$58,600
Salary/wage: $41,328 (reported on 86.7% of returns)
Here:
$41,328
State:
$49,455
(% of AGI for various income ranges: 445.3% for AGIs below $10k, 82.2% for AGIs $10k-25k, 89.1% for AGIs $25k-50k, 86.6% for AGIs $50k-75k, 87.7% for AGIs $75k-100k, 37.3% for AGIs over 100k)
Taxable interest for individuals: $2,687 (reported on 32.5% of returns)
This zip code:
$2,687
California:
$2,365
(% of AGI for various income ranges: 23.5% for AGIs below $10k, 0.9% for AGIs $10k-25k, 0.5% for AGIs $25k-50k, 0.7% for AGIs $50k-75k, 0.6% for AGIs $75k-100k, 2.4% for AGIs over 100k)
Taxable dividends: $7,807 (reported on 12.6% of returns)
Here:
$7,807
State:
$4,746
(% of AGI for various income ranges: 13.8% for AGIs below $10k, 0.5% for AGIs $10k-25k, 0.3% for AGIs $25k-50k, 0.3% for AGIs $50k-75k, 0.5% for AGIs $75k-100k, 3.2% for AGIs over 100k)
Net capital gain/loss: +$59,702 (reported on 11.4% of returns)
Here:
+$59,702
State:
+$23,418
(% of AGI for various income ranges: 9.3% for AGIs below $10k, 0.2% for AGIs $10k-25k, 0.2% for AGIs $25k-50k, 0.4% for AGIs $50k-75k, 1.1% for AGIs $75k-100k, 25.0% for AGIs over 100k)
Profit/loss from business: +$14,566 (reported on 15.8% of returns)
Here:
+$14,566
State:
+$16,826
(% of AGI for various income ranges: 109.0% for AGIs below $10k, 10.3% for AGIs $10k-25k, 5.6% for AGIs $25k-50k, 5.9% for AGIs $50k-75k, 4.4% for AGIs $75k-100k, 1.2% for AGIs over 100k)
IRA payment deduction: $2,841 (reported on 1.9% of returns)
94063:
$2,841
California:
$3,192
(% of AGI for various income ranges: 1.4% for AGIs below $10k, 0.1% for AGIs $10k-25k, 0.2% for AGIs $25k-50k, 0.2% for AGIs $50k-75k, 0.1% for AGIs $75k-100k, 0.0% for AGIs over 100k)
Self-employed pension: $11,676 (reported on 0.6% of returns)
Here:
$11,676
California:
$17,688
(% of AGI for various income ranges: 0.1% for AGIs $25k-50k, 0.1% for AGIs $50k-75k, 0.3% for AGIs $75k-100k, 0.1% for AGIs over 100k)
Total itemized deductions: $28,434 (25% of AGI, reported on 27.9% of returns)
Here:
$28,434
State:
$28,113
Here:
25.1% of AGI
State:
25.3% of AGI
(% of AGI for various income ranges: 70.7% for AGIs below $10k, 8.7% for AGIs $10k-25k, 12.5% for AGIs $25k-50k, 18.7% for AGIs $50k-75k, 18.7% for AGIs $75k-100k, 13.5% for AGIs over 100k)
Charity contributions deductions: $3,198 (3% of AGI, reported on 22.2% of returns)
Here:
$3,198
State:
$3,923
Here:
2.6% of AGI
State:
3.3% of AGI
(% of AGI for various income ranges: 1.6% for AGIs below $10k, 0.4% for AGIs $10k-25k, 0.7% for AGIs $25k-50k, 1.1% for AGIs $50k-75k, 1.2% for AGIs $75k-100k, 1.7% for AGIs over 100k)
Total tax: $12,372 (reported on 71.4% of returns)
94063:
$12,372
State:
$10,761
(% of AGI for various income ranges: 21.1% for AGIs below $10k, 4.2% for AGIs $10k-25k, 6.4% for AGIs $25k-50k, 9.3% for AGIs $50k-75k, 11.3% for AGIs $75k-100k, 24.6% for AGIs over 100k)
Earned income credit: $1,628 (reported on 14.0% of returns)
Here:
$1,628
State:
$1,763
Percentage of individuals using paid preparers for their 2004 taxes: 71.8%
Here:
72%
State:
66%
(% for various income ranges: 64.3% for AGIs below $10k, 77.8% for AGIs $10k-25k, 74.2% for AGIs $25k-50k, 67.8% for AGIs $50k-75k, 66.2% for AGIs $75k-100k, 65.8% for AGIs over 100k)
Likely homosexual households (counted as self-reported same-sex unmarried-partner households)
Lesbian couples: 0.0% of all households
Gay men: 0.2% of all households
Household received Food Stamps/SNAP in the past 12 months: 1,840 Household did not receive Food Stamps/SNAP in the past 12 months: 9,410
Women who had a birth in the past 12 months: 307 (229 now married, 78 unmarried) Women who did not have a birth in the past 12 months: 9,025 (4,149 now married, 4,851 unmarried)
Housing units in zip code 94063 with a mortgage: 2,383 (211 second mortgage, 3 home equity loan, 178 both second mortgage and home equity loan) Houses without a mortgage: 67
Median monthly owner costs for units with a mortgage: $3,398 Median monthly owner costs for units without a mortgage: $894
Residents with income below the poverty level in 2022:
This zip code:
11.3%
Whole state:
12.2%
Residents with income below 50% of the poverty level in 2022:
This zip code:
6.5%
Whole state:
6.2%
Median number of rooms in houses and condos:
Here:
5.0
State:
6.0
Median number of rooms in apartments:
Here:
3.2
State:
3.9
Notable locations in this zip code not listed on our city pages
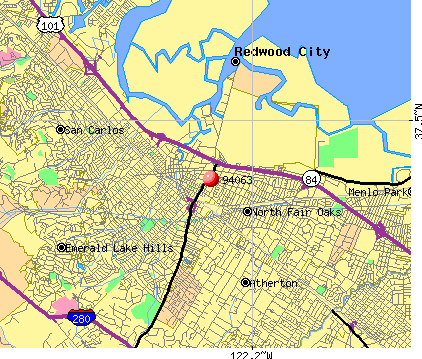
Notable locations in zip code 94063: Redwood City Municipal Services Center (A), Redwood Marina (B), Docktown Marina (C), San Mateo County Government Center (D), Redwood City Public Library (E), Redwood City City Hall (F), Fair Oaks Branch Redwood City Public Library (G), San Mateo County Courthouse (H), Redwood City Fire Department Station 11 (I), Redwood City Fire Department Station 9 (J). Display/hide their locations on the map
Shopping Centers: Sequoia Station Shopping Center (1), Creekside Plaza Shopping Center (2), Redwood Plaza Shopping Center (3), Mervyns Plaza Shopping Center (4), Seaport Village North Shopping Center (5). Display/hide their locations on the map
Churches in zip code 94063 include: Tabernacle of Praise (A), Peninsula Christian Center (B), Inglesia Ni Cristo (C), Central Bay Community Baptist Church (D). Display/hide their locations on the map
Parks in zip code 94063 include: Mezes Plaza (1), Jardin de Ninos Park (2), Andrew Spinas Park (3), Hoover Park (4). Display/hide their locations on the map
4,419 married couples with children.
1,689 single-parent households (280 men, 1,409 women).
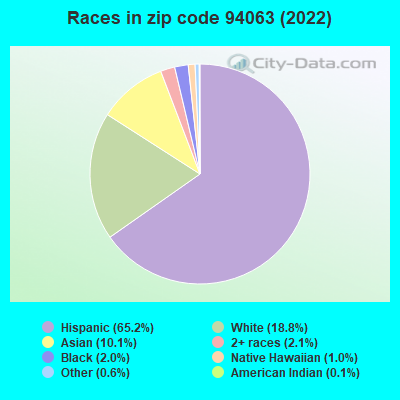
35.9% of residents of 94063 zip code speak English at home.
52.4% of residents speak Spanish at home (59% very well, 17% well, 16% not well, 8% not at all).
3.7% of residents speak other Indo-European language at home (88% very well, 9% well, 2% not well, 2% not at all).
6.7% of residents speak Asian or Pacific Island language at home (66% very well, 21% well, 9% not well, 4% not at all).
0.8% of residents speak other language at home (89% very well, 11% well).
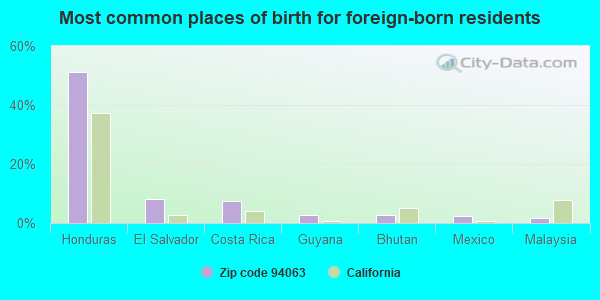
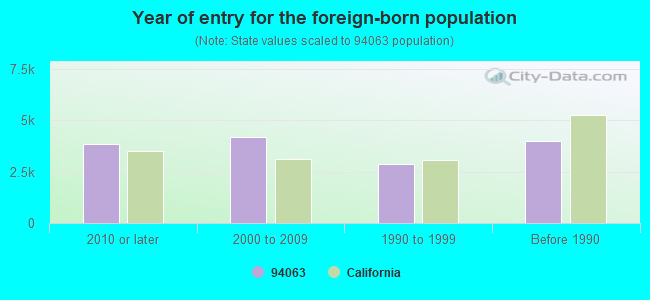
Foreign born population: 14,341 (41.5%) (40.6% of them are naturalized citizens)
Major facilities with environmental interests located in this zip code:
MAXGEN INC (515 GALVESTON DRIVE in REDWOOD CITY, CA)
STATE MASTER (California - Hazardous Waste Tracking) - HAZARDOU WASTE PROGRAM CRITERIA AND HAZARDOUS AIR POLLUTANT INVENTORY (Inventory of air pollution sources) Large Quantity Generators, more that 1000 kg of hazardous waste/month (Resource Conservation and Recovery Act (tracking hazardous waste)) - notification Business SIC classification: COMMERCIAL PHYSICAL AND BIOLOGICAL RESEARCH Organizations: MAXYGEN INC (CONTACT/OWNER)
Alternative names: MAXYGEN INC, SUGEN INC
JACK CARPENTIER OLDSMOBILE (543 EL CAMINO REAL in REDWOOD CITY, CA)
CRITERIA AND HAZARDOUS AIR POLLUTANT INVENTORY (Inventory of air pollution sources) (Resource Conservation and Recovery Act (tracking hazardous waste)) Business SIC classification: TOP, BODY, AND UPHOLSTERY REPAIR SHOPS AND PAINT SHOPS Organizations: JOSEPH MORRONE PRES (CONTACT/OWNER)
Alternative names: PENINSULA OLDSMOBILE INC
MARTINEZ FRAME AUTO BODY (2933 MIDDLEFIELD ROAD in REDWOOD CITY, CA)
STATE MASTER (California - Hazardous Waste Tracking) - HAZARDOU WASTE PROGRAM CRITERIA AND HAZARDOUS AIR POLLUTANT INVENTORY (Inventory of air pollution sources) Small Quantity Generators, between 100 kg and 1000 kg of hazardous waste/month (Resource Conservation and Recovery Act (tracking hazardous waste)) - notification Business SIC classification: TOP, BODY, AND UPHOLSTERY REPAIR SHOPS AND PAINT SHOPS Business NAICS classification: GENERAL AUTOMOTIVE REPAIR. Organizations: ADRIAN MARTINEZ (CONTACT/OWNER)
Alternative names: MONTANOS AUTO BODY & PAINT
ADVANCED POLYMER SYSTEMS INC (123 SAGINAW DR in REDWOOD CITY, CA)
STATE MASTER (California - Hazardous Waste Tracking) - HAZARDOU WASTE PROGRAM Large Quantity Generators, more that 1000 kg of hazardous waste/month (Resource Conservation and Recovery Act (tracking hazardous waste)) - notification Alternative names: A P PHARMA
MICS AUTO BODY INCORPORATED (1800 INDUSTRIAL WAY in REDWOOD CITY, CA)
STATE MASTER (California - Hazardous Waste Tracking) - HAZARDOU WASTE PROGRAM CRITERIA AND HAZARDOUS AIR POLLUTANT INVENTORY (Inventory of air pollution sources) Small Quantity Generators, between 100 kg and 1000 kg of hazardous waste/month (Resource Conservation and Recovery Act (tracking hazardous waste)) - notification Business SIC classification: TOP, BODY, AND UPHOLSTERY REPAIR SHOPS AND PAINT SHOPS Business NAICS classification: AUTOMOTIVE BODY, PAINT, AND INTERIOR REPAIR AND MAINTENANCE. Organizations: GARY BUTLER (CONTACT/OWNER)
KAISER PERMANENTE MEDICAL CTR (910 MARSHALL STREET in REDWOOD CITY, CA)
STATE MASTER (California - Hazardous Waste Tracking) - HAZARDOU WASTE PROGRAM (Resource Conservation and Recovery Act (tracking hazardous waste))
ANODIZERS INCORPORATED (1709 E. BAYSHORE RD. #8 in REDWOOD CITY, CA)
STATE MASTER (California - Hazardous Waste Tracking) - HAZARDOU WASTE PROGRAM Small Quantity Generators, between 100 kg and 1000 kg of hazardous waste/month (Resource Conservation and Recovery Act (tracking hazardous waste)) - notification TRI REPORTER (Tracking of toxic chemicals releasing facilities) Business SIC and NAICS classification: ELECTROPLATING, PLATING, POLISHING, ANODIZING, AND COLORING Alternative names: AI INDUSTRIES
MAXYGEN INC (220 PENOBSCOT DRIVE in REDWOOD CITY, CA)
STATE MASTER (California - Hazardous Waste Tracking) - HAZARDOU WASTE PROGRAM Large Quantity Generators, more that 1000 kg of hazardous waste/month (Resource Conservation and Recovery Act (tracking hazardous waste)) - notification Alternative names: SUGEN INC
CALIFORNIA AUTOMOTIVE CONCEPTS (1020 HANSEN WY in REDWOOD CITY, CA)
STATE MASTER (California - Hazardous Waste Tracking) - HAZARDOU WASTE PROGRAM CRITERIA AND HAZARDOUS AIR POLLUTANT INVENTORY (Inventory of air pollution sources) Small Quantity Generators, between 100 kg and 1000 kg of hazardous waste/month (Resource Conservation and Recovery Act (tracking hazardous waste)) - notification Business SIC classification: TOP, BODY, AND UPHOLSTERY REPAIR SHOPS AND PAINT SHOPS Organizations: BRIAN BUCKNER (CONTACT/OWNER)
Alternative names: CA AUTOMOTIVE CONCEPTS INC DBA CA CONCEP
EVALVE INC (2761 FAIROAKS AVE UNIT A in REDWOOD CITY, CA)
STATE MASTER (California - Hazardous Waste Tracking) - HAZARDOU WASTE PROGRAM Small Quantity Generators, between 100 kg and 1000 kg of hazardous waste/month (Resource Conservation and Recovery Act (tracking hazardous waste)) Organizations: VELA CORP (CONTACT/OWNER)
H N LOCKWOOD INC (450 MAPLE ST in REDWOOD CITY, CA)
STATE MASTER (California - Hazardous Waste Tracking) - HAZARDOU WASTE PROGRAM CRITERIA AND HAZARDOUS AIR POLLUTANT INVENTORY (Inventory of air pollution sources) Small Quantity Generators, between 100 kg and 1000 kg of hazardous waste/month (Resource Conservation and Recovery Act (tracking hazardous waste)) - notification Business SIC classification: COMMERCIAL PRINTING, LITHOGRAPHIC Business NAICS classification: ALL OTHER PLASTICS PRODUCT MANUFACTURING.
AMPEX CORPORATION (401 BROADWAY STREET in REDWOOD CITY, CA)
STATE MASTER (California - Hazardous Waste Tracking) - HAZARDOU WASTE PROGRAM Small Quantity Generators, between 100 kg and 1000 kg of hazardous waste/month (Resource Conservation and Recovery Act (tracking hazardous waste)) TRI REPORTER (Tracking of toxic chemicals releasing facilities) Business SIC classification: MAGNETIC AND OPTICAL RECORDING MEDIA Business NAICS classification: OTHER ELECTRONIC COMPONENT MANUFACTURING.
CHEMOCENTRYX (3696 HAVEN AVE STE B in REDWOOD CITY, CA)
STATE MASTER (California - Hazardous Waste Tracking) - HAZARDOU WASTE PROGRAM Small Quantity Generators, between 100 kg and 1000 kg of hazardous waste/month (Resource Conservation and Recovery Act (tracking hazardous waste))
Housing units lacking complete plumbing facilities: 0.5% Housing units lacking complete kitchen facilities: 1.3%
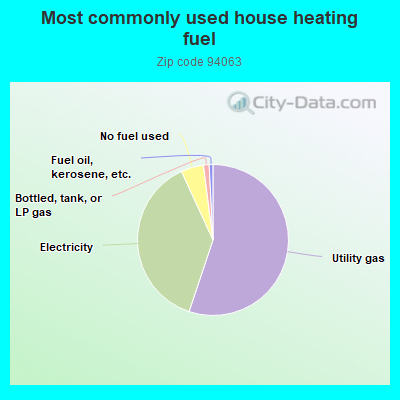
54.7%Utility gas
37.7%Electricity
4.8%No fuel used
1.2%Bottled, tank, or LP gas
0.8%Fuel oil, kerosene, etc.
Population in 1990: 28,251. Population change in the 1990s: +4,099 (+14.5%).
Place of birth for U.S.-born residents:
This state: 16,570
Northeast: 1,079
Midwest: 756
South: 674
West: 723
53% of the 94063 zip code residents lived in the same house 5 years ago. Out of people who lived in different houses, 72% lived in this county. Out of people who lived in different counties, 50% lived in California.
85% of the 94063 zip code residents lived in the same house 1 year ago. Out of people who lived in different houses, 36% moved from this county. Out of people who lived in different houses, 36% moved from different county within same state. Out of people who lived in different houses, 13% moved from different state. Out of people who lived in different houses, 17% moved from abroad.
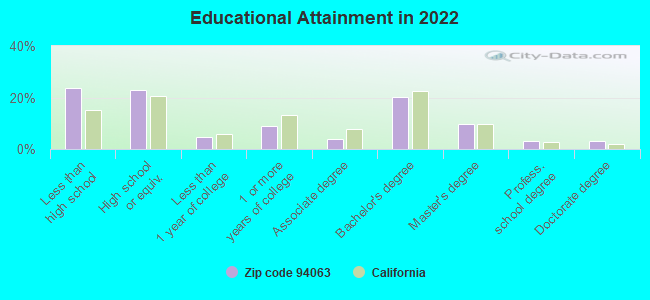
Private vs. public school enrollment:
Students in private schools in grades 1 to 8 (elementary and middle school): 209
Here:
6.3%
California:
10.5%
Students in private schools in grades 9 to 12 (high school): 205
Here:
11.9%
California:
8.5%
Students in private undergraduate colleges: 223
Here:
12.7%
California:
15.9%
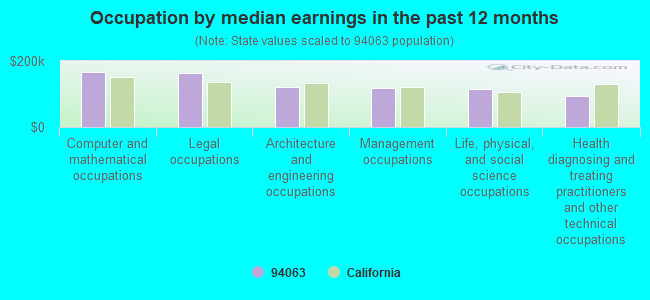
Occupation by median earnings in the past 12 months ($)
166,424Computer and mathematical occupations
164,521Legal occupations
121,503Architecture and engineering occupations
118,128Management occupations
113,708Life, physical, and social science occupations
94,154Health diagnosing and treating practitioners and other technical occupations
Companies with biggest federal contracts located in this zip code (REDWOOD CITY, CA):
BROADVISION, INC (585 BROADWAY) : $26,106,661 in 96 contractsfrom 2000 to 2006
Contracts for ADP Software, Equipment, and Telecommunications Training, ADP Software, Other ADP and Telecommunications Services (includes data storage on tapes, compact disks, etc.), Maintenance, Repair and Rebuilding of Equipment -- Miscellaneous, and moreby Air Force, Federal Technology Service, Federal Supply Service, United States Coast Guard (disused code: now 7008), and others Signed by year:2000: $201,937; 2001: $1,858,638; 2002: $13,033,439; 2003: $7,023,462; 2004: $2,858,846; 2005: $504,897; 2006: $625,442.
Biggest contracts:
$3,337,000 with Air Force for ADP Software, Equipment, and Telecommunications Training. Taking place in AL. Signed on 2002-03-01. Completion date: 2002-09-30.
$2,796,963 with Air Force for ADP Software, Equipment, and Telecommunications Training. Signed on 2002-12-01. Completion date: 2003-11-30.
$2,426,722, same as above.Signed on 2003-12-01. Completion date: 2004-12-01.
$2,380,972 with Air Force for ADP Software. Signed on 2004-11-30. Completion date: 2004-12-01.
AMPEX DATA SYSTEMS CORPORATION (1228 DOUGLAS AVE; small business) : $18,240,077 in 155 contractsfrom 1999 to 2006
Contracts for Video Recording and Reproducing Equipment, Combination and Miscellaneous Instruments, ADP Support Equipment, Electrical and Electronic Properties Measuring and Testing Instruments, and moreby Air Force, Navy, Department of Defense, Geological Survey, and others Signed by year:2000: $3,417,933; 2001: $1,033,351; 2002: $3,318,882; 2003: $5,268,015; 2004: $1,774,648; 2005: $1,862,817; 2006: $979,004.
Biggest contracts:
$1,848,000 with Air Force for Video Recording and Reproducing Equipment. Signed on 2003-05-30. Completion date: 2003-09-30.
$1,824,427 with Navy for Combination and Miscellaneous Instruments. Signed on 2000-04-03. Completion date: 2000-04-30.
$862,904 with Navy for ADP Support Equipment. Taking place in CO. Signed on 2002-09-26. Completion date: 2003-03-31.
$798,000, same as above.Signed on 2002-09-13. Completion date: 2003-03-31.
MAXYGEN, INC (515 GALVESTON DR; small business) : $7,975,300 in 7 contractsfrom 2000 to 2005
Contracts for Other Medical -- Basic Research (R&D), Other Defense -- Basic Research (R&D) by Army, Navy Signed by year:2000: $2,718,297; 2001: $0; 2002: $2,807,003; 2003: $0; 2004: $0; 2005: $2,450,000; 2006: $0.
Biggest contracts:
$2,450,000 with Army for Other Medical -- Basic Research (R&D). Signed on 2005-07-28. Completion date: 2006-07-31.
$2,300,000 with Navy for Other Defense -- Basic Research (R&D). Signed on 2002-03-19. Completion date: 2002-09-21.
$1,509,431, same as above.Signed on 2000-09-29. Completion date: 2002-09-21.
$892,718, same as above.Signed on 2000-12-04. Completion date: 2002-09-21.
GENOMIC HEALTH INC (301 PENOBSCOT DR) : $4,593,815 in 3 contractsfrom 2004 to 2006
$4,500,000 with National Institutes of Health for Drugs and Biologicals. Signed on 2005-11-04. Effective on 2005-11-15. Completion date: 2008-11-14.
$48,525 with Navy for Miscellaneous Items. Taking place in MD. Signed on 2004-10-01. Completion date: 2005-09-30.
$45,290 with Navy for Medical and Surgical Instruments, Equipment, and Supplies. Taking place in MD. Signed on 2006-04-18. Completion date: 2006-03-21.
SYNERGIA LLC (2400 BROADWAY, SUITE 203; small business) : $3,862,890 in 20 contractsfrom 1999 to 2006
Contracts for Defense Electronics and Communication Equipment -- Management and Support (R&D), Mathematical and Computer Sciences -- Applied Research and Exploratory Development (R&D), Other Defense -- Basic Research (R&D), Other Defense -- Advanced Development (R&D), and moreby Air Force, Army, Navy Signed by year:2000: $0; 2001: $99,967; 2002: $474,930; 2003: $996,973; 2004: $1,348,164; 2005: $370,000; 2006: $473,856.
Biggest contracts:
$749,970 with Air Force for Defense Electronics and Communication Equipment -- Management and Support (R&D). Signed on 2004-08-16. Completion date: 2006-06-13.
$375,000 with Air Force for Mathematical and Computer Sciences -- Applied Research and Exploratory Development (R&D). Signed on 2002-04-25. Completion date: 2004-02-01.
$374,989 with Air Force for Other Defense -- Basic Research (R&D). Signed on 2003-01-30. Completion date: 2004-02-01.
$273,881 with Air Force for Other Defense -- Advanced Development (R&D). Signed on 2006-04-14. Completion date: 2006-10-26.
SILICON GENETICS (2601 SPRING STREET; small business) : $352,500 in 10 contractsfrom 2001 to 2005
Contracts for ADP Software, ADP System Acquisition Support Services. Includes preparation of statement of work, benchmarks, specifications, etc., , ADP Components by National Institutes of Health, Army Signed by year:2000: $0; 2001: $79,000; 2002: $108,500; 2003: $27,000; 2004: $122,250; 2005: $15,750; 2006: $0.
Biggest contracts:
$99,000 with National Institutes of Health for ADP Software. Signed on 2004-09-05. Effective on 2004-09-02. Completion date: 2007-08-31.
$79,000 with National Institutes of Health for ADP Software. Taking place in MD. Signed on 2001-11-15. Completion date: 2001-11-15.
$40,750 with National Institutes of Health for ADP System Acquisition Support Services. Includes preparation of statement of work, benchmarks, specifications, etc.. Signed on 2002-12-15. Completion date: 2004-12-15.
$40,750 with National Institutes of Health for ADP System Acquisition Support Services. Includes preparation of statement of work, benchmarks, specifications, etc.. Taking place in MD. Signed on 2002-12-15. Completion date: 2004-12-15.
IPEDO INC (1001 MARSHALL FL 1; small business)
$116,000 with Navy for Automated Information System Design and Integration Services. Taking place in LA. Signed on 2002-09-19. Completion date: 2002-10-19.
ARGUS SOFTWARE, INC (791 MIDDLEFIELD ROAD; small business)
$80,233 with Army for ADP Software. Signed on 2001-12-27. Completion date: 2002-01-28.
A & D AUTOMATIC GATE CO (2490 MIDDLEFIELD RD; small business) : $50,187 in 6 contractsfrom 2002 to 2005
Contracts for Construction of Structures and Facilities -- Other Conservation and Development Facilities, Miscellaneous Electrical and Electronic Components, Guard Services, Quality Control Services -- Alarm, Signal, and Security Detection Systems, and moreby Bureau of Reclamation, Army, Public Buildings Service Signed by year:2000: $0; 2001: $0; 2002: $29,000; 2003: $6,274; 2004: $0; 2005: $14,913; 2006: $0.
Biggest contracts:
$29,000 with Bureau of Reclamation for Construction of Structures and Facilities -- Other Conservation and Development Facilities. Signed on 2002-07-15. Completion date: 2002-08-15.
$12,377 with Army for Miscellaneous Electrical and Electronic Components. Signed on 2005-09-11. Completion date: 2005-09-30.
$3,137 with Public Buildings Service for Guard Services. Signed on 2003-07-10. Completion date: 2003-07-30.
$3,137 with Public Buildings Service for Quality Control Services -- Alarm, Signal, and Security Detection Systems. Signed on 2003-07-15. Completion date: 2003-08-15.
NETOBJECTS INC (301 GALVESTON DR; small business)
$34,002 with Air Force for Education Services. Signed on 2000-06-29. Completion date: 2000-08-20.
Top industries in this zip code by the number of employees in 2005:
Professional, Scientific, and Technical Services: Research and Development in the Physical, Engineering, and Life Sciences (250-499: 1, 100-249: 2, 50-99: 2, 20-49: 6, 10-19: 2, 5-9: 3, 1-4: 1)
Health Care and Social Assistance: Offices of Physicians (except Mental Health Specialists) (500-999: 1, 10-19: 2, 5-9: 15, 1-4: 10)
Construction: Commercial and Institutional Building Construction (250-499: 1, 100-249: 1, 50-99: 1, 20-49: 3, 10-19: 5, 5-9: 1, 1-4: 4)
Health Care and Social Assistance: General Medical and Surgical Hospitals (500-999: 1)
2005 - 2018 National Fire Incident Reporting System (NFIRS) incidents
According to the data from the years 2005 - 2018 the average number of fire incidents per year is 89. The highest number of fire incidents - 139 took place in 2008, and the least - 14 in 2013. The data has an increasing trend.
When looking into fire subcategories, the most incidents belonged to: Structure Fires (39.0%), and Outside Fires (36.5%).
Fire incident types reported to NFIRS in Zip Code 94063


 Nearest zip codes: 94025, 94027, 94061, 94065, 94301, 94070.


 According to the data from the years 2005 - 2018 the average number of fire incidents per year is 89. The highest number of fire incidents - 139 took place in 2008, and the least - 14 in 2013. The data has an increasing trend.
 When looking into fire subcategories, the most incidents belonged to: Structure Fires (39.0%), and Outside Fires (36.5%).