Estimated zip code population in 2022: 47,590 Zip code population in 2010: 45,467 Zip code population in 2000: 45,483
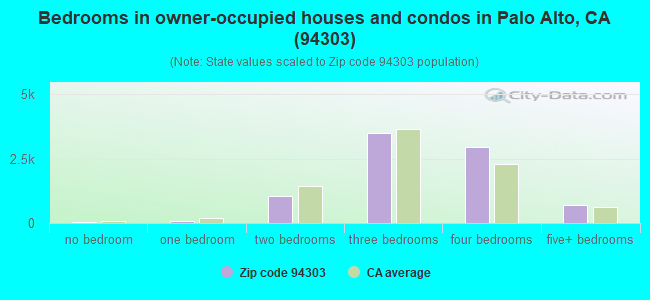
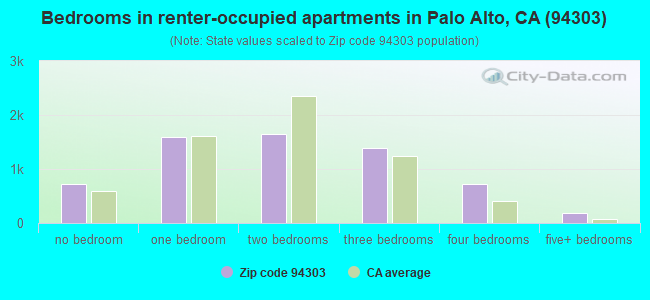
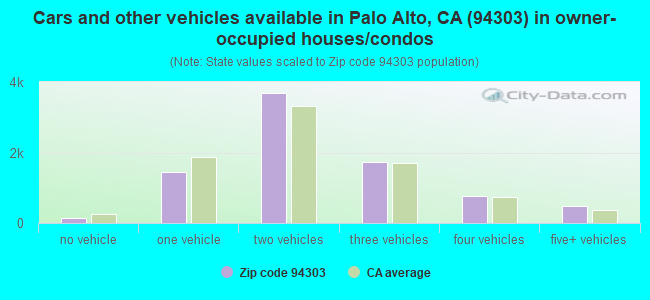
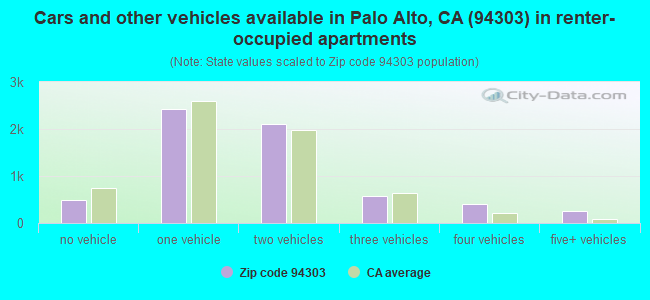
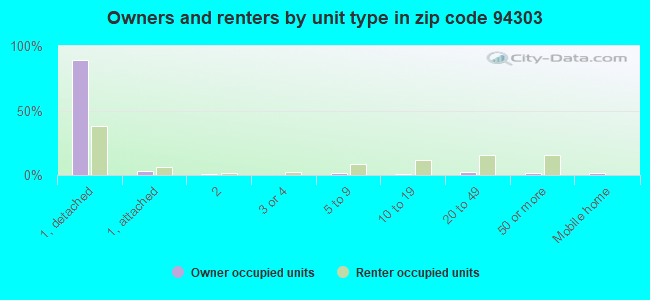
Houses and condos: 15,628 Renter-occupied apartments: 6,256
% of renters here:
43%
State:
44%
March 2022 cost of living index in zip code 94303: 127.4 (high, U.S. average is 100)
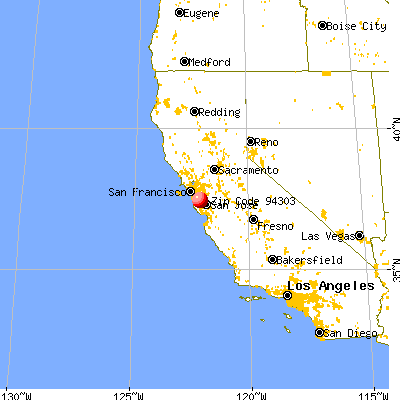
Land area: 8.0 sq. mi. Water area: 0.7 sq. mi.
Population density: 5,979 people per square mile
(average).
OSM Map
General Map
Google Map
MSN Map
OSM Map
General Map
Google Map
MSN Map
OSM Map
General Map
Google Map
MSN Map
OSM Map
General Map
Google Map
MSN Map
Please wait while loading the map...
Real estate property taxes paid for housing units in 2022:
This zip code:
0.5% ($8,727)
California:
0.7% ($4,831)
Median real estate property taxes paid for housing units with mortgages in 2022: $10,330 (0.6%) Median real estate property taxes paid for housing units with no mortgage in 2022: $6,781 (0.4%)
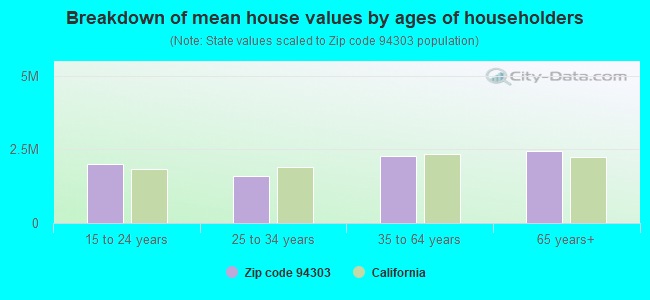
Estimated median house/condo value in 2022: $1,814,344
94303:
$1,814,344
California:
$715,900
According to our research of California and other state lists, there were 59 registered sex offenders living in 94303 zip code as of April 27, 2024. The ratio of all residents to sex offenders in zip code 94303 is 821 to 1. The ratio of registered sex offenders to all residents in this zip code is near the state average.
Median resident age:
This zip code:
38.0 years
California median age:
37.9 years
Average household size:
This zip code:
3.3 people
California:
2.8 people
Averages for the 2020 tax year for zip code 94303, filed in 2021:
Average Adjusted Gross Income (AGI) in 2020: $219,787 (Individual Income Tax Returns)
Here:
$219,787
State:
$95,910
Salary/wage: $167,281 (reported on 82.6% of returns)
Here:
$167,281
State:
$77,331
(% of AGI for various income ranges: 1365.9% for AGIs below $25k, 4498.1% for AGIs $25k-50k, 7405.6% for AGIs $50k-75k, 11003.6% for AGIs $75k-100k, 20572.9% for AGIs $100k-200k, 234823.0% for AGIs over 200k)
Taxable interest for individuals: $6,265 (reported on 39.2% of returns)
This zip code:
$6,265
California:
$2,294
(% of AGI for various income ranges: 19.5% for AGIs below $25k, 21.6% for AGIs $25k-50k, 48.7% for AGIs $50k-75k, 107.3% for AGIs $75k-100k, 271.9% for AGIs $100k-200k, 4774.8% for AGIs over 200k)
Ordinary dividends: $23,792 (reported on 30.5% of returns)
Here:
$23,792
State:
$10,949
(% of AGI for various income ranges: 45.8% for AGIs below $25k, 42.4% for AGIs $25k-50k, 134.6% for AGIs $50k-75k, 266.2% for AGIs $75k-100k, 1149.3% for AGIs $100k-200k, 13853.9% for AGIs over 200k)
Net capital gain/loss in AGI: +$146,118 (reported on 30.1% of returns)
Here:
+$146,118
State:
+$49,306
(% of AGI for various income ranges: 33.6% for AGIs below $25k, 55.7% for AGIs $25k-50k, 119.4% for AGIs $50k-75k, 249.8% for AGIs $75k-100k, 1277.1% for AGIs $100k-200k, 95649.9% for AGIs over 200k)
Profit/loss from business: +$23,567 (reported on 18.3% of returns)
Here:
+$23,567
State:
+$15,671
(% of AGI for various income ranges: 334.4% for AGIs below $25k, 285.3% for AGIs $25k-50k, 221.2% for AGIs $50k-75k, 423.5% for AGIs $75k-100k, 903.0% for AGIs $100k-200k, 5500.7% for AGIs over 200k)
Taxable individual retirement arrangement distribution: $34,515 (reported on 6.6% of returns)
94303:
$34,515
California:
$23,505
(% of AGI for various income ranges: 41.8% for AGIs below $25k, 65.2% for AGIs $25k-50k, 128.7% for AGIs $50k-75k, 339.6% for AGIs $75k-100k, 1137.7% for AGIs $100k-200k, 2618.5% for AGIs over 200k)
Self-employed (Keogh) retirement plans: $37,651 (reported on 1.6% of returns)
94303:
$37,651
California:
$30,163
(% of AGI for various income ranges: 23.9% for AGIs $50k-75k, 99.4% for AGIs $100k-200k, 1166.5% for AGIs over 200k)
Total itemized deductions: $51,230 (reported on 18.8% of returns)
Here:
$51,230
State:
$39,517
(% of AGI for various income ranges: 122.1% for AGIs below $25k, 218.9% for AGIs $25k-50k, 420.3% for AGIs $50k-75k, 931.4% for AGIs $75k-100k, 2446.7% for AGIs $100k-200k, 15324.3% for AGIs over 200k)
Charity contributions: $23,659 (reported on 15.8% of returns)
Here:
$23,659
State:
$12,598
(% of AGI for various income ranges: 6.2% for AGIs below $25k, 25.0% for AGIs $25k-50k, 57.8% for AGIs $50k-75k, 123.6% for AGIs $75k-100k, 418.3% for AGIs $100k-200k, 7432.9% for AGIs over 200k)
Taxes paid: $9,186 (reported on 18.8% of returns)
94303:
$9,186
State:
$8,807
(% of AGI for various income ranges: 29.5% for AGIs below $25k, 47.3% for AGIs $25k-50k, 98.6% for AGIs $50k-75k, 250.8% for AGIs $75k-100k, 626.4% for AGIs $100k-200k, 2315.4% for AGIs over 200k)
Earned income credit: $2,058 (reported on 10.3% of returns)
Here:
$2,058
State:
$2,074
(% of AGI for various income ranges: 88.9% for AGIs below $25k, 54.9% for AGIs $25k-50k, 0.7% for AGIs $50k-75k)
Percentage of individuals using paid preparers for their 2020 taxes: 90.3%
Here:
90%
State:
92%
(% for various income ranges: 87.1% for AGIs below $25k, 90.4% for AGIs $25k-50k, 91.1% for AGIs $50k-75k, 91.9% for AGIs $75k-100k, 91.7% for AGIs $100k-200k, 92.4% for AGIs over 200k)
Averages for the 2012 tax year for zip code 94303, filed in 2013:
Average Adjusted Gross Income (AGI) in 2012: $191,820 (Individual Income Tax Returns)
Here:
$191,820
State:
$72,726
Salary/wage: $120,240 (reported on 83.3% of returns)
Here:
$120,240
State:
$59,079
(% of AGI for various income ranges: 78.3% for AGIs below $25k, 84.4% for AGIs $25k-50k, 78.4% for AGIs $50k-75k, 72.7% for AGIs $75k-100k, 70.3% for AGIs $100k-200k, 45.9% for AGIs over 200k)
Taxable interest for individuals: $8,966 (reported on 38.3% of returns)
This zip code:
$8,966
California:
$2,146
(% of AGI for various income ranges: 0.7% for AGIs below $25k, 0.5% for AGIs $25k-50k, 0.7% for AGIs $50k-75k, 1.0% for AGIs $75k-100k, 1.0% for AGIs $100k-200k, 2.1% for AGIs over 200k)
Ordinary dividends: $30,558 (reported on 27.7% of returns)
Here:
$30,558
State:
$9,308
(% of AGI for various income ranges: 1.9% for AGIs below $25k, 1.3% for AGIs $25k-50k, 2.0% for AGIs $50k-75k, 2.8% for AGIs $75k-100k, 4.2% for AGIs $100k-200k, 4.8% for AGIs over 200k)
Net capital gain/loss in AGI: +$103,010 (reported on 26.6% of returns)
Here:
+$103,010
State:
+$30,460
(% of AGI for various income ranges: 0.7% for AGIs below $25k, 0.5% for AGIs $25k-50k, 0.4% for AGIs $50k-75k, 1.5% for AGIs $75k-100k, 2.3% for AGIs $100k-200k, 17.7% for AGIs over 200k)
Profit/loss from business: +$26,873 (reported on 17.7% of returns)
Here:
+$26,873
State:
+$17,064
(% of AGI for various income ranges: 12.9% for AGIs below $25k, 5.6% for AGIs $25k-50k, 4.4% for AGIs $50k-75k, 5.2% for AGIs $75k-100k, 4.4% for AGIs $100k-200k, 1.6% for AGIs over 200k)
Taxable individual retirement arrangement distribution: $33,507 (reported on 8.3% of returns)
94303:
$33,507
California:
$19,557
(% of AGI for various income ranges: 1.4% for AGIs below $25k, 1.7% for AGIs $25k-50k, 3.0% for AGIs $50k-75k, 4.0% for AGIs $75k-100k, 4.9% for AGIs $100k-200k, 0.9% for AGIs over 200k)
Self-employment retirement plans: $27,895 (reported on 2.0% of returns)
94303:
$27,895
California:
$24,530
(% of AGI for various income ranges: 0.6% for AGIs below $25k, 0.2% for AGIs $50k-75k, 0.3% for AGIs $75k-100k, 0.5% for AGIs $100k-200k, 0.3% for AGIs over 200k)
Total itemized deductions: $71,829 (16% of AGI, reported on 37.8% of returns)
Here:
$71,829
State:
$34,004
Here:
15.7% of AGI
State:
22.7% of AGI
(% of AGI for various income ranges: 10.7% for AGIs below $25k, 10.2% for AGIs $25k-50k, 15.3% for AGIs $50k-75k, 17.3% for AGIs $75k-100k, 19.6% for AGIs $100k-200k, 13.8% for AGIs over 200k)
Charity contributions: $18,827 (reported on 30.7% of returns)
Here:
$18,827
State:
$4,659
(% of AGI for various income ranges: 0.5% for AGIs below $25k, 0.8% for AGIs $25k-50k, 1.6% for AGIs $50k-75k, 1.6% for AGIs $75k-100k, 2.2% for AGIs $100k-200k, 3.4% for AGIs over 200k)
Taxes paid: $49,565 (reported on 37.5% of returns)
94303:
$49,565
State:
$14,448
(% of AGI for various income ranges: 2.3% for AGIs below $25k, 2.4% for AGIs $25k-50k, 4.6% for AGIs $50k-75k, 6.3% for AGIs $75k-100k, 8.7% for AGIs $100k-200k, 10.7% for AGIs over 200k)
Earned income credit: $2,364 (reported on 14.7% of returns)
Here:
$2,364
State:
$2,286
(% of AGI for various income ranges: 5.8% for AGIs below $25k, 1.0% for AGIs $25k-50k)
Percentage of individuals using paid preparers for their 2012 taxes: 61.3%
Here:
61%
State:
64%
(% for various income ranges: 63.4% for AGIs below $25k, 66.3% for AGIs $25k-50k, 59.8% for AGIs $50k-75k, 58.5% for AGIs $75k-100k, 52.7% for AGIs $100k-200k, 56.5% for AGIs over 200k)
Averages for the 2004 tax year for zip code 94303, filed in 2005:
Average Adjusted Gross Income (AGI) in 2004: $86,820 (Individual Income Tax Returns)
Here:
$86,820
State:
$58,600
Salary/wage: $70,219 (reported on 82.2% of returns)
Here:
$70,219
State:
$49,455
(% of AGI for various income ranges: 167.2% for AGIs below $10k, 79.4% for AGIs $10k-25k, 83.8% for AGIs $25k-50k, 77.3% for AGIs $50k-75k, 72.4% for AGIs $75k-100k, 60.9% for AGIs over 100k)
Taxable interest for individuals: $2,816 (reported on 48.2% of returns)
This zip code:
$2,816
California:
$2,365
(% of AGI for various income ranges: 7.7% for AGIs below $10k, 1.7% for AGIs $10k-25k, 1.1% for AGIs $25k-50k, 1.6% for AGIs $50k-75k, 1.6% for AGIs $75k-100k, 1.6% for AGIs over 100k)
Taxable dividends: $6,888 (reported on 33.2% of returns)
Here:
$6,888
State:
$4,746
(% of AGI for various income ranges: 12.8% for AGIs below $10k, 2.0% for AGIs $10k-25k, 1.4% for AGIs $25k-50k, 2.2% for AGIs $50k-75k, 3.2% for AGIs $75k-100k, 2.8% for AGIs over 100k)
Net capital gain/loss: +$40,160 (reported on 30.1% of returns)
Here:
+$40,160
State:
+$23,418
(% of AGI for various income ranges: -1.1% for AGIs below $10k, 0.3% for AGIs $10k-25k, 0.6% for AGIs $25k-50k, 1.0% for AGIs $50k-75k, 2.4% for AGIs $75k-100k, 19.2% for AGIs over 100k)
Profit/loss from business: +$24,831 (reported on 16.8% of returns)
Here:
+$24,831
State:
+$16,826
(% of AGI for various income ranges: 3.3% for AGIs below $10k, 6.9% for AGIs $10k-25k, 4.8% for AGIs $25k-50k, 4.5% for AGIs $50k-75k, 5.0% for AGIs $75k-100k, 4.7% for AGIs over 100k)
IRA payment deduction: $3,348 (reported on 2.5% of returns)
94303:
$3,348
California:
$3,192
(% of AGI for various income ranges: 0.4% for AGIs below $10k, 0.1% for AGIs $10k-25k, 0.2% for AGIs $25k-50k, 0.2% for AGIs $50k-75k, 0.2% for AGIs $75k-100k, 0.1% for AGIs over 100k)
Self-employed pension: $18,989 (reported on 2.8% of returns)
Here:
$18,989
California:
$17,688
(% of AGI for various income ranges: 0.6% for AGIs below $10k, 0.2% for AGIs $25k-50k, 0.3% for AGIs $50k-75k, 0.5% for AGIs $75k-100k, 0.7% for AGIs over 100k)
Total itemized deductions: $35,664 (21% of AGI, reported on 42.4% of returns)
Here:
$35,664
State:
$28,113
Here:
21.3% of AGI
State:
25.3% of AGI
(% of AGI for various income ranges: 29.7% for AGIs below $10k, 14.2% for AGIs $10k-25k, 17.7% for AGIs $25k-50k, 23.5% for AGIs $50k-75k, 21.8% for AGIs $75k-100k, 16.4% for AGIs over 100k)
Charity contributions deductions: $5,434 (3% of AGI, reported on 36.6% of returns)
Here:
$5,434
State:
$3,923
Here:
3.0% of AGI
State:
3.3% of AGI
(% of AGI for various income ranges: 1.1% for AGIs below $10k, 1.1% for AGIs $10k-25k, 1.4% for AGIs $25k-50k, 2.3% for AGIs $50k-75k, 2.4% for AGIs $75k-100k, 2.5% for AGIs over 100k)
Total tax: $19,628 (reported on 72.5% of returns)
94303:
$19,628
State:
$10,761
(% of AGI for various income ranges: 6.2% for AGIs below $10k, 3.6% for AGIs $10k-25k, 5.9% for AGIs $25k-50k, 8.7% for AGIs $50k-75k, 10.9% for AGIs $75k-100k, 20.1% for AGIs over 100k)
Earned income credit: $1,720 (reported on 12.3% of returns)
Here:
$1,720
State:
$1,763
Percentage of individuals using paid preparers for their 2004 taxes: 63.1%
Here:
63%
State:
66%
(% for various income ranges: 55.9% for AGIs below $10k, 71.3% for AGIs $10k-25k, 69.4% for AGIs $25k-50k, 63.9% for AGIs $50k-75k, 57.8% for AGIs $75k-100k, 54.1% for AGIs over 100k)
Likely homosexual households (counted as self-reported same-sex unmarried-partner households)
Lesbian couples: 0.2% of all households
Gay men: 0.1% of all households
Household received Food Stamps/SNAP in the past 12 months: 1,273 Household did not receive Food Stamps/SNAP in the past 12 months: 13,131
Women who had a birth in the past 12 months: 334 (226 now married, 108 unmarried) Women who did not have a birth in the past 12 months: 11,090 (4,903 now married, 6,166 unmarried)
Housing units in zip code 94303 with a mortgage: 5,261 (658 second mortgage, 8 home equity loan, 574 both second mortgage and home equity loan) Houses without a mortgage: 45
Median monthly owner costs for units with a mortgage: $3,876 Median monthly owner costs for units without a mortgage: $1,083
Residents with income below the poverty level in 2022:
This zip code:
8.3%
Whole state:
12.2%
Residents with income below 50% of the poverty level in 2022:
This zip code:
4.6%
Whole state:
6.2%
Median number of rooms in houses and condos:
Here:
6.1
State:
6.0
Median number of rooms in apartments:
Here:
3.9
State:
3.9
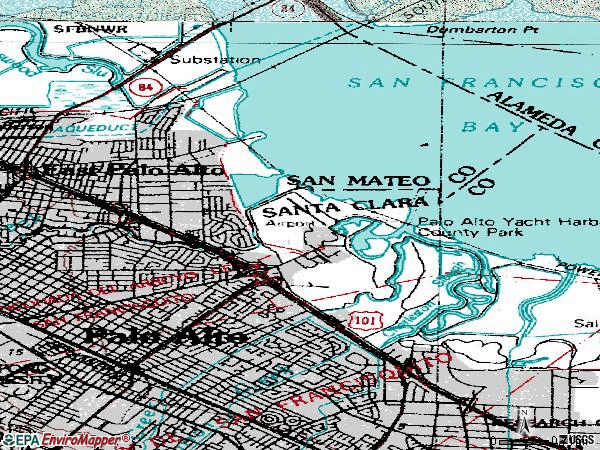
Notable locations in this zip code not listed on our city pages
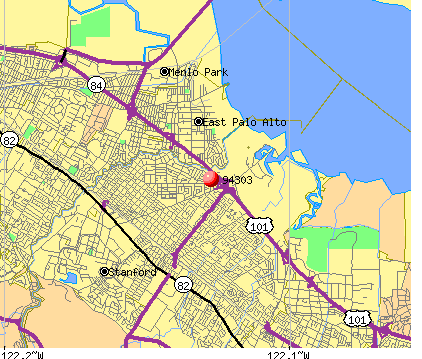
Notable locations in zip code 94303: Regional Water Quality Control Plant (A), Palo Alto City Landfill (B), Palo Alto Yacht Club (C), Los Altos Sewage Disposal Plant (D), Palo Alto Municipal Golf Course (E), East Palo Alto City Hall (F), East Palo Alto Branch San Mateo County Library (G), Palo Alto Main Library (H), Palo Alto Unified School District Instructional Materials Center (I), Peninsula Conservation Center Foundation Library (J), Pacific Graduate School of Psychological Research Library (K), Mitchell Park Branch Palo Alto City Library (L), Baylands Nature Interpretive Center (M), Baylands Athletic Center (N), Palo Alto Unified School District Instructional Material Center (O), First Congregational Church Library (P), Menlo Park Fire Protection District Station 2 (Q), Palo Alto Fire Department Station 4 (R). Display/hide their locations on the map
Shopping Centers: Edgewood Plaza Shopping Center (1), Ravenswood Shopping Center (2), University Village Shopping Center (3). Display/hide their locations on the map
Churches in zip code 94303 include: Peninsula Bible Church (A), Palo Alto Church of Christ (B), Covenant Presbyterian Church (C), First Congregational Church (D), Chadbad of Greater South Bay (E), Chabad of Greater South Bay (F), Keddem Congregation Synagogue (G), Saint Mark's Missionary Baptist Church (H), Saint John Baptist Church (I). Display/hide their locations on the map
7,694 married couples with children.
2,105 single-parent households (651 men, 1,454 women).
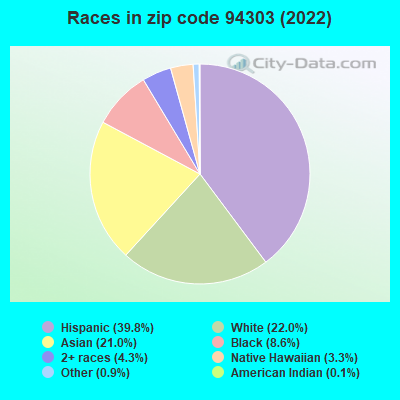
42.1% of residents of 94303 zip code speak English at home.
32.7% of residents speak Spanish at home (64% very well, 18% well, 14% not well, 4% not at all).
8.6% of residents speak other Indo-European language at home (70% very well, 28% well, 2% not well).
16.0% of residents speak Asian or Pacific Island language at home (68% very well, 24% well, 7% not well, 1% not at all).
0.6% of residents speak other language at home (92% very well, 8% well).
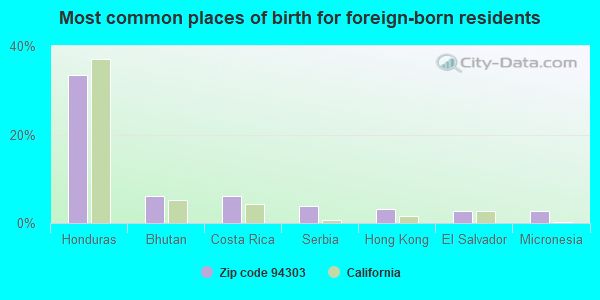
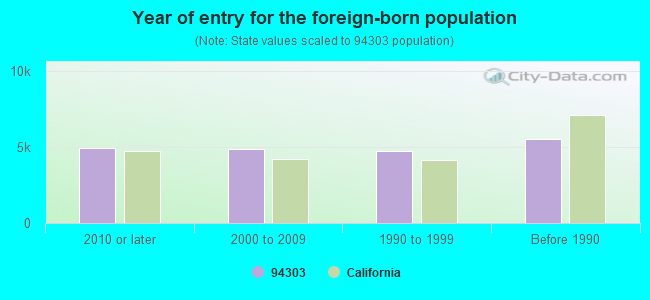
Foreign born population: 18,947 (39.8%) (51.2% of them are naturalized citizens)
Major facilities with environmental interests located in this zip code:
LORAL CORPORATION SPACE SYSTEMS LORAL (3825 FABIAN WAY in PALO ALTO, CA)
STATE MASTER (California - Hazardous Waste Tracking) - HAZARDOU WASTE PROGRAM COMPLIANCE ACTIVITY (Tracking inspections of insecticide, fungicide, and rodenticide, and toxic substances) CRITERIA AND HAZARDOUS AIR POLLUTANT INVENTORY (Inventory of air pollution sources) HAZARDOUS WASTE BIENNIAL REPORTER (Resource Conservation and Recovery Act (tracking hazardous waste)) - ICIS-, ENFORCEMENT/COMPLIANCE ACTIVITY Large Quantity Generators, more that 1000 kg of hazardous waste/month (Resource Conservation and Recovery Act (tracking hazardous waste)) - ICIS-, ENFORCEMENT/COMPLIANCE ACTIVITY TSD (Resource Conservation and Recovery Act (tracking hazardous waste)) - ICIS-, ENFORCEMENT/COMPLIANCE ACTIVITY TRI REPORTER (Tracking of toxic chemicals releasing facilities) Business SIC classification: RADIO AND TELEVISION BROADCASTING AND COMMUNICATIONS EQUIPMENT; COMMUNICATIONS EQUIPMENT Business NAICS classification: GUIDED MISSILE AND SPACE VEHICLE MANUFACTURING. Alternative names: FORD AEROSPACE CORP, FORD AEROSPACE - SPACE SYSTEMS DIVISION
HEWLETT PACKARD COMPANY (3500 DEER CREEK ROAD in PALO ALTO, CA)
STATE MASTER (California - Hazardous Waste Tracking) - HAZARDOU WASTE PROGRAM COMPLIANCE ACTIVITY (Tracking inspections of insecticide, fungicide, and rodenticide, and toxic substances) CRITERIA AND HAZARDOUS AIR POLLUTANT INVENTORY (Inventory of air pollution sources) HAZARDOUS WASTE BIENNIAL REPORTER (Resource Conservation and Recovery Act (tracking hazardous waste)) Large Quantity Generators, more that 1000 kg of hazardous waste/month (Resource Conservation and Recovery Act (tracking hazardous waste)) Small Quantity Generators, between 100 kg and 1000 kg of hazardous waste/month (Resource Conservation and Recovery Act (tracking hazardous waste)) - notification TSD (Resource Conservation and Recovery Act (tracking hazardous waste)) Business SIC classification: INSTRUMENTS FOR MEASURING AND TESTING OF ELECTRICITY AND ELECTRICAL SIGNALS; MEASURING AND CONTROLLING DEVICES Business NAICS classification: INSTRUMENT MANUFACTURING FOR MEASURING AND TESTING ELECTRICITY AND ELECTRICAL SIGNALS. Organizations: DARLENE SOLOMON (CONTACT/OPERATOR)
, HEWLETT-PACKARD COMPANY (CONTACT/OWNER)
, AGILENT (CONTACT/OWNER)
Alternative names: AGILENT TECHNOLOGIES INC, HEWLETT-PACKARD CO, OPTOELECTR, HEWLETT PACKARD LABORATORIES, HEWLETT PACKARD LABORATORIES DIV
HEWLETT PACKARD STANFORD PARK DIVISION (1501 PAGE MILL ROAD in PALO ALTO, CA)
SUPERFUND (Superfund database) STATE MASTER (California - Hazardous Waste Tracking) - HAZARDOU WASTE PROGRAM COMPLIANCE ACTIVITY (Tracking inspections of insecticide, fungicide, and rodenticide, and toxic substances) CRITERIA AND HAZARDOUS AIR POLLUTANT INVENTORY (Inventory of air pollution sources) HAZARDOUS WASTE BIENNIAL REPORTER (Resource Conservation and Recovery Act (tracking hazardous waste)) Large Quantity Generators, more that 1000 kg of hazardous waste/month (Resource Conservation and Recovery Act (tracking hazardous waste)) TSD (Resource Conservation and Recovery Act (tracking hazardous waste)) TRI REPORTER (Tracking of toxic chemicals releasing facilities) Business SIC classification: COMMUNICATIONS EQUIPMENT; ELECTRONIC COMPONENTS; INSTRUMENTS FOR MEASURING AND TESTING OF ELECTRICITY AND ELECTRICAL SIGNALS Business NAICS classification: OTHER COMPUTER RELATED SERVICES. Organizations: STANFORD LANDS MANAGEMENT (CONTACT/OWNER)
Alternative names: HEWLETT-PACKARD, HEWLETT PACKARD/1501, HEWLETT PACKARD - 1501 PAGE MILL ROAD, HEWLETT-PACKARD CO. STANFORD PARK DIV., HEWLETT PACKARD STANFORD PK DIV
CATALYTICA BAY VIEW INCORPORATED (1990 BAY RD. in EAST PALO ALTO, CA)
(Integrated Compliance Information System) - ICIS-09-1999-0101, FORMAL ENFORCEMENT ACTION COMPLIANCE ACTIVITY (Tracking inspections of insecticide, fungicide, and rodenticide, and toxic substances) CRITERIA AND HAZARDOUS AIR POLLUTANT INVENTORY (Inventory of air pollution sources) HAZARDOUS WASTE BIENNIAL REPORTER (Resource Conservation and Recovery Act (tracking hazardous waste)) Large Quantity Generators, more that 1000 kg of hazardous waste/month (Resource Conservation and Recovery Act (tracking hazardous waste)) TRI REPORTER (Tracking of toxic chemicals releasing facilities) Business SIC classification: MEDICINAL CHEMICALS AND BOTANICAL PRODUCTS; INDUSTRIAL ORGANIC CHEMICALS; AMUSEMENT AND RECREATION SERVICES Business NAICS classification: MEDICINAL AND BOTANICAL MANUFACTURING. Alternative names: CATALYTICA INC, CATALYTICA BAYVIEW INC
MEDLUMINAL SYSTEMS (2454 EMBARCADERO WAY in PALO ALTO, CA)
STATE MASTER (California - Hazardous Waste Tracking) - HAZARDOU WASTE PROGRAM Small Quantity Generators, between 100 kg and 1000 kg of hazardous waste/month (Resource Conservation and Recovery Act (tracking hazardous waste)) Organizations: RVS INC (CONTACT/OPERATOR)
Alternative names: RVS INC
CAL SPRAY INCORPORATED (1905 BAY ROAD in EAST PALO ALTO, CA)
STATE MASTER (California - Hazardous Waste Tracking) - HAZARDOU WASTE PROGRAM CRITERIA AND HAZARDOUS AIR POLLUTANT INVENTORY (Inventory of air pollution sources) Small Quantity Generators, between 100 kg and 1000 kg of hazardous waste/month (Resource Conservation and Recovery Act (tracking hazardous waste)) - notification Business SIC classification: PREFABRICATED METAL BUILDINGS AND COMPONENTS Organizations: JOHN GARCIA (CONTACT/OWNER)
1060 WEEKS STREET (1060 WEEKS ST in EAST PALO ALTO, CA)
STATE MASTER (California - Hazardous Waste Tracking) - HAZARDOU WASTE PROGRAM Small Quantity Generators, between 100 kg and 1000 kg of hazardous waste/month (Resource Conservation and Recovery Act (tracking hazardous waste)) Organizations: WEEKS ST LLC (CONTACT/OPERATOR)
INFINITY SALVAGE (2091 BAY RD in EAST PALO ALTO, CA)
STATE MASTER (California - Hazardous Waste Tracking) - HAZARDOU WASTE PROGRAM Small Quantity Generators, between 100 kg and 1000 kg of hazardous waste/month (Resource Conservation and Recovery Act (tracking hazardous waste)) - notification Organizations: BAKER MICHAEL (CONTACT/OWNER)
ANTIFREEZE ENVIRONMENTAL SVC CORP (2081 BAY RD STE A BLDG 2 in EAST PALO ALTO, CA)
STATE MASTER (California - Hazardous Waste Tracking) - HAZARDOU WASTE PROGRAM TRANSPORTER (Resource Conservation and Recovery Act (tracking hazardous waste)) - notification Organizations: SCHNEIDER HM (CONTACT/OWNER)
JORDAN (DAVID STARR) MIDDLE (750 N. CALIFORNIA AVE. in PALO ALTO, CA)
COMPLIANCE ACTIVITY (Tracking inspections of insecticide, fungicide, and rodenticide, and toxic substances) (National Center for Education Statistics) - STATE ID-6060065 Organizations: PALO ALTO UNIFIED (SCHOOL DISTRICT)
Alternative names: JORDAN MIDDLE SCHOOL
EQUILON ENTERPRISES (811 CHARLESTON in PALO ALTO, CA) . Federal Facility
STATE MASTER (California - Hazardous Waste Tracking) - HAZARDOU WASTE PROGRAM Small Quantity Generators, between 100 kg and 1000 kg of hazardous waste/month (Resource Conservation and Recovery Act (tracking hazardous waste)) - notification Organizations: EQUILON ENTERPRISES, LLC (CONTACT/OWNER)
Alternative names: SHELL OIL CO
ALEXZA MOLECULAR DELIVERY CORP (1001 E MEADOW CIR in PALO ALTO, CA)
STATE MASTER (California - Hazardous Waste Tracking) - HAZARDOU WASTE PROGRAM Small Quantity Generators, between 100 kg and 1000 kg of hazardous waste/month (Resource Conservation and Recovery Act (tracking hazardous waste)) - notification Organizations: CALIF PACIFIC COMMERCIAL (CONTACT/OWNER)
EQUILON ENTERPRISES (1161 EMBARCADERO in PALO ALTO, CA) . Federal Facility
STATE MASTER (California - Hazardous Waste Tracking) - HAZARDOU WASTE PROGRAM Small Quantity Generators, between 100 kg and 1000 kg of hazardous waste/month (Resource Conservation and Recovery Act (tracking hazardous waste)) - notification Organizations: EQUILON ENTERPRISES, LLC (CONTACT/OWNER)
Alternative names: SHELL OIL CO
Housing units lacking complete plumbing facilities: 0.5% Housing units lacking complete kitchen facilities: 1.0%
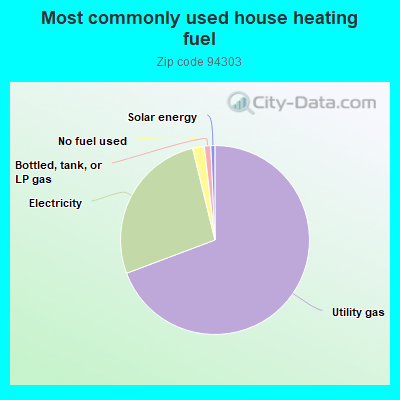
69.0%Utility gas
26.8%Electricity
2.0%No fuel used
1.1%Bottled, tank, or LP gas
0.7%Solar energy
Population in 1990: 35,680. Population change in the 1990s: +9,803 (+27.5%).
Place of birth for U.S.-born residents:
This state: 21,156
Northeast: 1,831
Midwest: 1,810
South: 2,109
West: 692
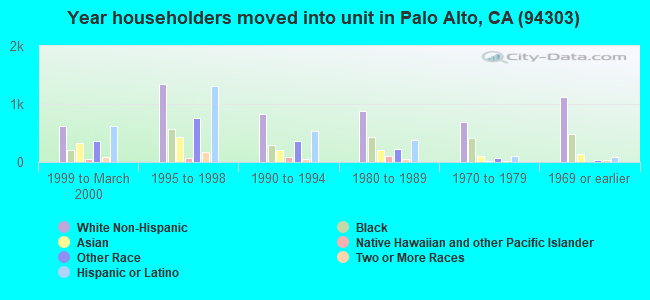
62% of the 94303 zip code residents lived in the same house 5 years ago. Out of people who lived in different houses, 59% lived in this county. Out of people who lived in different counties, 50% lived in California.
90% of the 94303 zip code residents lived in the same house 1 year ago. Out of people who lived in different houses, 44% moved from this county. Out of people who lived in different houses, 27% moved from different county within same state. Out of people who lived in different houses, 13% moved from different state. Out of people who lived in different houses, 20% moved from abroad.
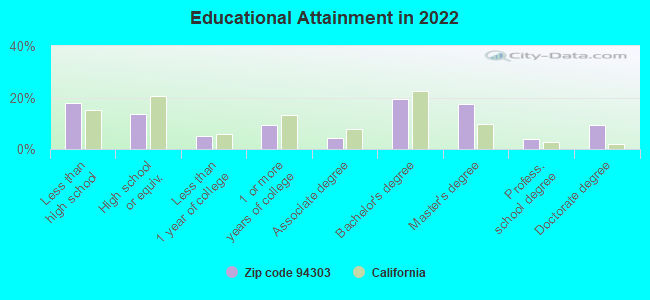
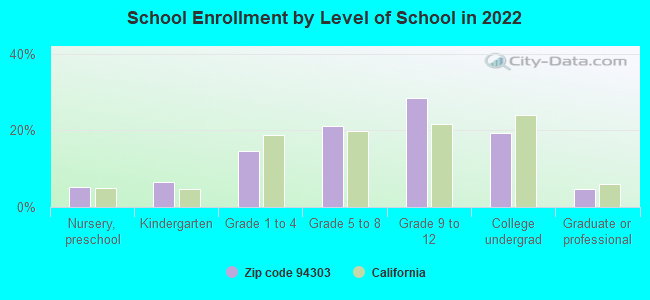
Private vs. public school enrollment:
Students in private schools in grades 1 to 8 (elementary and middle school): 652
Here:
14.7%
California:
10.5%
Students in private schools in grades 9 to 12 (high school): 556
Here:
15.8%
California:
8.5%
Students in private undergraduate colleges: 489
Here:
20.2%
California:
15.9%
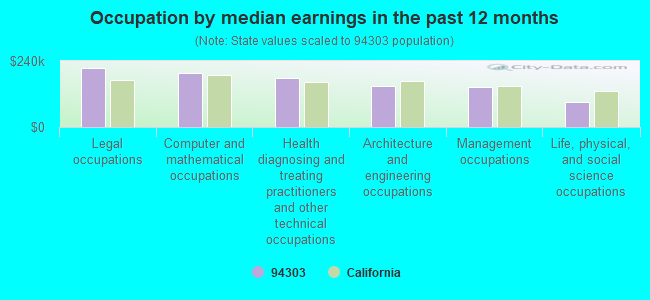
Occupation by median earnings in the past 12 months ($)
214,951Legal occupations
195,188Computer and mathematical occupations
178,283Health diagnosing and treating practitioners and other technical occupations
148,716Architecture and engineering occupations
145,932Management occupations
89,216Life, physical, and social science occupations
Companies with biggest federal contracts located in this zip code (PALO ALTO, CA):
COMMUNICATIONS & POWER INDUSTR (811 HANSEN WAY) : $104,247,581 in 295 contractsfrom 1999 to 2006
Contracts for Radar Equipment, Except Airborne, Electron Tubes and Associated Hardware, Maintenance, Repair and Rebuilding of Equipment -- Communication, Detection, and Coherent Radiation Equipment, Weapons -- Advanced Development (R&D), and moreby Navy, Army, Air Force, Defense Logistics Agency, and others Signed by year:2000: $290,376; 2001: $7,644,635; 2002: $14,132,730; 2003: $31,202,833; 2004: $20,131,001; 2005: $16,213,542; 2006: $14,445,543.
Biggest contracts:
$8,424,647 with Navy for Radar Equipment, Except Airborne. Signed on 2003-09-30. Completion date: 2008-09-30.
$7,033,170 with Navy for Electron Tubes and Associated Hardware. Signed on 2006-05-26. Completion date: 2007-09-30.
$4,938,004, same as above.Signed on 2003-05-22. Completion date: 2004-12-31.
$4,574,964, same as above.Signed on 2004-09-29. Completion date: 2006-04-04.
TEKNOWLEDGE CORPORATION (1800 EMBARCADERO RD; small business) : $32,462,379 in 99 contractsfrom 1999 to 2006
Contracts for Mathematical and Computer Sciences -- Basic Research (R&D), Other Defense -- Applied Research and Exploratory Development (R&D), Services -- Basic Research (R&D), Other Defense -- Advanced Development (R&D), and moreby Navy, Air Force, Army, Department of Defense, and others Signed by year:2000: $7,361,472; 2001: $9,946,163; 2002: $5,606,699; 2003: $4,576,894; 2004: $688,575; 2005: $107,327; 2006: $349,860.
Biggest contracts:
$3,380,622 with Navy for Mathematical and Computer Sciences -- Basic Research (R&D). Signed on 1999-12-10. Completion date: 2000-12-09.
$3,128,031, same as above.Signed on 2001-03-16. Completion date: 2001-12-31.
$1,322,232 with Air Force for Other Defense -- Applied Research and Exploratory Development (R&D). Signed on 2001-02-06. Completion date: 2002-12-31.
$1,211,887, same as above.Signed on 2003-02-27. Completion date: 2003-10-02.
COMMUNICATIONS & POWER INDUSTR (811 HANSEN WAY) : $23,147,211 in 110 contractsfrom 1999 to 2005
Contracts for Defense Missile and Space Systems -- Engineering Development (R&D), Electron Tubes and Associated Hardware, Weapons -- Management and Support (R&D), Miscellaneous Communication Equipment, and moreby Air Force, Navy Signed by year:2000: $9,993,717; 2001: $11,660,298; 2002: $0; 2003: $0; 2004: $616,905; 2005: $425,157; 2006: $0.
Biggest contracts:
$1,810,302 with Air Force for Defense Missile and Space Systems -- Engineering Development (R&D). Taking place in MA. Signed on 2000-02-16. Completion date: 2001-08-31.
$1,400,000, same as above.Signed on 2001-03-16. Completion date: 2002-01-31.
$1,279,120 with Navy for Electron Tubes and Associated Hardware. Signed on 2001-05-14. Completion date: 2002-08-30.
$1,250,000 with Air Force for Defense Missile and Space Systems -- Engineering Development (R&D). Taking place in MA. Signed on 2001-03-16. Completion date: 2001-08-31.
ANACOR PHARMACEUTICALS, INC (1060 E MEADOW CIRCLE; small business) : $16,103,616 in 2 contractsfrom 2002 to 2003
$8,632,170 with Army for Agriculture Insect and Disease Control -- Basic Research (R&D). Signed on 2002-09-27. Completion date: 2003-09-29.
$7,471,446, same as above.Signed on 2003-06-30. Completion date: 2004-09-29.
SPACE SYSTEMS/LORAL INC (3825 FABIAN WAY) : $10,797,518 in 15 contractsfrom 2000 to 2006
Contracts for Modification of Equipment -- Miscellaneous, Feasibility Studies (non-construction), Space Flight -- Engineering Development (R&D), Aeronautics and Space Technology -- Applied Research and Exploratory Development (R&D), and moreby Air Force, National Oceanic and Atmospheric Administration/Under Secretary for Oceans and Atmosphere, NASA, Defense Advanced Research Projects Agency, and others Signed by year:2000: $6,950,074; 2001: $290,000; 2002: -$13,000; 2003: $2,000,000; 2004: $0; 2005: $925,000; 2006: $645,444.
Biggest contracts:
$2,808,415 with Air Force for Modification of Equipment -- Miscellaneous. Taking place in CO. Signed on 2000-06-05. Completion date: 2000-09-30.
$2,119,888, same as above.Signed on 2000-02-08. Completion date: 2000-09-30.
$2,000,000 with National Oceanic and Atmospheric Administration/Under Secretary for Oceans and Atmosphere for Feasibility Studies (non-construction). Taking place in DC. Signed on 2003-10-27. Completion date: 2004-10-26.
$1,111,500 with Air Force for Modification of Equipment -- Miscellaneous. Taking place in CO. Signed on 2000-05-05. Completion date: 2000-09-30.
COMMUNICATIONS & POWER INDUSTR (3120 HANSEN WAY; small business) : $8,883,338 in 60 contractsfrom 1999 to 2005
Contracts for Electron Tubes and Associated Hardware, Miscellaneous Electrical and Electronic Components, Beverages, Nonalcoholic, Miscellaneous Vehicular Components, and moreby Army, Air Force, Navy Signed by year:2000: $2,780,106; 2001: $2,025,173; 2002: $1,690,324; 2003: $379,131; 2004: $1,748,587; 2005: $114,225; 2006: $0.
Biggest contracts:
$1,029,250 with Army for Electron Tubes and Associated Hardware. Signed on 2001-12-14. Completion date: 2005-02-28.
$942,560 with Army for Miscellaneous Electrical and Electronic Components. Signed on 2004-10-15. Completion date: 2005-12-31.
$855,958 with Army for Electron Tubes and Associated Hardware. Signed on 2000-03-13. Completion date: 2003-11-30.
$662,048, same as above.Signed on 2002-11-20. Completion date: 2004-01-25.
AGILENT TECHNOLOGIES, INC (395 PAGE MILL ROAD) : $3,490,187 in 62 contractsfrom 1999 to 2006
Contracts for ADP Facility Operation and Maintenance Services, Medical and Surgical Instruments, Equipment, and Supplies, Laboratory Equipment and Supplies, Environmental Chambers and Related Equipment, and moreby EPA, Department of Veterans Affairs, Drug Enforcement Administration, Tennessee Valley Authority, and others Signed by year:2000: $436,113; 2001: $413,057; 2002: $0; 2003: $350,427; 2004: $320,595; 2005: $887,291; 2006: $1,043,524.
Biggest contracts:
$534,160 with EPA for ADP Facility Operation and Maintenance Services. Taking place in PA. Signed on 2005-09-29. Completion date: 2005-11-30.
$327,000 with Department of Veterans Affairs for Medical and Surgical Instruments, Equipment, and Supplies. Taking place in MA. Signed on 2001-04-15. Completion date: 2001-05-15.
$285,820 with EPA for Laboratory Equipment and Supplies. Taking place in MA. Signed on 2006-09-27. Completion date: 2006-11-15.
$198,861 with Drug Enforcement Administration for Environmental Chambers and Related Equipment. Taking place in FL. Signed on 2006-05-25. Completion date: 2006-07-07.
MEVICON INC (1121 SAN ANTONIO RD; small business) : $2,304,342 in 11 contractsfrom 2003 to 2006
Contracts for Defense Missile and Space Systems -- Advanced Development (R&D), Defense Missile and Space Systems -- Management and Support (R&D), Defense Missile and Space Systems -- Operational Systems Development (R&D), Other Defense -- Applied Research and Exploratory Development (R&D), and moreby Air Force, Army, NASA Signed by year:2000: $0; 2001: $0; 2002: $0; 2003: $538,905; 2004: $748,126; 2005: $747,311; 2006: $270,000.
Biggest contracts:
$748,126 with Air Force for Defense Missile and Space Systems -- Advanced Development (R&D). Signed on 2004-05-10. Completion date: 2006-08-17.
$747,311 with Air Force for Defense Missile and Space Systems -- Management and Support (R&D). Signed on 2005-06-10. Completion date: 2007-06-07.
$100,000 with Air Force for Defense Missile and Space Systems -- Operational Systems Development (R&D). Signed on 2006-04-25. Completion date: 2007-03-17.
$100,000, same as above.Signed on 2006-04-18. Completion date: 2007-04-17.
CYBERDYNAMICS, INC (1860 EMBARCADERO RD; small business) : $1,457,321 in 10 contractsfrom 1999 to 2006
Contracts for Other Defense -- Applied Research and Exploratory Development (R&D), Defense Electronics and Communication Equipment -- Advanced Development (R&D) by Army, Air Force Signed by year:2000: $356,844; 2001: $50,000; 2002: $0; 2003: $260,000; 2004: $30,000; 2005: $300,000; 2006: $100,000.
Biggest contracts:
$360,477 with Army for Other Defense -- Applied Research and Exploratory Development (R&D). Signed on 1999-11-18. Completion date: 2001-12-18.
$356,844, same as above.Signed on 2000-09-28. Completion date: 2001-11-18.
$200,000 with Air Force for Defense Electronics and Communication Equipment -- Advanced Development (R&D). Signed on 2003-12-01. Completion date: 2006-09-30.
$100,000, same as above.Signed on 2006-05-17. Completion date: 2006-09-30.
NETWORK RESONANCE (3246 LOUIS RD; small business) : $966,183 in 4 contractsin 2005
$273,839 with Air Force for Other Defense -- Applied Research and Exploratory Development (R&D). Signed on 2005-07-14. Completion date: 2005-11-15.
$258,343, same as above.Signed on 2005-05-16. Completion date: 2006-05-24.
$235,087, same as above.Signed on 2005-12-02. Completion date: 2006-02-28.
$198,914, same as above.Signed on 2005-02-11. Completion date: 2006-05-24.
Top industries in this zip code by the number of employees in 2005:
Professional, Scientific, and Technical Services: Research and Development in the Physical, Engineering, and Life Sciences (250-499 employees: 1 establishment, 50-99 employees: 1 establishment, 20-49 employees: 3 establishments, 5-9 employees: 5 establishments, 1-4 employees: 8 establishments)
Professional, Scientific, and Technical Services: Offices of Lawyers (100-249: 1, 50-99: 1, 20-49: 6, 10-19: 1, 5-9: 3, 1-4: 14)
2005 - 2018 National Fire Incident Reporting System (NFIRS) incidents
Based on the data from the years 2005 - 2018 the average number of fire incidents per year is 64. The highest number of fire incidents - 108 took place in 2008, and the least - 3 in 2005. The data has a growing trend.
When looking into fire subcategories, the most incidents belonged to: Outside Fires (38.4%), and Structure Fires (29.5%).
Fire incident types reported to NFIRS in Zip Code 94303


 Nearest zip codes: 94301, 94306, 94043, 94025, 94305, 94041.


 Based on the data from the years 2005 - 2018 the average number of fire incidents per year is 64. The highest number of fire incidents - 108 took place in 2008, and the least - 3 in 2005. The data has a growing trend.
 When looking into fire subcategories, the most incidents belonged to: Outside Fires (38.4%), and Structure Fires (29.5%).