Estimated zip code population in 2022: 27,554 Zip code population in 2010: 26,469 Zip code population in 2000: 24,484
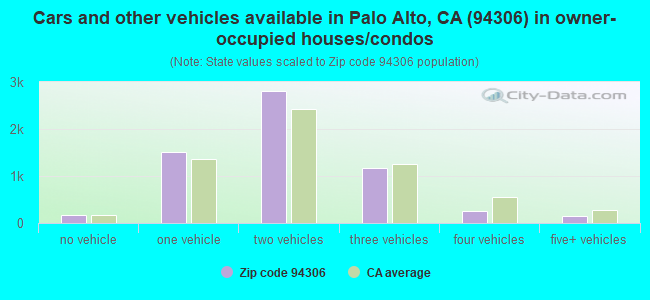
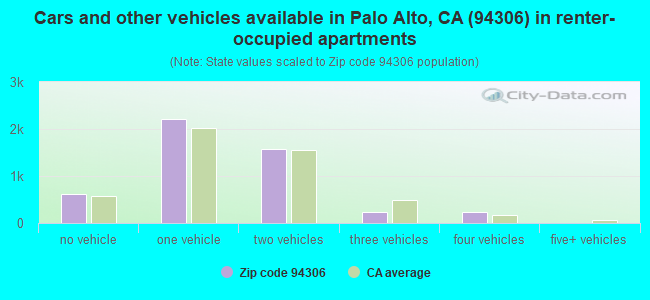
Houses and condos: 12,042 Renter-occupied apartments: 4,874
% of renters here:
45%
State:
44%
March 2022 cost of living index in zip code 94306: 126.5 (high, U.S. average is 100)
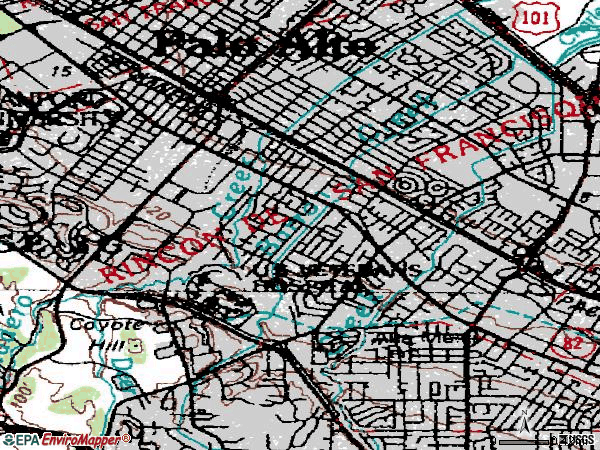
Land area: 4.2 sq. mi. Water area: 0.0 sq. mi.
Population density: 6,581 people per square mile
(high).
OSM Map
General Map
Google Map
MSN Map
OSM Map
General Map
Google Map
MSN Map
OSM Map
General Map
Google Map
MSN Map
OSM Map
General Map
Google Map
MSN Map
Please wait while loading the map...
Real estate property taxes paid for housing units in 2022:
This zip code:
0.5% ($10,292)
California:
0.7% ($4,831)
Median real estate property taxes paid for housing units with mortgages in 2022: $10,330 (0.5%) Median real estate property taxes paid for housing units with no mortgage in 2022: $9,036 (0.4%)
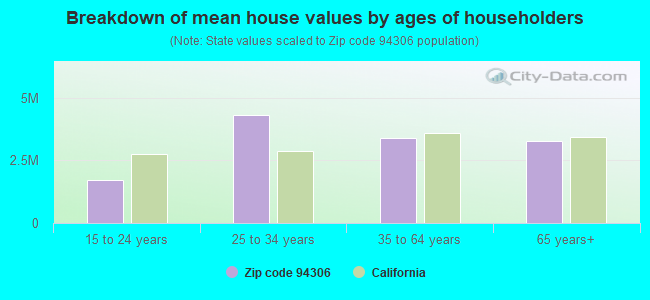
Estimated median house/condo value in 2022: $2,171,698
94306:
$2,171,698
California:
$715,900
According to our research of California and other state lists, there were 5 registered sex offenders living in 94306 zip code as of April 27, 2024. The ratio of all residents to sex offenders in zip code 94306 is 5,530 to 1. The ratio of registered sex offenders to all residents in this zip code is much lower than the state average.
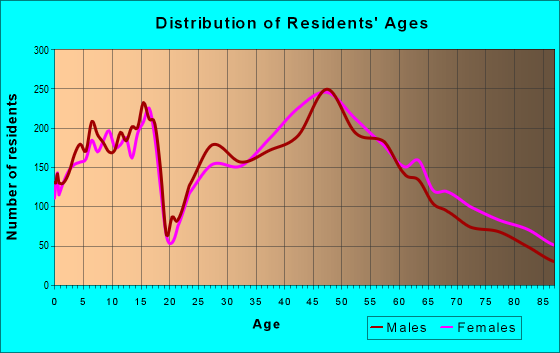
Median resident age:
This zip code:
41.2 years
California median age:
37.9 years
Average household size:
This zip code:
2.5 people
California:
2.8 people
Averages for the 2020 tax year for zip code 94306, filed in 2021:
Average Adjusted Gross Income (AGI) in 2020: $399,914 (Individual Income Tax Returns)
Here:
$399,914
State:
$95,910
Salary/wage: $372,613 (reported on 77.9% of returns)
Here:
$372,613
State:
$77,331
(% of AGI for various income ranges: 1389.5% for AGIs below $25k, 3906.9% for AGIs $25k-50k, 6996.3% for AGIs $50k-75k, 10032.3% for AGIs $75k-100k, 20546.3% for AGIs $100k-200k, 335555.5% for AGIs over 200k)
Taxable interest for individuals: $4,614 (reported on 62.9% of returns)
This zip code:
$4,614
California:
$2,294
(% of AGI for various income ranges: 78.8% for AGIs below $25k, 88.8% for AGIs $25k-50k, 144.4% for AGIs $50k-75k, 231.2% for AGIs $75k-100k, 429.4% for AGIs $100k-200k, 2875.7% for AGIs over 200k)
Ordinary dividends: $20,374 (reported on 57.7% of returns)
Here:
$20,374
State:
$10,949
(% of AGI for various income ranges: 149.9% for AGIs below $25k, 276.3% for AGIs $25k-50k, 444.9% for AGIs $50k-75k, 593.7% for AGIs $75k-100k, 1501.4% for AGIs $100k-200k, 12460.5% for AGIs over 200k)
Net capital gain/loss in AGI: +$106,084 (reported on 55.8% of returns)
Here:
+$106,084
State:
+$49,306
(% of AGI for various income ranges: 139.7% for AGIs below $25k, 234.1% for AGIs $25k-50k, 392.7% for AGIs $50k-75k, 769.2% for AGIs $75k-100k, 1935.5% for AGIs $100k-200k, 73018.5% for AGIs over 200k)
Profit/loss from business: +$39,075 (reported on 19.9% of returns)
Here:
+$39,075
State:
+$15,671
(% of AGI for various income ranges: 225.0% for AGIs below $25k, 380.8% for AGIs $25k-50k, 373.0% for AGIs $50k-75k, 622.7% for AGIs $75k-100k, 1317.3% for AGIs $100k-200k, 7385.9% for AGIs over 200k)
Taxable individual retirement arrangement distribution: $32,360 (reported on 11.8% of returns)
94306:
$32,360
California:
$23,505
(% of AGI for various income ranges: 78.7% for AGIs below $25k, 165.8% for AGIs $25k-50k, 372.5% for AGIs $50k-75k, 749.4% for AGIs $75k-100k, 1470.1% for AGIs $100k-200k, 2455.2% for AGIs over 200k)
Self-employed (Keogh) retirement plans: $34,339 (reported on 3.5% of returns)
94306:
$34,339
California:
$30,163
(% of AGI for various income ranges: 27.0% for AGIs below $25k, 58.5% for AGIs $50k-75k, 200.4% for AGIs $100k-200k, 1261.7% for AGIs over 200k)
Total itemized deductions: $81,958 (reported on 26.9% of returns)
Here:
$81,958
State:
$39,517
(% of AGI for various income ranges: 196.5% for AGIs below $25k, 381.9% for AGIs $25k-50k, 685.2% for AGIs $50k-75k, 1199.8% for AGIs $75k-100k, 2422.8% for AGIs $100k-200k, 24087.7% for AGIs over 200k)
Charity contributions: $29,814 (reported on 23.0% of returns)
Here:
$29,814
State:
$12,598
(% of AGI for various income ranges: 13.4% for AGIs below $25k, 45.7% for AGIs $25k-50k, 81.4% for AGIs $50k-75k, 161.0% for AGIs $75k-100k, 448.2% for AGIs $100k-200k, 8123.6% for AGIs over 200k)
Taxes paid: $9,346 (reported on 26.8% of returns)
94306:
$9,346
State:
$8,807
(% of AGI for various income ranges: 47.8% for AGIs below $25k, 66.8% for AGIs $25k-50k, 118.4% for AGIs $50k-75k, 241.3% for AGIs $75k-100k, 544.7% for AGIs $100k-200k, 2319.8% for AGIs over 200k)
Earned income credit: $1,257 (reported on 3.6% of returns)
Here:
$1,257
State:
$2,074
(% of AGI for various income ranges: 29.1% for AGIs below $25k, 25.3% for AGIs $25k-50k)
Percentage of individuals using paid preparers for their 2020 taxes: 89.6%
Here:
90%
State:
92%
(% for various income ranges: 84.9% for AGIs below $25k, 90.1% for AGIs $25k-50k, 89.2% for AGIs $50k-75k, 89.2% for AGIs $75k-100k, 89.9% for AGIs $100k-200k, 91.9% for AGIs over 200k)
Averages for the 2012 tax year for zip code 94306, filed in 2013:
Average Adjusted Gross Income (AGI) in 2012: $213,452 (Individual Income Tax Returns)
Here:
$213,452
State:
$72,726
Salary/wage: $174,541 (reported on 79.1% of returns)
Here:
$174,541
State:
$59,079
(% of AGI for various income ranges: 71.5% for AGIs below $25k, 74.2% for AGIs $25k-50k, 69.4% for AGIs $50k-75k, 68.3% for AGIs $75k-100k, 72.4% for AGIs $100k-200k, 62.5% for AGIs over 200k)
Taxable interest for individuals: $3,627 (reported on 62.4% of returns)
This zip code:
$3,627
California:
$2,146
(% of AGI for various income ranges: 2.8% for AGIs below $25k, 1.3% for AGIs $25k-50k, 1.5% for AGIs $50k-75k, 1.3% for AGIs $75k-100k, 1.1% for AGIs $100k-200k, 1.0% for AGIs over 200k)
Ordinary dividends: $14,148 (reported on 50.9% of returns)
Here:
$14,148
State:
$9,308
(% of AGI for various income ranges: 8.1% for AGIs below $25k, 3.4% for AGIs $25k-50k, 4.3% for AGIs $50k-75k, 4.2% for AGIs $75k-100k, 4.0% for AGIs $100k-200k, 3.1% for AGIs over 200k)
Net capital gain/loss in AGI: +$72,375 (reported on 48.5% of returns)
Here:
+$72,375
State:
+$30,460
(% of AGI for various income ranges: 0.4% for AGIs below $25k, 1.1% for AGIs $25k-50k, 1.2% for AGIs $50k-75k, 1.6% for AGIs $75k-100k, 2.4% for AGIs $100k-200k, 21.0% for AGIs over 200k)
Profit/loss from business: +$37,741 (reported on 20.9% of returns)
Here:
+$37,741
State:
+$17,064
(% of AGI for various income ranges: 12.1% for AGIs below $25k, 6.2% for AGIs $25k-50k, 4.3% for AGIs $50k-75k, 5.1% for AGIs $75k-100k, 5.7% for AGIs $100k-200k, 3.0% for AGIs over 200k)
Taxable individual retirement arrangement distribution: $29,502 (reported on 13.7% of returns)
94306:
$29,502
California:
$19,557
(% of AGI for various income ranges: 4.7% for AGIs below $25k, 3.2% for AGIs $25k-50k, 5.0% for AGIs $50k-75k, 4.8% for AGIs $75k-100k, 3.6% for AGIs $100k-200k, 1.3% for AGIs over 200k)
Self-employment retirement plans: $27,292 (reported on 4.0% of returns)
94306:
$27,292
California:
$24,530
(% of AGI for various income ranges: 0.3% for AGIs $25k-50k, 0.3% for AGIs $50k-75k, 0.4% for AGIs $75k-100k, 0.6% for AGIs $100k-200k, 0.5% for AGIs over 200k)
Total itemized deductions: $63,787 (18% of AGI, reported on 54.4% of returns)
Here:
$63,787
State:
$34,004
Here:
18.0% of AGI
State:
22.7% of AGI
(% of AGI for various income ranges: 18.6% for AGIs below $25k, 12.8% for AGIs $25k-50k, 14.5% for AGIs $50k-75k, 15.5% for AGIs $75k-100k, 18.0% for AGIs $100k-200k, 16.1% for AGIs over 200k)
Charity contributions: $11,079 (reported on 45.1% of returns)
Here:
$11,079
State:
$4,659
(% of AGI for various income ranges: 0.8% for AGIs below $25k, 0.9% for AGIs $25k-50k, 1.3% for AGIs $50k-75k, 1.4% for AGIs $75k-100k, 1.7% for AGIs $100k-200k, 2.6% for AGIs over 200k)
Taxes paid: $37,374 (reported on 54.2% of returns)
94306:
$37,374
State:
$14,448
(% of AGI for various income ranges: 5.2% for AGIs below $25k, 3.0% for AGIs $25k-50k, 4.2% for AGIs $50k-75k, 6.2% for AGIs $75k-100k, 8.8% for AGIs $100k-200k, 10.2% for AGIs over 200k)
Earned income credit: $1,403 (reported on 4.7% of returns)
Here:
$1,403
State:
$2,286
(% of AGI for various income ranges: 2.0% for AGIs below $25k, 0.4% for AGIs $25k-50k)
Percentage of individuals using paid preparers for their 2012 taxes: 46.7%
Here:
47%
State:
64%
(% for various income ranges: 40.5% for AGIs below $25k, 41.1% for AGIs $25k-50k, 46.3% for AGIs $50k-75k, 47.2% for AGIs $75k-100k, 47.4% for AGIs $100k-200k, 55.3% for AGIs over 200k)
Averages for the 2004 tax year for zip code 94306, filed in 2005:
Average Adjusted Gross Income (AGI) in 2004: $138,129 (Individual Income Tax Returns)
Here:
$138,129
State:
$58,600
Salary/wage: $98,588 (reported on 76.2% of returns)
Here:
$98,588
State:
$49,455
(% of AGI for various income ranges: 64.1% for AGIs $10k-25k, 73.8% for AGIs $25k-50k, 67.1% for AGIs $50k-75k, 71.8% for AGIs $75k-100k, 50.5% for AGIs over 100k)
Taxable interest for individuals: $3,137 (reported on 68.4% of returns)
This zip code:
$3,137
California:
$2,365
(% of AGI for various income ranges: 5.0% for AGIs $10k-25k, 2.9% for AGIs $25k-50k, 2.7% for AGIs $50k-75k, 2.2% for AGIs $75k-100k, 1.2% for AGIs over 100k)
Taxable dividends: $6,493 (reported on 53.6% of returns)
Here:
$6,493
State:
$4,746
(% of AGI for various income ranges: 5.6% for AGIs $10k-25k, 3.5% for AGIs $25k-50k, 4.2% for AGIs $50k-75k, 3.3% for AGIs $75k-100k, 2.1% for AGIs over 100k)
Net capital gain/loss: +$79,552 (reported on 49.2% of returns)
Here:
+$79,552
State:
+$23,418
(% of AGI for various income ranges: 1.4% for AGIs $10k-25k, 1.4% for AGIs $25k-50k, 1.3% for AGIs $50k-75k, 2.3% for AGIs $75k-100k, 33.9% for AGIs over 100k)
Profit/loss from business: +$26,088 (reported on 21.2% of returns)
Here:
+$26,088
State:
+$16,826
(% of AGI for various income ranges: 9.9% for AGIs $10k-25k, 5.3% for AGIs $25k-50k, 6.5% for AGIs $50k-75k, 6.0% for AGIs $75k-100k, 3.5% for AGIs over 100k)
IRA payment deduction: $3,380 (reported on 4.1% of returns)
94306:
$3,380
California:
$3,192
(% of AGI for various income ranges: 0.5% for AGIs $10k-25k, 0.4% for AGIs $25k-50k, 0.3% for AGIs $50k-75k, 0.3% for AGIs $75k-100k, 0.0% for AGIs over 100k)
Self-employed pension: $17,390 (reported on 4.6% of returns)
Here:
$17,390
California:
$17,688
(% of AGI for various income ranges: 0.3% for AGIs $10k-25k, 0.3% for AGIs $25k-50k, 0.6% for AGIs $50k-75k, 0.5% for AGIs $75k-100k, 0.6% for AGIs over 100k)
Total itemized deductions: $44,555 (19% of AGI, reported on 51.1% of returns)
Here:
$44,555
State:
$28,113
Here:
18.8% of AGI
State:
25.3% of AGI
(% of AGI for various income ranges: 16.8% for AGIs $10k-25k, 14.2% for AGIs $25k-50k, 16.1% for AGIs $50k-75k, 18.6% for AGIs $75k-100k, 16.3% for AGIs over 100k)
Charity contributions deductions: $12,438 (5% of AGI, reported on 45.3% of returns)
Here:
$12,438
State:
$3,923
Here:
4.9% of AGI
State:
3.3% of AGI
(% of AGI for various income ranges: 1.3% for AGIs $10k-25k, 1.5% for AGIs $25k-50k, 1.9% for AGIs $50k-75k, 2.0% for AGIs $75k-100k, 4.5% for AGIs over 100k)
Total tax: $28,936 (reported on 84.4% of returns)
94306:
$28,936
State:
$10,761
(% of AGI for various income ranges: 5.6% for AGIs $10k-25k, 8.7% for AGIs $25k-50k, 11.6% for AGIs $50k-75k, 12.4% for AGIs $75k-100k, 19.1% for AGIs over 100k)
Earned income credit: $1,042 (reported on 4.1% of returns)
Here:
$1,042
State:
$1,763
Percentage of individuals using paid preparers for their 2004 taxes: 48.6%
Here:
49%
State:
66%
(% for various income ranges: 40.7% for AGIs below $10k, 49.3% for AGIs $10k-25k, 47.7% for AGIs $25k-50k, 48.0% for AGIs $50k-75k, 50.6% for AGIs $75k-100k, 52.8% for AGIs over 100k)
Likely homosexual households (counted as self-reported same-sex unmarried-partner households)
Lesbian couples: 0.2% of all households
Gay men: 0.0% of all households
Household received Food Stamps/SNAP in the past 12 months: 306 Household did not receive Food Stamps/SNAP in the past 12 months: 10,373
Women who had a birth in the past 12 months: 196 (194 now married, 0 unmarried) Women who did not have a birth in the past 12 months: 6,167 (2,619 now married, 3,541 unmarried)
Housing units in zip code 94306 with a mortgage: 3,447 (576 second mortgage, 501 both second mortgage and home equity loan) Houses without a mortgage: 12
Median monthly owner costs for units with a mortgage: $3,876 Median monthly owner costs for units without a mortgage: $1,241
Residents with income below the poverty level in 2022:
This zip code:
6.8%
Whole state:
12.2%
Residents with income below 50% of the poverty level in 2022:
This zip code:
3.5%
Whole state:
6.2%
Median number of rooms in houses and condos:
Here:
6.4
State:
6.0
Median number of rooms in apartments:
Here:
3.7
State:
3.9
Notable locations in this zip code not listed on our city pages
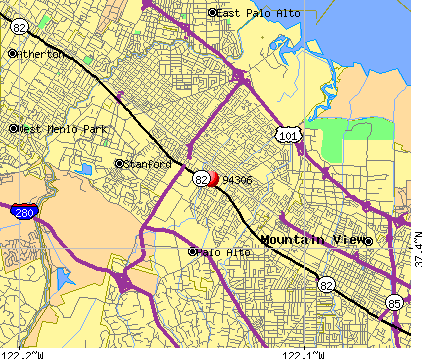
Notable locations in zip code 94306: Institute of Molecular Medical Sciences (A), College Terrace Library (B), Bolton Childrens Center (C), Jackson Center (D), Bolton Children Center (E), Palo Alto Community Center (F), Schultz Jewish Community Center (G), Terman Park Branch Palo Alto City Library (H), Cubberley Community Center (I), Palo Alto Fire Department Station 5 (J). Display/hide their locations on the map
Churches in zip code 94306 include: Saint Marks Episcopal Church (A), Kingdom Hall of Jehovahs Witnesses (B), Grace Lutheran Church (C), First Christian Church (D), Wesley United Methodist Church (E), University Lutheran Church (F), Jerusalem Baptist Church (G), The Church of Jesus Christ of Latter Day Saints (H), Free Will Baptist Church (I). Display/hide their locations on the map
Parks in zip code 94306 include: Mitchell Park (1), Cameron Park (2), Berkeley Park (3), Peers Park (4), Werry Park (5), El Camino Field (6), Mayfield Park (7), Ray Field (8), Weisshaar Park (9). Display/hide their locations on the map
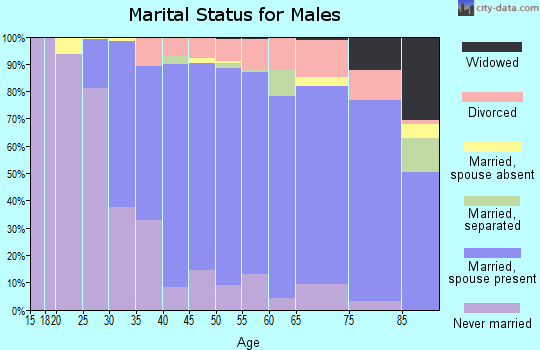
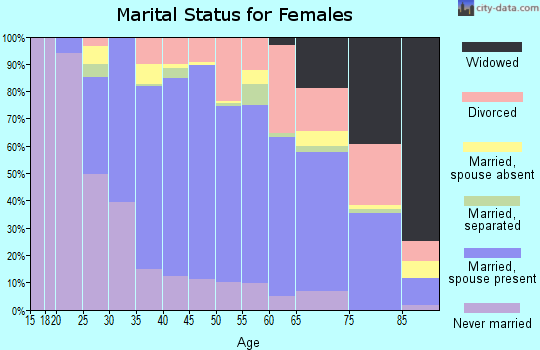
4,957 married couples with children.
865 single-parent households (340 men, 525 women).
58.0% of residents of 94306 zip code speak English at home.
4.8% of residents speak Spanish at home (56% very well, 23% well, 21% not well, 1% not at all).
11.2% of residents speak other Indo-European language at home (84% very well, 10% well, 5% not well, 1% not at all).
24.3% of residents speak Asian or Pacific Island language at home (68% very well, 20% well, 10% not well, 1% not at all).
2.1% of residents speak other language at home (96% very well, 2% well, 1% not well, 1% not at all).
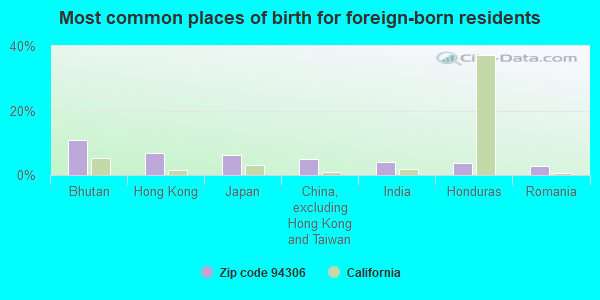
Foreign born population: 9,355 (34.0%) (57.4% of them are naturalized citizens)
Major facilities with environmental interests located in this zip code:
KEEBLE AND SHUCHAT PHOTOGRAPHY (290 CALIFORNIA AVE in PALO ALTO, CA)
STATE MASTER (California - Hazardous Waste Tracking) - HAZARDOU WASTE PROGRAM Small Quantity Generators, between 100 kg and 1000 kg of hazardous waste/month (Resource Conservation and Recovery Act (tracking hazardous waste)) - notification Organizations: TERRY SHUCHAT (CONTACT/OWNER)
EL CARMELO ELEMENTARY (3024 BRYANT ST. in PALO ALTO, CA)
(National Center for Education Statistics) - STATE ID-6048235 Organizations: PALO ALTO UNIFIED (SCHOOL DISTRICT)
FAIRMEADOW ELEMENTARY (500 E. MEADOW DR. in PALO ALTO, CA)
(National Center for Education Statistics) - STATE ID-6048268 Organizations: PALO ALTO UNIFIED (SCHOOL DISTRICT)
GUNN (HENRY M.) HIGH (780 ARASTRADERO ROAD in PALO ALTO, CA)
(National Center for Education Statistics) - STATE ID-4332904 Organizations: PALO ALTO UNIFIED (SCHOOL DISTRICT)
HOOVER (HERBERT) ELEMENTARY (445 E. CHARLESTON ROAD in PALO ALTO, CA)
(National Center for Education Statistics) - STATE ID-6048201 Organizations: PALO ALTO UNIFIED (SCHOOL DISTRICT)
CRITERIA AND HAZARDOUS AIR POLLUTANT INVENTORY (Inventory of air pollution sources) Large Quantity Generators, more that 1000 kg of hazardous waste/month (Resource Conservation and Recovery Act (tracking hazardous waste)) TRI REPORTER (Tracking of toxic chemicals releasing facilities) Business SIC classification: PLASTICS PRODUCTS; ALUMINUM DIE-CASTINGS; SHEET METALWORK; REFUSE SYSTEMS Business NAICS classification: IN-VITRO DIAGNOSTIC SUBSTANCE MANUFACTURING.; ALL OTHER PLASTICS PRODUCT MANUFACTURING.; ALUMINUM DIE-CASTING FOUNDRIES.; SHEET METAL WORK MANUFACTURING. Organizations: HEWLETT PACKARD CO PALO ALTO FABRCTN (CONTACT/OPERATOR)
Alternative names: HEWLETT-PACKARD COMPANY, HEWLETT-PACKARD CO. PALO ALTO FABRICATION CTR.
INTRABIOTICS PHARMACEUTICAL INC (490 SAN ANTONIO RD in PALO ALTO, CA)
LOCKHEED MISSLES & SPACE CO (3101 PARK BLVD in PALO ALTO, CA)
(Resource Conservation and Recovery Act (tracking hazardous waste)) Organizations: LOCKHEED M&S CO (CONTACT/OWNER)
HELMINGS AUTO REPAIR (300 LAMBERT AVE in PALO ALTO, CA)
Small Quantity Generators, between 100 kg and 1000 kg of hazardous waste/month (Resource Conservation and Recovery Act (tracking hazardous waste)) - notification Business NAICS classification: GENERAL AUTOMOTIVE REPAIR. Organizations: HELMING ROBERT (CONTACT/OWNER)
LINUS PAULING INSTITUTE (440 PAGE MILL RD in PALO ALTO, CA)
Small Quantity Generators, between 100 kg and 1000 kg of hazardous waste/month (Resource Conservation and Recovery Act (tracking hazardous waste)) - notification Business NAICS classification: MEDICAL LABORATORIES. Organizations: L P I BOARD OF TRUSTEES (CONTACT/OWNER)
CALIFORNIA AVENUE NORGE VILLAG (240 CALIFORNIA AVENUE in PALO ALTO, CA)
CRITERIA AND HAZARDOUS AIR POLLUTANT INVENTORY (Inventory of air pollution sources) Small Quantity Generators, between 100 kg and 1000 kg of hazardous waste/month (Resource Conservation and Recovery Act (tracking hazardous waste)) Business SIC classification: DRYCLEANING PLANTS, EXCEPT RUG CLEANING Alternative names: CALIFORNIA AV NORGE VILLAGE
LOCKHEED MARTIN LIBRASCOPE COR (3176 PORTER DR in PALO ALTO, CA)
Small Quantity Generators, between 100 kg and 1000 kg of hazardous waste/month (Resource Conservation and Recovery Act (tracking hazardous waste)) - notification Organizations: LOCKHEED MARTIN LIBRRASCOPE COR (CONTACT/OWNER)
CARLSEN SUBARU (4190 EL CAMINO in PALO ALTO, CA)
Small Quantity Generators, between 100 kg and 1000 kg of hazardous waste/month (Resource Conservation and Recovery Act (tracking hazardous waste))
Housing units lacking complete plumbing facilities: 0.1% Housing units lacking complete kitchen facilities: 0.5%
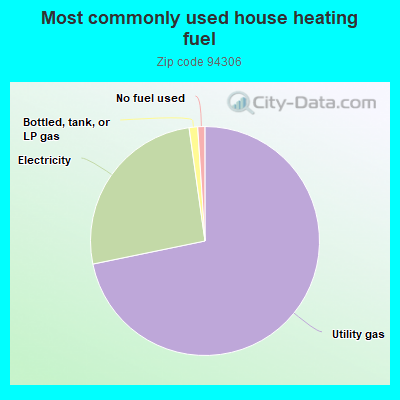
71.2%Utility gas
25.8%Electricity
1.2%Bottled, tank, or LP gas
1.0%No fuel used
Population in 1990: 24,309. Population change in the 1990s: +175 (+0.7%).
Place of birth for U.S.-born residents:
This state: 10,329
Northeast: 1,916
Midwest: 2,335
South: 1,395
West: 965
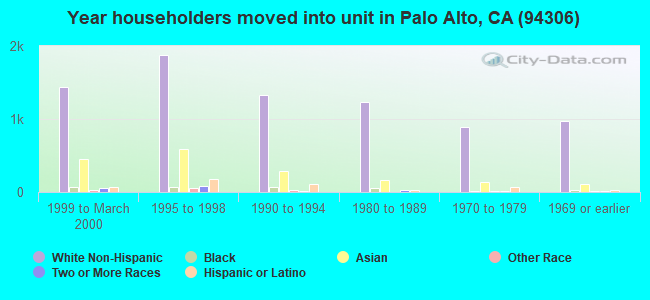
59% of the 94306 zip code residents lived in the same house 5 years ago. Out of people who lived in different houses, 45% lived in this county. Out of people who lived in different counties, 50% lived in California.
87% of the 94306 zip code residents lived in the same house 1 year ago. Out of people who lived in different houses, 45% moved from this county. Out of people who lived in different houses, 24% moved from different county within same state. Out of people who lived in different houses, 17% moved from different state. Out of people who lived in different houses, 16% moved from abroad.
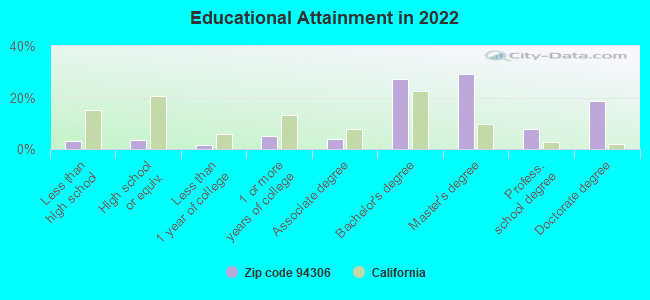
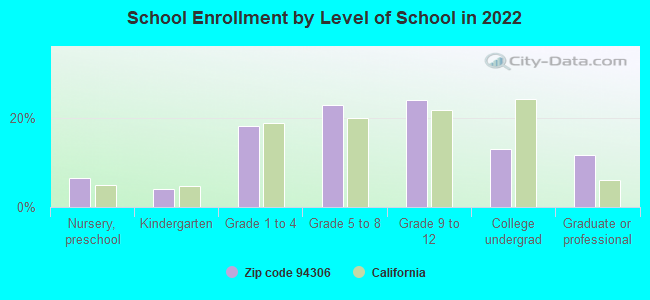
Private vs. public school enrollment:
Students in private schools in grades 1 to 8 (elementary and middle school): 323
Here:
11.5%
California:
10.5%
Students in private schools in grades 9 to 12 (high school): 125
Here:
7.6%
California:
8.5%
Students in private undergraduate colleges: 390
Here:
42.6%
California:
15.9%
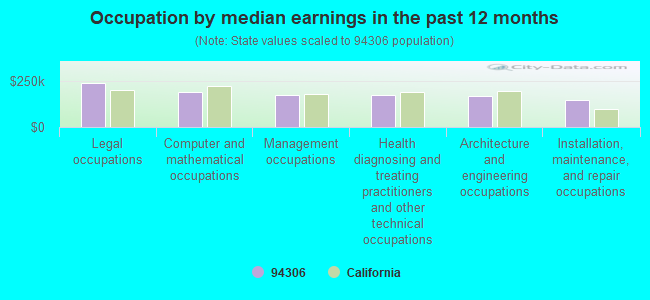
Occupation by median earnings in the past 12 months ($)
237,352Legal occupations
186,565Computer and mathematical occupations
172,965Management occupations
171,482Health diagnosing and treating practitioners and other technical occupations
165,679Architecture and engineering occupations
144,683Installation, maintenance, and repair occupations
Companies with biggest federal contracts located in this zip code (PALO ALTO, CA):
HYPERSONICS (164 FERNE AVE; small business) : $1,593,062 in 19 contractsfrom 2000 to 2006
Contracts for Defense Aircraft -- Applied Research and Exploratory Development (R&D), ADP Software, Defense Aircraft -- Basic Research (R&D) by Air Force, Navy Signed by year:2000: $60,000; 2001: $195,000; 2002: $160,000; 2003: $210,000; 2004: $250,000; 2005: $293,062; 2006: $425,000.
Biggest contracts:
$250,000 with Air Force for Defense Aircraft -- Applied Research and Exploratory Development (R&D). Signed on 2006-05-12. Completion date: 2008-05-12.
$150,000 with Navy for ADP Software. Signed on 2004-06-09. Completion date: 2004-09-30.
$119,216, same as above.Signed on 2005-03-08. Completion date: 2005-09-30.
$100,000, same as above.Signed on 2006-04-17. Completion date: 2006-12-31.
LEE, DAVID A (2248 PARK BOULEVARD; small business) : $1,037,161 in 11 contractsfrom 2000 to 2002
Contracts for Residential Buildings by Navy Signed by year:2000: $522,039; 2001: $457,793; 2002: $57,329; 2003: $0; 2004: $0; 2005: $0; 2006: $0.
Biggest contracts:
$293,148 with Navy for Residential Buildings. Signed on 2001-05-04. Completion date: 2002-01-31.
$283,951, same as above.Signed on 2000-01-27. Completion date: 2000-08-15.
$161,918, same as above.Signed on 2000-04-28. Completion date: 1999-09-30.
$76,170, same as above.Signed on 2000-09-14. Completion date: 1999-09-30.
CMSOFT, INC (566 GLENBROOK DRIVE; small business) : $599,394 in 3 contractsfrom 2005 to 2006
$400,000 with Air Force for Other Research and Development -- Basic Research (R&D). Signed on 2006-07-07. Completion date: 2008-05-30.
$99,998 with Air Force for Defense Aircraft -- Basic Research (R&D). Signed on 2006-05-08. Completion date: 2007-02-09.
$99,396, same as above.Signed on 2005-05-10. Completion date: 2006-02-10.
VISIONAEL CORPORATION (410 CAMBRIDGE AVE; small business) : $594,822 in 10 contractsfrom 2002 to 2005
Contracts for ADP Software, Other ADP and Telecommunications Services (includes data storage on tapes, compact disks, etc.), ADP Input/Output and Storage Devices, Technical Representation Services -- Automatic Data Processing Equipment (Including Firmware), Software, Supplies and Support Equipment, and moreby Internal Revenue Service, Navy, Air Force Signed by year:2000: $0; 2001: $0; 2002: $168,600; 2003: $46,000; 2004: $241,241; 2005: $138,981; 2006: $0.
Biggest contracts:
$141,000 with Internal Revenue Service for ADP Software. Taking place in MD. Signed on 2002-08-15. Completion date: 2002-09-15.
$119,200 with Navy for Other ADP and Telecommunications Services (includes data storage on tapes, compact disks, etc.). Taking place in SC. Signed on 2005-09-01. Completion date: 2006-08-31.
$119,200 with Navy for ADP Input/Output and Storage Devices. Taking place in VA. Signed on 2004-09-01. Completion date: 2005-08-31.
$55,786 with Internal Revenue Service for ADP Software. Taking place in MD. Signed on 2004-01-22. Effective on 2004-01-13. Completion date: 2004-09-30.
IMPAC (3200 PARK BLVD) : $586,203 in 2 contractsin 2002
$298,453 with Defense Logistics Agency for X-Ray Equipment and Supplies: Medical, Dental, Veterinary. Signed on 2002-01-04. Completion date: 2002-04-01.
$287,750, same as above.Signed on 2002-06-06. Completion date: 2002-09-03.
NEXPRISE, INC (409 SHERMAN AVENUE; small business) : $575,372 in 6 contractsfrom 2002 to 2006
Contracts for Other ADP and Telecommunications Services (includes data storage on tapes, compact disks, etc.) by Army Signed by year:2000: $0; 2001: $0; 2002: $114,900; 2003: $289,325; 2004: $113,272; 2005: $55,000; 2006: $2,875.
Biggest contracts:
$178,525 with Army for Other ADP and Telecommunications Services (includes data storage on tapes, compact disks, etc.). Signed on 2003-11-10. Completion date: 2005-03-28.
$114,900, same as above.Signed on 2002-03-14. Completion date: 2003-02-28.
$113,272, same as above.Signed on 2004-11-04. Completion date: 2005-03-28.
$110,800, same as above.Signed on 2003-03-25. Completion date: 2004-02-29.
GEOMECHANICS INTERNATIONAL, IN (250 CAMBRIDGE AVENUE; small business) : $274,380 in 2 contractsfrom 2002 to 2003
$249,216 with Navy for Geothermal -- Applied Research and Exploratory Development (R&D). Signed on 2002-07-24. Completion date: 2003-06-22.
$25,164, same as above.Signed on 2003-08-12. Completion date: 2003-10-31.
A AND D PROTOCOL TRANSPORTATIO (525 SAN ANTONIO AVE; small business) : $84,520 in 3 contractsfrom 2000 to 2001
$48,960 with Army for Motor Passenger Services. Signed on 2001-09-26. Completion date: 2003-06-30.
$35,560, same as above.Signed on 2000-10-19. Completion date: 2001-06-30.
$0, same as above.Signed on 2000-10-19. Completion date: 2001-06-30.
PHIFER SMITH CORPORATION (2181 PARK BLVD; small business)
$69,999 with Army for Defense Missile and Space Systems -- Advanced Development (R&D). Signed on 2002-05-07. Completion date: 2002-11-07.
HIGH TIDE ASSOCIATES (4013 BEN LOMOND DR; small business)
$69,015 with Navy for Defense Electronics and Communication Equipment -- Basic Research (R&D). Signed on 2003-07-01. Completion date: 2003-12-31.
Top industries in this zip code by the number of employees in 2005:
2005 - 2018 National Fire Incident Reporting System (NFIRS) incidents
Based on the data from the years 2005 - 2018 the average number of fire incidents per year is 17. The highest number of fire incidents - 38 took place in 2011, and the least - 0 in 2008. The data has a growing trend.
When looking into fire subcategories, the most incidents belonged to: Structure Fires (43.8%), and Outside Fires (31.3%).
Fire incident types reported to NFIRS in Zip Code 94306
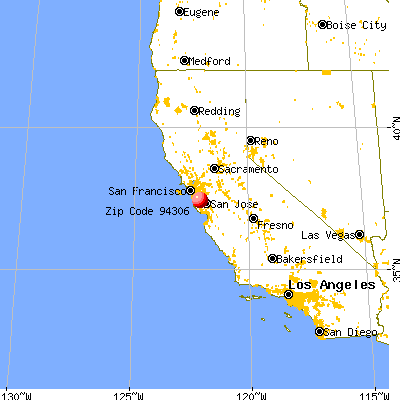


 Nearest zip codes: 94301, 94305, 94303, 94040, 94022, 94043.


 Based on the data from the years 2005 - 2018 the average number of fire incidents per year is 17. The highest number of fire incidents - 38 took place in 2011, and the least - 0 in 2008. The data has a growing trend.
 When looking into fire subcategories, the most incidents belonged to: Structure Fires (43.8%), and Outside Fires (31.3%).