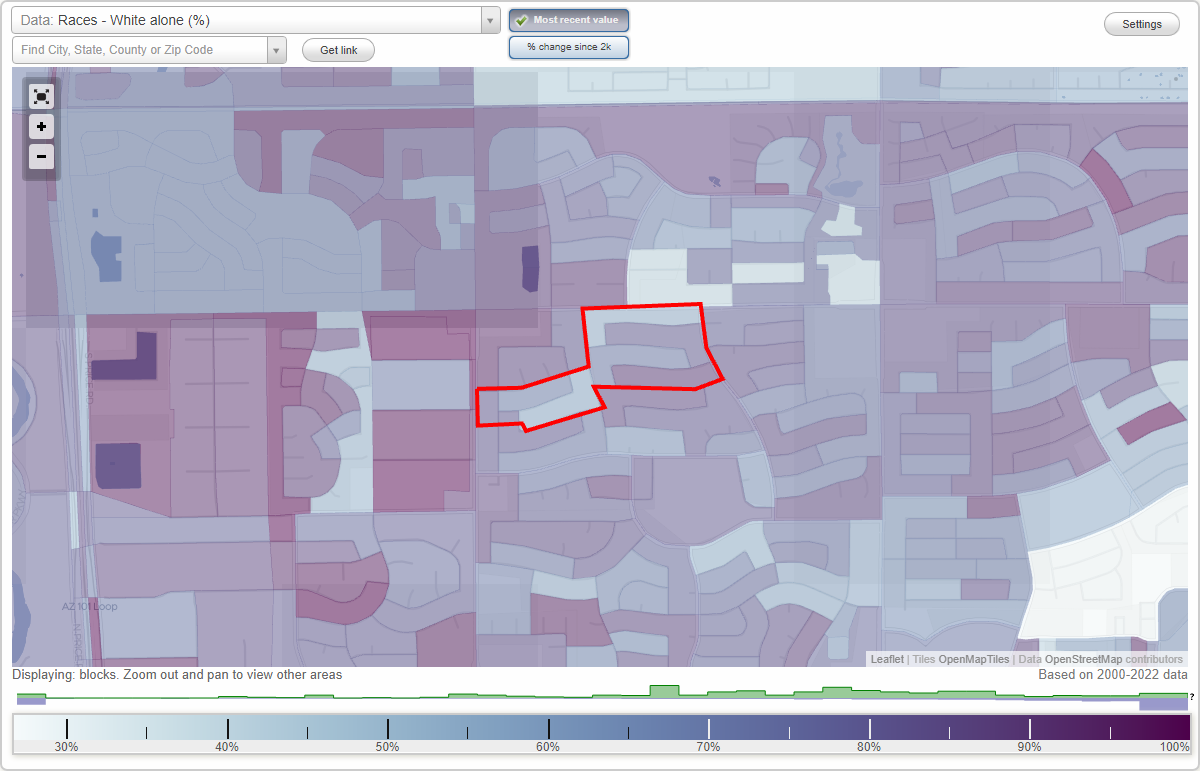
Knoll East neighborhood in Chandler, Arizona (AZ), 85224 detailed profile
Settings
X

Business Search - 14 Million verified businesses
Area: 0.091 square miles
Population: 411
Population density:
| Knoll East: | 4,527 people per square mile |
| Chandler: | 4,849 people per square mile |

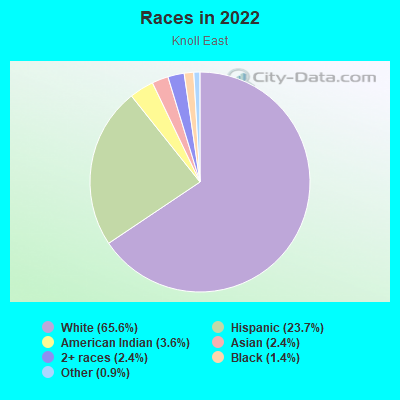
- 27765.6%White
- 10023.7%Hispanic or Latino
- 153.6%American Indian
- 102.4%Asian
- 102.4%Two or more races
- 61.4%Black
- 40.9%Some other race
Median household income in 2022:
| Knoll East: | $107,387 |
| Chandler: | $98,664 |
Distribution of median household income
![Distribution of median household income]()
- 4Less than $10,000
- 13$10,000 to $19,999
- 3$20,000 to $29,999
- 14$30,000 to $39,999
- 20$40,000 to $49,999
- 15$50,000 to $59,999
- 17$60,000 to $74,999
- 24$75,000 to $99,999
- 25$100,000 to $124,999
- 41$125,000 to $149,999
- 12$150,000 to $199,999
- 15$200,000 or more

Distribution of owner-occupied house/condo value
![Distribution of owner-occupied house/condo value]()
- 9Less than $50,000
- 8$50,000 to $99,999
- 12$100,000 to $149,999
- 12$150,000 to $199,999
- 9$200,000 to $249,999
- 22$250,000 to $299,999
- 63$300,000 to $399,999
- 18$400,000 to $499,999
- 3$500,000 to $749,999
- 4$1,000,000 or more

Distribution of rent paid by renters
![Distribution of rent paid by renters]()
- 8$300 to $399
- 1$400 to $499
- 2$500 to $599
- 25$700 to $799
- 6$800 to $899
- 20$1,000 to $1,249
- 28$1,250 to $1,499
- 13$1,500 to $1,999
- 6$2,000 or more

Median rent in 2022:
| Knoll East: | $1,441 |
| Chandler: | $1,692 |
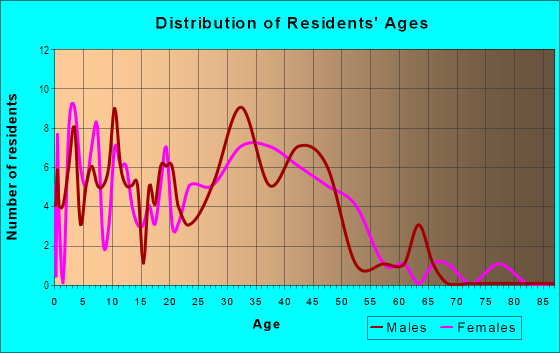
| Males: | 213 |
| Females: | 197 |
Males:
| This neighborhood: | 37.6 years |
| Whole city: | 35.8 years |
| This neighborhood: | 34.9 years |
| Whole city: | 38.3 years |
Average household size:
| Knoll East: | 2.5 people |
| Chandler: | 2.6 people |
Percentage of family households:
| Knoll East: | 56.3% |
| Chandler: | 53.2% |
| Here: | 42.6% |
| Chandler: | 50.7% |
Percentage of married-couple families with children (among all households):
| Knoll East: | 23.9% |
| Chandler: | 26.2% |
Percentage of single-mother households (among all households):
| Knoll East: | 14.2% |
| Chandler: | 7.3% |
Percentage of never married males 15 years old and over:
Percentage of never married females 15 years old and over:
| Knoll East: | 23.9% |
| Chandler: | 20.3% |
Percentage of never married females 15 years old and over:
| Knoll East: | 12.3% |
| city: | 14.9% |
Percentage of people that speak English not well or not at all:
| Knoll East: | 1.6% |
| Chandler: | 3.1% |
Percentage of people born in this state:
Percentage of people born in another U.S. state:
Percentage of native residents but born outside the U.S.:
Percentage of foreign born residents:
| Here: | 50.2% |
| Chandler: | 35.8% |
Percentage of people born in another U.S. state:
| Knoll East: | 41.3% |
| Chandler: | 44.6% |
Percentage of native residents but born outside the U.S.:
| Here: | 2.0% |
| city: | 1.5% |
Percentage of foreign born residents:
| Here: | 6.5% |
| Chandler: | 18.0% |
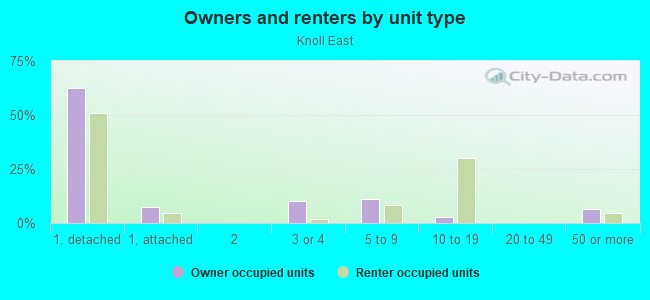
Owner-occupied
Renter-occupied

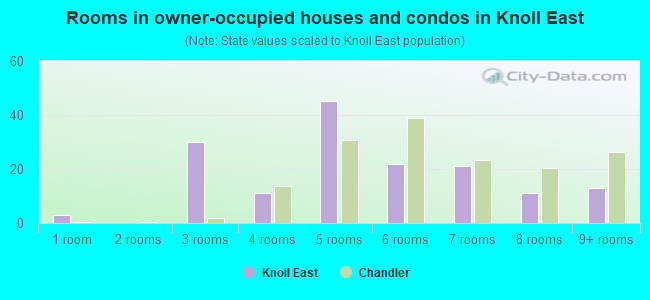
- Rooms in owner-occupied houses and condos in Knoll East
- 31 room
- 02 rooms
- 303 rooms
- 114 rooms
- 455 rooms
- 226 rooms
- 217 rooms
- 118 rooms
- 139+ rooms
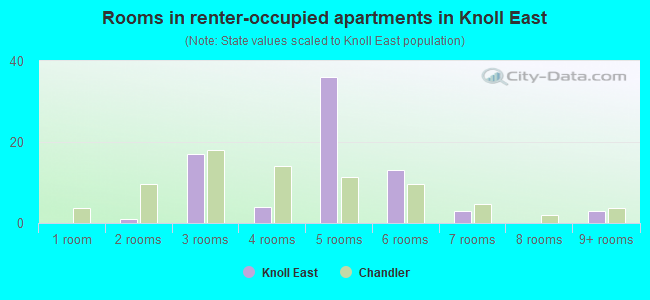
- Rooms in renter-occupied apartments in Knoll East
- 01 room
- 12 rooms
- 173 rooms
- 44 rooms
- 365 rooms
- 136 rooms
- 37 rooms
- 08 rooms
- 39+ rooms
Owner-occupied
Renter-occupied
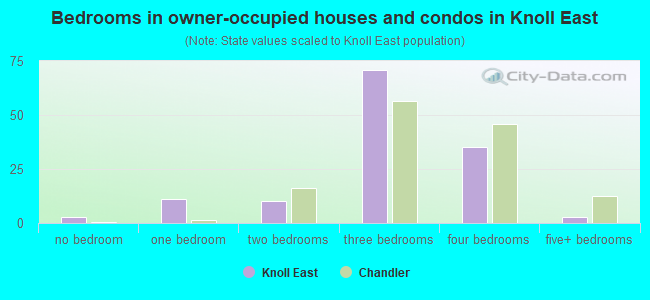
- Bedrooms in owner-occupied houses and condos in Knoll East
- 3no bedroom
- 111 bedroom
- 102 bedrooms
- 713 bedrooms
- 354 bedrooms
- 35+ bedrooms
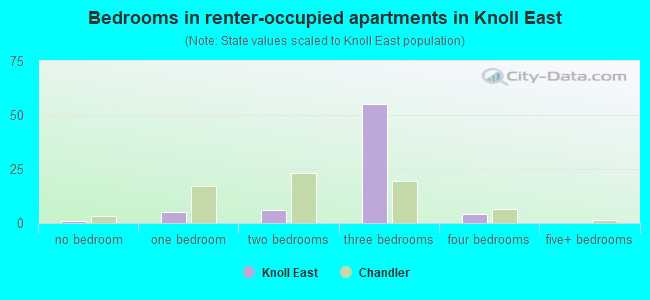
- Bedrooms in renter-occupied apartments in Knoll East
- 1no bedroom
- 51 bedroom
- 62 bedrooms
- 553 bedrooms
- 44 bedrooms
- 05+ bedrooms
Average number of cars or other vehicles available in houses/condos:
Average number of cars or other vehicles available in apartments:
| This neighborhood: | 1.9 |
| Chandler: | 2.1 |
Average number of cars or other vehicles available in apartments:
| Here: | 1.9 |
| city: | 1.5 |
Percentage of units with a mortgage:
| Knoll East: | 66.7% |
| Chandler: | 73.1% |
Average estimated value of detached houses in 2022 (99.4% of all units):
| Knoll East: | $357,978 |
| Chandler: | $480,818 |
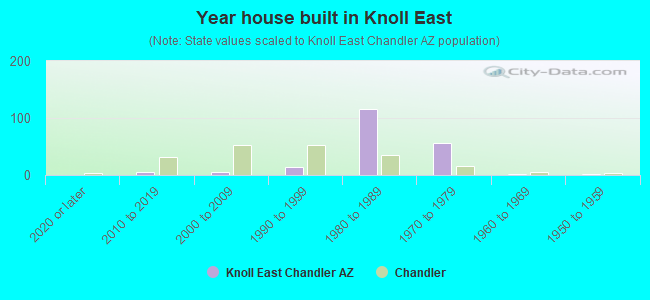
- Year house built in Knoll East
- 02020 or later
- 52010 to 2019
- 62000 to 2009
- 141990 to 1999
- 1151980 to 1989
- 561970 to 1979
- 11960 to 1969
- 21950 to 1959
- 01940 to 1949
- 01939 or earlier
City-data.com crime index for city in 2020 (higher means more crime):
| City: | 165.7 |
| U.S. average: | 219.5 |
Travel time to work (commute)
![Travel time to work (commute)]()
- 3Less than 5 minutes
- 135 to 9 minutes
- 3610 to 14 minutes
- 5315 to 19 minutes
- 5220 to 24 minutes
- 2625 to 29 minutes
- 2830 to 34 minutes
- 235 to 39 minutes
- 540 to 44 minutes
- 745 to 59 minutes
- 1160 to 89 minutes
- 290 or more minutes

Means of transportation to work
![Means of transportation to work]()
- 69.4%183Drove a car alone
- 6.8%18Carpooled
- 0.8%2Bus
- 3.8%10Motorcycle
- 8.7%23Bicycle
- 0.4%1Other means
- 19.7%52Worked at home

Time leaving home to go to work
![Time leaving home to go to work]()
- 1312:00 a.m. to 4:59 a.m.
- 235:00 a.m. to 5:29 a.m.
- 45:30 a.m. to 5:59 a.m.
- 256:00 a.m. to 6:29 a.m.
- 206:30 a.m. to 6:59 a.m.
- 327:00 a.m. to 7:29 a.m.
- 447:30 a.m. to 7:59 a.m.
- 198:00 a.m. to 8:29 a.m.
- 98:30 a.m. to 8:59 a.m.
- 169:00 a.m. to 9:59 a.m.
- 410:00 a.m. to 10:59 a.m.
- 311:00 a.m. to 11:59 a.m.
- 1812:00 p.m. to 3:59 p.m.
- 164:00 p.m. to 11:59 p.m.

Occupations of males:
- Percentage of males in management occupations (except farmers):
Here: 15.1% city: 13.0%
- Percentage of males in business and financial operations occupations:
Here: 5.8% city: 7.1%
- Percentage of males in computer and mathematical occupations:
Here: 2.3% city: 8.4%
- Percentage of males in architecture and engineering occupations:
Here: 7.7% city: 9.9%
- Percentage of males in life, physical, and social science occupations:
Here: 2.5% city: 0.8%
- Percentage of males in community and social services occupations:
Here: 1.2% city: 0.9%
- Percentage of males in legal occupations:
Here: 1.3% city: 0.5%
- Percentage of males in healthcare practitioners and technical occupations:
Here: 5.1% city: 3.0%
- Percentage of males in service occupations:
Here: 3.5% city: 11.0%
- Percentage of males in sales and office occupations:
Here: 32.9% city: 17.8%
- Percentage of males in construction, extraction, and maintenance occupations:
Here: 7.7% city: 5.9%
- Percentage of males in production occupations:
Here: 6.4% city: 4.4%
- Percentage of males in transportation occupations:
Here: 3.5% city: 3.6%
Occupations of females:
- Percentage of females in management occupations (except farmers):
Here: 12.4% city: 11.0%
- Percentage of females in business and financial operations occupations:
Here: 7.9% city: 9.3%
- Percentage of females in community and social services occupations:
Here: 1.1% city: 2.1%
- Percentage of females in education, training, and library occupations:
Here: 5.5% city: 8.7%
- Percentage of females in arts, design, entertainment, sports, and media occupations:
Here: 4.2% city: 2.1%
- Percentage of females in healthcare practitioners and technical occupations:
Here: 6.9% city: 9.8%
- Percentage of females in service occupations:
Here: 15.5% city: 15.2%
- Percentage of females in sales and office occupations:
Here: 42.6% city: 28.7%
- Percentage of females in transportation occupations:
Here: 1.4% city: 1.1%
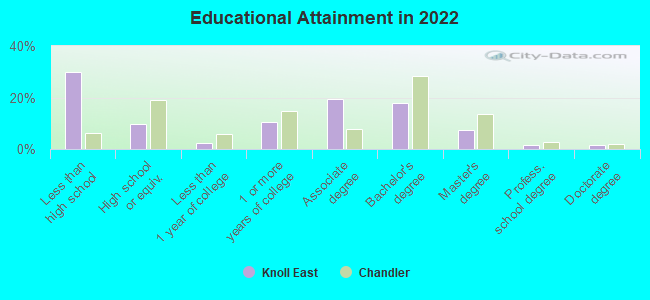
Education in this neighborhood (subdivision or community):
- Percentage of people 3 years and older in K-12 schools:
Knoll East: 11.8% Chandler: 19.1%
- Percentage of people 3 years and older in undergraduate colleges:
Knoll East: 6.5% Chandler: 4.5%
- Percentage of people 3 years and older in grad. or professional schools:
Knoll East: 1.0% Chandler: 1.8%
- Percentage of students K-12 enrolled in private schools:
Knoll East: 66.0% Chandler: 14.2%
Percentage of population below poverty level:
| Knoll East: | 2.8% |
| Chandler: | 7.6% |
Median year owner moved in (as recorded in 2022):
Median year renter moved in (as recorded in 2022):
| Knoll East: | 2009 |
| Chandler: | 2013 |
Median year renter moved in (as recorded in 2022):
| Knoll East: | 2016 |
| Chandler: | 2020 |
Percentage of married-couple families with both working:
| Knoll East: | 303.2% |
| Chandler: | 68.1% |
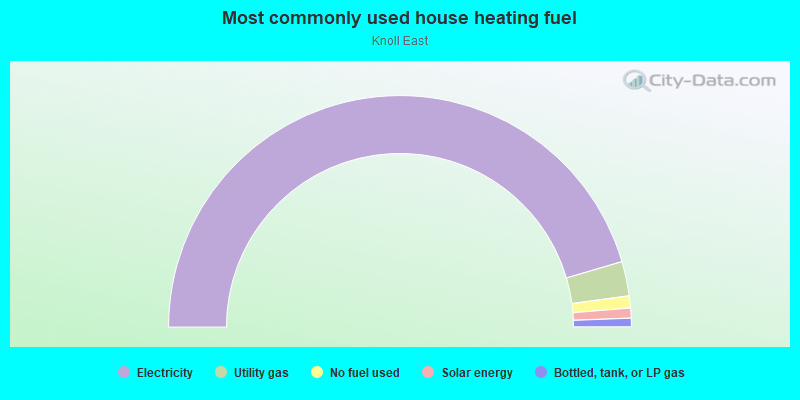
- 91.0%Electricity
- 4.8%Utility gas
- 1.7%No fuel used
- 1.4%Solar energy
- 1.2%Bottled, tank, or LP gas
Roads and streets:
W Marlboro Dr
Length: 0.43 miles
Directions: E-W, N-S, SW-NE
Address range: 1400 to 1849
Directions: E-W, N-S, SW-NE
Address range: 1400 to 1849
W Alamo Dr
Length: 0.34 miles
Directions: E-W, N-S, SW-NE
Address range: 1400 to 1699
Directions: E-W, N-S, SW-NE
Address range: 1400 to 1699
W Comstock Dr
Length: 0.28 miles
Directions: E-W, N-S, SE-NW
Address range: 1500 to 1599
Directions: E-W, N-S, SE-NW
Address range: 1500 to 1599
N Central Dr
Length: 0.19 miles
Directions: N-S, SE-NW
Address range: 2800 to 2999
Directions: N-S, SE-NW
Address range: 2800 to 2999
W Cheyenne Dr
Length: 0.18 miles
Direction: E-W
Address range: 1400 to 1899
Direction: E-W
Address range: 1400 to 1899
W Loughlin Dr
Length: 0.06 miles
Direction: E-W
Direction: E-W
N Pennington Dr
Length: 0.05 miles
Direction: N-S
Address range: 2735 to 2808
Direction: N-S
Address range: 2735 to 2808
N Yucca St
Length: 0.05 miles
Direction: N-S
Address range: 2700 to 2799
Direction: N-S
Address range: 2700 to 2799