Estimated zip code population in 2022: 50,440 Zip code population in 2010: 42,796 Zip code population in 2000: 43,544
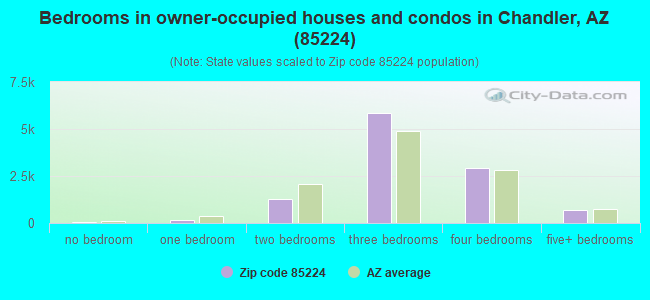
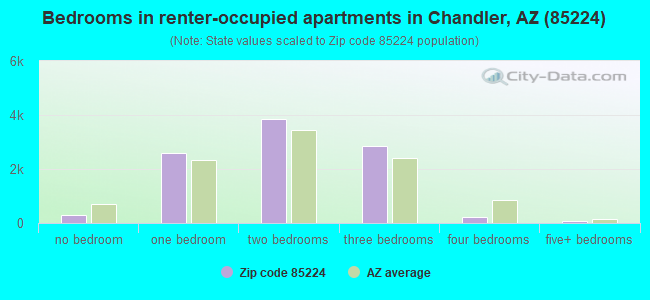
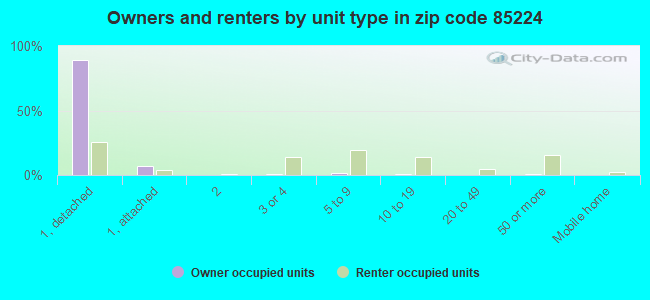
Houses and condos: 22,297 Renter-occupied apartments: 9,957
% of renters here:
48%
State:
33%
March 2022 cost of living index in zip code 85224: 100.9 (near average, U.S. average is 100)
Land area: 9.3 sq. mi. Water area: 0.0 sq. mi.
Population density: 5,405 people per square mile
(average).
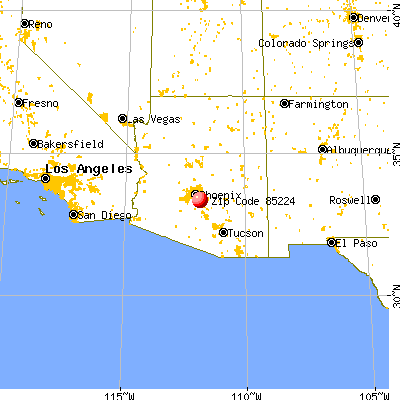
OSM Map
General Map
Google Map
MSN Map
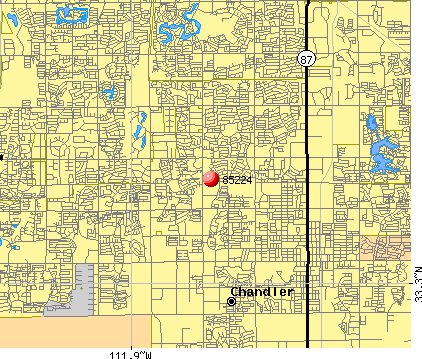
OSM Map
General Map
Google Map
MSN Map
OSM Map
General Map
Google Map
MSN Map
OSM Map
General Map
Google Map
MSN Map
Please wait while loading the map...
Real estate property taxes paid for housing units in 2022:
This zip code:
0.4% ($1,635)
Arizona:
0.4% ($1,786)
Median real estate property taxes paid for housing units with mortgages in 2022: $1,613 (0.4%) Median real estate property taxes paid for housing units with no mortgage in 2022: $1,692 (0.4%)
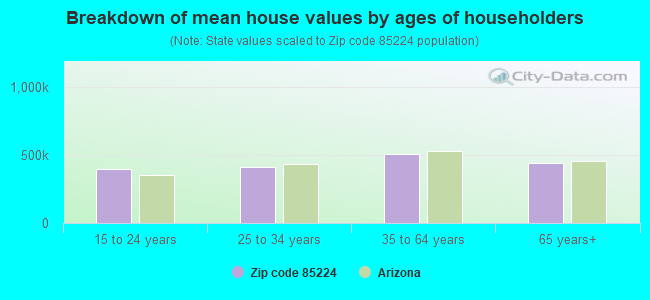
Estimated median house/condo value in 2022: $449,171
85224:
$449,171
Arizona:
$402,800
According to our research of Arizona and other state lists, there were 30 registered sex offenders living in 85224 zip code as of April 27, 2024. The ratio of all residents to sex offenders in zip code 85224 is 1,482 to 1. The ratio of registered sex offenders to all residents in this zip code is lower than the state average.
Median resident age:
This zip code:
37.1 years
Arizona median age:
38.8 years
Average household size:
This zip code:
2.4 people
Arizona:
2.5 people
Averages for the 2020 tax year for zip code 85224, filed in 2021:
Average Adjusted Gross Income (AGI) in 2020: $69,043 (Individual Income Tax Returns)
Here:
$69,043
State:
$73,499
Salary/wage: $61,923 (reported on 86.0% of returns)
Here:
$61,923
State:
$59,499
(% of AGI for various income ranges: 1212.5% for AGIs below $25k, 3916.5% for AGIs $25k-50k, 7174.7% for AGIs $50k-75k, 10875.9% for AGIs $75k-100k, 20275.5% for AGIs $100k-200k, 70185.5% for AGIs over 200k)
Taxable interest for individuals: $1,404 (reported on 23.6% of returns)
This zip code:
$1,404
Arizona:
$2,325
(% of AGI for various income ranges: 11.4% for AGIs below $25k, 9.7% for AGIs $25k-50k, 21.8% for AGIs $50k-75k, 31.0% for AGIs $75k-100k, 79.4% for AGIs $100k-200k, 1401.7% for AGIs over 200k)
Ordinary dividends: $4,254 (reported on 18.3% of returns)
Here:
$4,254
State:
$8,711
(% of AGI for various income ranges: 19.8% for AGIs below $25k, 19.5% for AGIs $25k-50k, 55.0% for AGIs $50k-75k, 83.8% for AGIs $75k-100k, 223.1% for AGIs $100k-200k, 3108.6% for AGIs over 200k)
Net capital gain/loss in AGI: +$15,516 (reported on 17.9% of returns)
Here:
+$15,516
State:
+$31,332
(% of AGI for various income ranges: 17.0% for AGIs below $25k, 26.3% for AGIs $25k-50k, 60.8% for AGIs $50k-75k, 145.6% for AGIs $75k-100k, 604.7% for AGIs $100k-200k, 16290.0% for AGIs over 200k)
Profit/loss from business: +$10,522 (reported on 15.3% of returns)
Here:
+$10,522
State:
+$13,214
(% of AGI for various income ranges: 136.4% for AGIs below $25k, 120.3% for AGIs $25k-50k, 186.6% for AGIs $50k-75k, 230.5% for AGIs $75k-100k, 420.7% for AGIs $100k-200k, 2800.3% for AGIs over 200k)
Taxable individual retirement arrangement distribution: $19,133 (reported on 6.7% of returns)
85224:
$19,133
Arizona:
$23,364
(% of AGI for various income ranges: 48.9% for AGIs below $25k, 73.9% for AGIs $25k-50k, 153.8% for AGIs $50k-75k, 268.4% for AGIs $75k-100k, 474.0% for AGIs $100k-200k, 1923.8% for AGIs over 200k)
Self-employed (Keogh) retirement plans: $20,550 (reported on 0.3% of returns)
85224:
$20,550
Arizona:
$26,938
(% of AGI for various income ranges: 25.7% for AGIs $100k-200k, 249.0% for AGIs over 200k)
Total itemized deductions: $29,315 (reported on 7.8% of returns)
Here:
$29,315
State:
$36,308
(% of AGI for various income ranges: 49.0% for AGIs below $25k, 81.3% for AGIs $25k-50k, 250.2% for AGIs $50k-75k, 445.8% for AGIs $75k-100k, 776.7% for AGIs $100k-200k, 6032.8% for AGIs over 200k)
Charity contributions: $10,191 (reported on 6.3% of returns)
Here:
$10,191
State:
$11,955
(% of AGI for various income ranges: 4.0% for AGIs below $25k, 7.9% for AGIs $25k-50k, 39.2% for AGIs $50k-75k, 66.1% for AGIs $75k-100k, 180.1% for AGIs $100k-200k, 2977.2% for AGIs over 200k)
Taxes paid: $5,832 (reported on 7.8% of returns)
85224:
$5,832
State:
$6,820
(% of AGI for various income ranges: 5.7% for AGIs below $25k, 10.7% for AGIs $25k-50k, 40.8% for AGIs $50k-75k, 95.0% for AGIs $75k-100k, 198.1% for AGIs $100k-200k, 1074.8% for AGIs over 200k)
Earned income credit: $2,004 (reported on 11.9% of returns)
Here:
$2,004
State:
$2,383
(% of AGI for various income ranges: 69.2% for AGIs below $25k, 49.8% for AGIs $25k-50k, 0.6% for AGIs $50k-75k)
Percentage of individuals using paid preparers for their 2020 taxes: 93.4%
Here:
93%
State:
93%
(% for various income ranges: 91.8% for AGIs below $25k, 94.2% for AGIs $25k-50k, 93.5% for AGIs $50k-75k, 94.2% for AGIs $75k-100k, 94.0% for AGIs $100k-200k, 94.4% for AGIs over 200k)
Averages for the 2012 tax year for zip code 85224, filed in 2013:
Average Adjusted Gross Income (AGI) in 2012: $56,307 (Individual Income Tax Returns)
Here:
$56,307
State:
$57,644
Salary/wage: $51,716 (reported on 88.9% of returns)
Here:
$51,716
State:
$47,932
(% of AGI for various income ranges: 79.3% for AGIs below $25k, 87.8% for AGIs $25k-50k, 85.9% for AGIs $50k-75k, 85.8% for AGIs $75k-100k, 83.9% for AGIs $100k-200k, 59.9% for AGIs over 200k)
Taxable interest for individuals: $897 (reported on 27.8% of returns)
This zip code:
$897
Arizona:
$2,064
(% of AGI for various income ranges: 0.8% for AGIs below $25k, 0.4% for AGIs $25k-50k, 0.3% for AGIs $50k-75k, 0.3% for AGIs $75k-100k, 0.3% for AGIs $100k-200k, 0.9% for AGIs over 200k)
Ordinary dividends: $3,821 (reported on 17.3% of returns)
Here:
$3,821
State:
$7,268
(% of AGI for various income ranges: 1.2% for AGIs below $25k, 0.6% for AGIs $25k-50k, 0.5% for AGIs $50k-75k, 0.7% for AGIs $75k-100k, 1.0% for AGIs $100k-200k, 3.8% for AGIs over 200k)
Net capital gain/loss in AGI: +$5,584 (reported on 14.9% of returns)
Here:
+$5,584
State:
+$15,530
(% of AGI for various income ranges: 0.3% for AGIs $50k-75k, 0.5% for AGIs $75k-100k, 0.8% for AGIs $100k-200k, 8.2% for AGIs over 200k)
Profit/loss from business: +$10,422 (reported on 13.5% of returns)
Here:
+$10,422
State:
+$12,323
(% of AGI for various income ranges: 8.4% for AGIs below $25k, 2.1% for AGIs $25k-50k, 2.0% for AGIs $50k-75k, 1.1% for AGIs $75k-100k, 1.9% for AGIs $100k-200k, 3.4% for AGIs over 200k)
Taxable individual retirement arrangement distribution: $13,570 (reported on 7.4% of returns)
85224:
$13,570
Arizona:
$18,280
(% of AGI for various income ranges: 2.3% for AGIs below $25k, 1.7% for AGIs $25k-50k, 1.6% for AGIs $50k-75k, 2.1% for AGIs $75k-100k, 1.9% for AGIs $100k-200k, 1.3% for AGIs over 200k)
Self-employment retirement plans: $23,217 (reported on 0.3% of returns)
85224:
$23,217
Arizona:
$22,154
Total itemized deductions: $18,840 (20% of AGI, reported on 33.3% of returns)
Here:
$18,840
State:
$23,651
Here:
19.9% of AGI
State:
20.6% of AGI
(% of AGI for various income ranges: 10.9% for AGIs below $25k, 8.9% for AGIs $25k-50k, 11.5% for AGIs $50k-75k, 11.8% for AGIs $75k-100k, 12.6% for AGIs $100k-200k, 10.2% for AGIs over 200k)
Charity contributions: $3,146 (reported on 27.3% of returns)
Here:
$3,146
State:
$4,114
(% of AGI for various income ranges: 0.7% for AGIs below $25k, 0.8% for AGIs $25k-50k, 1.4% for AGIs $50k-75k, 1.5% for AGIs $75k-100k, 2.1% for AGIs $100k-200k, 1.9% for AGIs over 200k)
Taxes paid: $5,009 (reported on 33.2% of returns)
85224:
$5,009
State:
$6,509
(% of AGI for various income ranges: 1.5% for AGIs below $25k, 1.7% for AGIs $25k-50k, 2.4% for AGIs $50k-75k, 3.0% for AGIs $75k-100k, 3.8% for AGIs $100k-200k, 4.5% for AGIs over 200k)
Earned income credit: $2,005 (reported on 14.1% of returns)
Here:
$2,005
State:
$2,432
(% of AGI for various income ranges: 5.0% for AGIs below $25k, 0.8% for AGIs $25k-50k)
Percentage of individuals using paid preparers for their 2012 taxes: 44.5%
Here:
44%
State:
52%
(% for various income ranges: 41.4% for AGIs below $25k, 41.6% for AGIs $25k-50k, 47.8% for AGIs $50k-75k, 45.9% for AGIs $75k-100k, 49.8% for AGIs $100k-200k, 69.0% for AGIs over 200k)
Averages for the 2004 tax year for zip code 85224, filed in 2005:
Average Adjusted Gross Income (AGI) in 2004: $49,882 (Individual Income Tax Returns)
Here:
$49,882
State:
$50,097
Salary/wage: $45,745 (reported on 90.9% of returns)
Here:
$45,745
State:
$42,146
(% of AGI for various income ranges: 153.6% for AGIs below $10k, 85.6% for AGIs $10k-25k, 90.0% for AGIs $25k-50k, 89.9% for AGIs $50k-75k, 89.1% for AGIs $75k-100k, 70.5% for AGIs over 100k)
Taxable interest for individuals: $1,209 (reported on 38.7% of returns)
This zip code:
$1,209
Arizona:
$2,374
(% of AGI for various income ranges: 5.2% for AGIs below $10k, 1.2% for AGIs $10k-25k, 0.6% for AGIs $25k-50k, 0.5% for AGIs $50k-75k, 0.5% for AGIs $75k-100k, 1.4% for AGIs over 100k)
Taxable dividends: $1,649 (reported on 21.3% of returns)
Here:
$1,649
State:
$3,888
(% of AGI for various income ranges: 4.2% for AGIs below $10k, 0.9% for AGIs $10k-25k, 0.5% for AGIs $25k-50k, 0.4% for AGIs $50k-75k, 0.4% for AGIs $75k-100k, 1.0% for AGIs over 100k)
Net capital gain/loss: +$10,788 (reported on 17.7% of returns)
Here:
+$10,788
State:
+$17,569
(% of AGI for various income ranges: -1.6% for AGIs below $10k, -0.1% for AGIs $10k-25k, 0.2% for AGIs $25k-50k, 0.3% for AGIs $50k-75k, 0.4% for AGIs $75k-100k, 10.8% for AGIs over 100k)
Profit/loss from business: +$8,453 (reported on 13.2% of returns)
Here:
+$8,453
State:
+$11,088
(% of AGI for various income ranges: 0.5% for AGIs below $10k, 4.1% for AGIs $10k-25k, 1.7% for AGIs $25k-50k, 2.1% for AGIs $50k-75k, 1.9% for AGIs $75k-100k, 2.4% for AGIs over 100k)
IRA payment deduction: $2,699 (reported on 2.3% of returns)
85224:
$2,699
Arizona:
$3,023
(% of AGI for various income ranges: 0.6% for AGIs below $10k, 0.1% for AGIs $10k-25k, 0.2% for AGIs $25k-50k, 0.1% for AGIs $50k-75k, 0.1% for AGIs $75k-100k, 0.1% for AGIs over 100k)
Self-employed pension: $10,196 (reported on 0.5% of returns)
Here:
$10,196
Arizona:
$15,785
(% of AGI for various income ranges: 0.3% for AGIs below $10k, 0.0% for AGIs $25k-50k, 0.1% for AGIs $50k-75k, 0.1% for AGIs $75k-100k, 0.2% for AGIs over 100k)
Total itemized deductions: $16,638 (21% of AGI, reported on 43.4% of returns)
Here:
$16,638
State:
$19,781
Here:
20.9% of AGI
State:
21.8% of AGI
(% of AGI for various income ranges: 24.5% for AGIs below $10k, 10.4% for AGIs $10k-25k, 13.8% for AGIs $25k-50k, 16.4% for AGIs $50k-75k, 16.7% for AGIs $75k-100k, 13.4% for AGIs over 100k)
Charity contributions deductions: $2,607 (3% of AGI, reported on 38.3% of returns)
Here:
$2,607
State:
$3,389
Here:
3.1% of AGI
State:
3.5% of AGI
(% of AGI for various income ranges: 1.1% for AGIs below $10k, 0.8% for AGIs $10k-25k, 1.4% for AGIs $25k-50k, 2.0% for AGIs $50k-75k, 2.4% for AGIs $75k-100k, 2.4% for AGIs over 100k)
Total tax: $7,143 (reported on 81.4% of returns)
85224:
$7,143
State:
$8,323
(% of AGI for various income ranges: 4.2% for AGIs below $10k, 4.4% for AGIs $10k-25k, 7.5% for AGIs $25k-50k, 9.4% for AGIs $50k-75k, 10.7% for AGIs $75k-100k, 17.8% for AGIs over 100k)
Earned income credit: $1,582 (reported on 10.5% of returns)
Here:
$1,582
State:
$1,786
Percentage of individuals using paid preparers for their 2004 taxes: 50.1%
Here:
50%
State:
60%
(% for various income ranges: 43.2% for AGIs below $10k, 50.7% for AGIs $10k-25k, 48.5% for AGIs $25k-50k, 53.4% for AGIs $50k-75k, 51.1% for AGIs $75k-100k, 57.6% for AGIs over 100k)
Likely homosexual households (counted as self-reported same-sex unmarried-partner households)
Lesbian couples: 0.2% of all households
Gay men: 0.0% of all households
Household received Food Stamps/SNAP in the past 12 months: 994 Household did not receive Food Stamps/SNAP in the past 12 months: 20,037
Women who had a birth in the past 12 months: 669 (554 now married, 123 unmarried) Women who did not have a birth in the past 12 months: 11,761 (4,417 now married, 7,355 unmarried)
Housing units in zip code 85224 with a mortgage: 7,450 (655 second mortgage, 10 home equity loan, 570 both second mortgage and home equity loan) Houses without a mortgage: 14
Median monthly owner costs for units with a mortgage: $1,606 Median monthly owner costs for units without a mortgage: $439
Residents with income below the poverty level in 2022:
This zip code:
6.3%
Whole state:
12.5%
Residents with income below 50% of the poverty level in 2022:
This zip code:
2.7%
Whole state:
6.0%
Median number of rooms in houses and condos:
Here:
6.0
State:
6.0
Median number of rooms in apartments:
Here:
4.0
State:
4.1
Notable locations in this zip code not listed on our city pages
Shopping Centers: Mervyns Plaza Shopping Center (1), Sun Village Fair Shopping Center (2), Warner Plaza Shopping Center (3). Display/hide their locations on the map
Churches in zip code 85224 include: Chandler Faith Community Church (A), Community of Christ (B), Christ's Community Church (C), Chandler Seventh Day Adventist Church (D), Chandler Crossroads Nazarene Church (E), Chandler Cathedral of Praise Church (F), Chandler Calvary Evangelical Lutheran Church (G), The Church of Jesus Christ of Latter Day Saints (H), Tempe Korean Presbyterian Church (I). Display/hide their locations on the map
6,649 married couples with children.
2,841 single-parent households (1,247 men, 1,594 women).
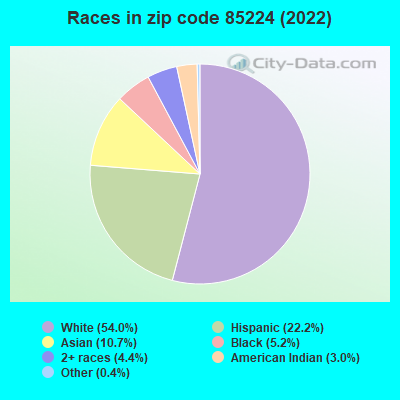
77.1% of residents of 85224 zip code speak English at home.
11.0% of residents speak Spanish at home (82% very well, 9% well, 3% not well, 6% not at all).
3.3% of residents speak other Indo-European language at home (72% very well, 19% well, 6% not well, 3% not at all).
7.6% of residents speak Asian or Pacific Island language at home (64% very well, 20% well, 13% not well, 3% not at all).
1.2% of residents speak other language at home (98% very well, 2% well).
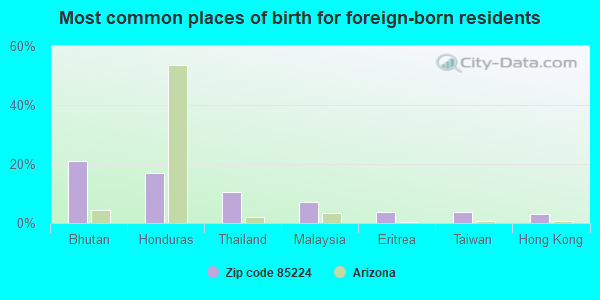
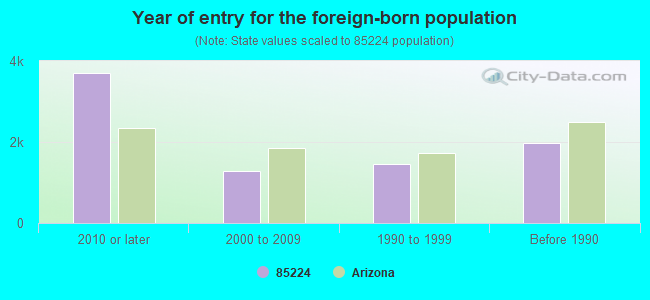
Foreign born population: 7,132 (14.1%) (54.2% of them are naturalized citizens)
Major facilities with environmental interests located in this zip code:
FREESCALE SEMICONDUCTOR - CHANDLER (1300 NORTH ALMA SCHOOL ROAD CH290 in CHANDLER, AZ)
AIR SYNTHETIC MINOR (AIRS/AFS) CRITERIA AND HAZARDOUS AIR POLLUTANT INVENTORY (Inventory of air pollution sources) PERFORMANCE TRACK (National Environmental Performance Track) HAZARDOUS WASTE BIENNIAL REPORTER (Resource Conservation and Recovery Act (tracking hazardous waste)) Large Quantity Generators, more that 1000 kg of hazardous waste/month (Resource Conservation and Recovery Act (tracking hazardous waste)) - notification TRI REPORTER (Tracking of toxic chemicals releasing facilities) Business SIC classification: SEMICONDUCTORS AND RELATED DEVICES Business NAICS classification: SEMICONDUCTOR AND RELATED DEVICE MANUFACTURING.; SEMICONDUCTOR AND RELATED DEVICE MANUFACTURING. Organizations: FREESCALE SEMICONDUCTOR INC (CONTACT/OPERATOR)
, MOTOROLA INC (CONTACT/OWNER)
Alternative names: MOTOROLA INC, MOTOROLA CHANDLER
WALBAR - ARIZONA DIVISION (323 SOUTH BRACKEN LANE in CHANDLER, AZ)
STATE MASTER (Arizona's Tracking Of The Environment) - AZURITE-5440, PESTICIDES PROGRAM CRITERIA AND HAZARDOUS AIR POLLUTANT INVENTORY (Inventory of air pollution sources) Small Quantity Generators, between 100 kg and 1000 kg of hazardous waste/month (Resource Conservation and Recovery Act (tracking hazardous waste)) - notification TRI REPORTER (Tracking of toxic chemicals releasing facilities) Business SIC classification: AIRCRAFT ENGINES AND ENGINE PARTS Business NAICS classification: AIRCRAFT ENGINE AND ENGINE PARTS MANUFACTURING. Organizations: COLTEC INDUSTRIES (CONTACT/OWNER)
Alternative names: BF GOODRICH TURBOMACHINERY PRODS., BFGOODRICH TURBOMACHINERY PRODS., GOODRICH TURBOMACHINERY PRODS., TURBOMACHINERY PRODUCTS / WALBAR INC AZ, TURBOMACHINERY PRODUCTS / WALBAR INC AZ, WALBAR INC AZ DIVISION, WALBAR ARZONIA DIVISION, WALBAR ENGINE COMPONENTS, WALBAR METALS
CUSD NUMBER 80 CHANDLER HIGH SCHOOL (350 N ARIZONA AVE in CHANDLER, AZ)
(Geographic Names Information System) (National Center for Education Statistics) - STATE ID-202 Small Quantity Generators, between 100 kg and 1000 kg of hazardous waste/month (Resource Conservation and Recovery Act (tracking hazardous waste)) - notification Organizations: CHANDLER UNIFIED SCHOOL DIST 80 (CONTACT/OWNER)
, CHANDLER UNIFIED DISTRICT (SCHOOL DISTRICT)
GOULD ELECTRONICS INC. (2929 WEST CHANDLER BOULEVARD in CHANDLER, AZ)
CRITERIA AND HAZARDOUS AIR POLLUTANT INVENTORY (Inventory of air pollution sources) HAZARDOUS WASTE BIENNIAL REPORTER (Resource Conservation and Recovery Act (tracking hazardous waste)) Large Quantity Generators, more that 1000 kg of hazardous waste/month (Resource Conservation and Recovery Act (tracking hazardous waste)) TSD (Resource Conservation and Recovery Act (tracking hazardous waste)) TRI REPORTER (Tracking of toxic chemicals releasing facilities) Business SIC and NAICS classification: ELECTROPLATING, PLATING, POLISHING, ANODIZING, AND COLORING Organizations: GOULD INC FOIL DIVISION (CONTACT/OWNER)
, NIKKO MATERIALS USA INC (CONTACT/OWNER)
, NIKKO MATERIALS USA INC DBA GOULD (CONTACT/OWNER)
Alternative names: GOULD INC FOIL DIV
HARTFORD ELEMENTARY SCHOOL (700 N HARTFORD ST in CHANDLER, AZ)
(Geographic Names Information System) (National Center for Education Statistics) - STATE ID-108 Organizations: CHANDLER UNIFIED DISTRICT (SCHOOL DISTRICT)
ERIE ELEMENTARY SCHOOL (1150 W ERIE ST in CHANDLER, AZ)
(Geographic Names Information System) (National Center for Education Statistics) - STATE ID-106 Organizations: CHANDLER UNIFIED DISTRICT (SCHOOL DISTRICT)
EL DORADO HIGH SCHOOL (2200 N. ARIZONA AVE. in CHANDLER, AZ)
(National Center for Education Statistics) - STATE ID-212 Organizations: EL DORADO PUBLIC CHARTER HIGH SCHOOL (SCHOOL DISTRICT)
DOBSON ACADEMY, THE - A BALL CHARTER SCHOOL (2207 N. DOBSON RD. in CHANDLER, AZ)
(National Center for Education Statistics) - STATE ID-102 Organizations: BALL CHARTER SCHOOLS (DOBSON) (SCHOOL DISTRICT)
EVIT CHANDLER HIGH (350 N ARIZONA AVE in CHANDLER, AZ)
(National Center for Education Statistics) - STATE ID-003 Organizations: EAST VALLEY INSTITUTE OF TECHNOLOGY (SCHOOL DISTRICT)
DR HOWARD K CONLEY ELEMENTARY SCHOOL (500 S ARROWHEAD DR in CHANDLER, AZ)
(National Center for Education Statistics) - STATE ID-122 Organizations: CHANDLER UNIFIED DISTRICT (SCHOOL DISTRICT)
AZ PROCESSING INC (RIGGS AND MARICOPA RD in CHANDLER, AZ) . Tribal Land
CRITERIA AND HAZARDOUS AIR POLLUTANT INVENTORY (Inventory of air pollution sources) Conditionally Exempt Small Quantity Generators, less than 100 kg/month of hazardous waste (Resource Conservation and Recovery Act (tracking hazardous waste)) - notification TSD (Resource Conservation and Recovery Act (tracking hazardous waste)) (Resource Conservation and Recovery Act (tracking hazardous waste))
BRIGHT BEGINNINGS SCHOOL #1 (400 N. ANDERSEN BLVD. in CHANDLER, AZ)
(National Center for Education Statistics) - STATE ID-101 Organizations: BRIGHT BEGINNINGS SCHOOL, INC. (SCHOOL DISTRICT)
FRYE ELEMENTARY SCHOOL (801 E FRYE RD in CHANDLER, AZ)
(National Center for Education Statistics) - STATE ID-111 Organizations: CHANDLER UNIFIED DISTRICT (SCHOOL DISTRICT)
Housing units lacking complete plumbing facilities: 0.2% Housing units lacking complete kitchen facilities: 1.7%
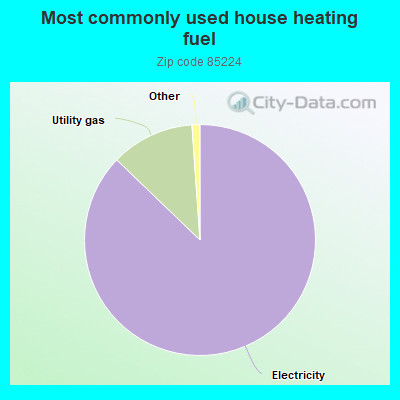
87.2%Electricity
11.7%Utility gas
Population in 1990: 54,023.
Place of birth for U.S.-born residents:
This state: 20,141
Northeast: 3,826
Midwest: 6,640
South: 2,986
West: 8,742
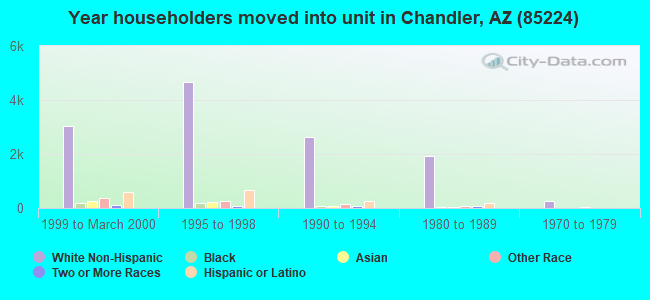
44% of the 85224 zip code residents lived in the same house 5 years ago. Out of people who lived in different houses, 60% lived in this county. Out of people who lived in different counties, 50% lived in Arizona.
87% of the 85224 zip code residents lived in the same house 1 year ago. Out of people who lived in different houses, 55% moved from this county. Out of people who lived in different houses, 10% moved from different county within same state. Out of people who lived in different houses, 31% moved from different state. Out of people who lived in different houses, 4% moved from abroad.
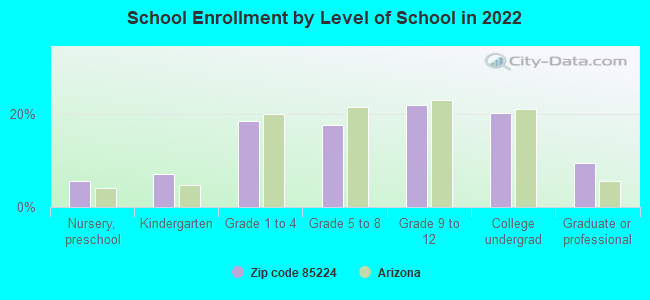
Private vs. public school enrollment:
Students in private schools in grades 1 to 8 (elementary and middle school): 587
Here:
14.8%
Arizona:
10.4%
Students in private schools in grades 9 to 12 (high school): 165
Here:
6.9%
Arizona:
8.8%
Students in private undergraduate colleges: 476
Here:
21.7%
Arizona:
13.1%
Occupation by median earnings in the past 12 months ($)
95,828Architecture and engineering occupations
94,916Computer and mathematical occupations
79,512Legal occupations
73,703Management occupations
70,402Health diagnosing and treating practitioners and other technical occupations
68,044Life, physical, and social science occupations
Companies with federal contracts located in this zip code (CHANDLER, AZ):
GOODRICH TURBOMACHINERY PRODUC (323 S BRACKEN LANE; small business) 100 employees, $0 revenue. : $46,616,110 in 46 contractsfrom 2000 to 2006
Contracts for Gas Turbines and Jet Engines, Aircraft; Prime Moving, and Components, Gas Turbines and Jet Engines, Non-Aircraft; and Components, Engine Cooling System Components, Nonaircraft, Aircraft Air Conditioning, Heating, and Pressurizing Equipment, and moreby Defense Logistics Agency, Army, Air Force, Navy, and others Signed by year:2000: $13,587,308; 2001: $13,871,160; 2002: $1,352,668; 2003: $9,994,984; 2004: $4,691,034; 2005: $2,340,996; 2006: $777,960.
Biggest contracts:
$6,217,202 with Defense Logistics Agency for Gas Turbines and Jet Engines, Aircraft; Prime Moving, and Components. Signed on 2000-11-27. Completion date: 2002-07-20.
$3,767,564 with Army for Gas Turbines and Jet Engines, Non-Aircraft; and Components. Signed on 2004-12-07. Completion date: 2006-02-28.
$3,646,755, same as above.Signed on 2003-07-10. Completion date: 2004-05-31.
$3,088,432 with Air Force for Gas Turbines and Jet Engines, Aircraft; Prime Moving, and Components. Signed on 2001-04-11. Completion date: 2001-12-31.
SPACE DATA CORPORATION (460 S BENSON LN 11-12; small business) : $1,642,237 in 5 contractsfrom 2005 to 2006
Contracts for Aeronautics and Space Technology -- Engineering Development (R&D) by Air Force Signed by year:2000: $0; 2001: $0; 2002: $0; 2003: $0; 2004: $0; 2005: $1,306,235; 2006: $336,002.
Biggest contracts:
$478,000 with Air Force for Aeronautics and Space Technology -- Engineering Development (R&D). Taking place in CO. Signed on 2005-09-15. Completion date: 2006-08-07.
$428,235, same as above.Signed on 2005-09-21. Completion date: 2006-08-07.
$400,000, same as above.Signed on 2005-08-08. Completion date: 2006-04-28.
$302,984, same as above.Signed on 2006-06-13. Completion date: 2006-11-30.
CENTRAL EQUIPMENT SUPPLY CO (3029 N ALMA SCHOOL RD; small business) : $309,330 in 10 contractsfrom 2002 to 2004
Contracts for Prefabricated and Portable Buildings, Materials Feeders, Cabinets, Lockers, Bins, and Shelving, Building Components, Prefabricated, and moreby Navy, Defense Logistics Agency, Air Force, Forest Service, and others Signed by year:2000: $0; 2001: $0; 2002: $27,608; 2003: $74,170; 2004: $207,552; 2005: $0; 2006: $0.
Biggest contracts:
$69,500 with Navy for Prefabricated and Portable Buildings. Signed on 2003-01-30. Completion date: 2003-03-07.
$49,540 with Defense Logistics Agency for Materials Feeders. Signed on 2004-11-17. Completion date: 2004-12-22.
$48,286 with Air Force for Cabinets, Lockers, Bins, and Shelving. Taking place in GA. Signed on 2004-03-18. Completion date: 2004-04-26.
$33,825 with Forest Service for Building Components, Prefabricated. Taking place in UT. Signed on 2004-08-04. Completion date: 2004-10-04.
RISSER TECHNOLOGY & ENGINEERIN (2724 W PALOMINO DR; small business)
$63,843 with Navy for Defense Ships -- Basic Research (R&D). Signed on 2002-05-23. Completion date: 2002-11-16.
BOLDER PROJECT INC (1900 W CHANL BLVD)
$44,000 with Army for Other Education and Training Services. Signed on 2000-09-08. Completion date: 2000-10-30.
SPAHR MECHANICAL SERVICE INC (1430 W FOLLEY ST; small business)
$36,500 with Air Force for Maintenance, Repair or Alteration of Real Property -- Heating and Cooling Plants. Signed on 2002-09-27. Completion date: 2002-11-30.
PILGRIM SCREW CORPORATION (2875 W FRYE RD; small business) : $19,381 in 6 contractsfrom 2004 to 2006
Contracts for Screws by Defense Logistics Agency Signed by year:2000: $0; 2001: $0; 2002: $0; 2003: $0; 2004: $2,517; 2005: $13,465; 2006: $3,399.
Biggest contracts:
$3,615 with Defense Logistics Agency for Screws. Signed on 2005-03-26. Completion date: 2005-07-27.
$3,480, same as above.Signed on 2005-12-30. Completion date: 2006-03-30.
$3,399, same as above.Signed on 2006-05-03. Completion date: 2006-10-29.
$3,225, same as above.Signed on 2005-03-22. Completion date: 2005-05-07.
NIKKO MATERIALS USA INC (125 N PRICE RD; small business) : $16,088 in 2 contractsin 2005
$9,900 with Army for Semiconductor Devices and Associated Hardware. Signed on 2005-09-29. Completion date: 2005-10-31.
$6,188, same as above.Signed on 2005-09-21. Completion date: 2005-11-10.
CREATIVE MARKETING MEDIA (400 N CORONADO #2019; small business)
$3,200 with Army for Other ADP and Telecommunications Services (includes data storage on tapes, compact disks, etc.). Signed on 2003-07-17. Completion date: 2003-07-31.
Top industries in this zip code by the number of employees in 2005:
Health Care and Social Assistance: General Medical and Surgical Hospitals (over 1000 employees: 1 establishment)
2005 - 2018 National Fire Incident Reporting System (NFIRS) incidents
Based on the data from the years 2005 - 2018 the average number of fires per year is 57. The highest number of reported fire incidents - 111 took place in 2009, and the least - 4 in 2006. The data has a growing trend.
When looking into fire subcategories, the most incidents belonged to: Structure Fires (45.6%), and Outside Fires (26.0%).
Fire incident types reported to NFIRS in Zip Code 85224


 Nearest zip codes: 85225, 85202, 85284, 85283, 85286, 85233.


 Based on the data from the years 2005 - 2018 the average number of fires per year is 57. The highest number of reported fire incidents - 111 took place in 2009, and the least - 4 in 2006. The data has a growing trend.
 When looking into fire subcategories, the most incidents belonged to: Structure Fires (45.6%), and Outside Fires (26.0%).