Orange Tree neighborhood in Chandler, Arizona (AZ), 85224 detailed profile
Settings
X

Business Search - 14 Million verified businesses
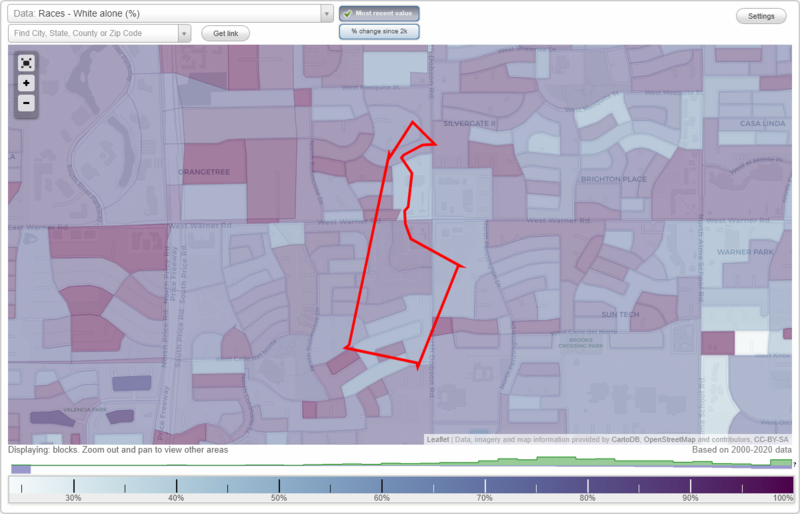
Area: 0.235 square miles
Population: 597
Population density:
| Orange Tree: | 2,545 people per square mile |
| Chandler: | 4,849 people per square mile |

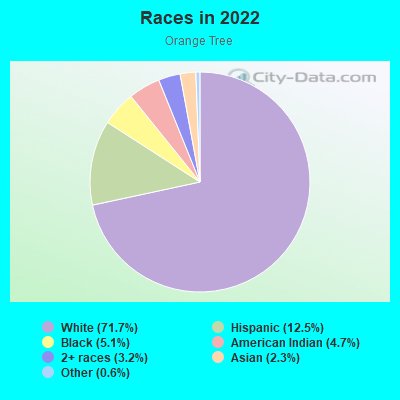
- 47671.7%White
- 8312.5%Hispanic or Latino
- 345.1%Black
- 314.7%American Indian
- 213.2%Two or more races
- 152.3%Asian
- 40.6%Some other race
Median household income in 2022:
| Orange Tree: | $114,000 |
| Chandler: | $98,664 |
Distribution of median household income
![Distribution of median household income]()
- 14Less than $10,000
- 25$10,000 to $19,999
- 8$20,000 to $29,999
- 24$30,000 to $39,999
- 16$40,000 to $49,999
- 11$50,000 to $59,999
- 20$60,000 to $74,999
- 65$75,000 to $99,999
- 41$100,000 to $124,999
- 9$125,000 to $149,999
- 10$150,000 to $199,999
- 15$200,000 or more

Distribution of owner-occupied house/condo value
![Distribution of owner-occupied house/condo value]()
- 4Less than $50,000
- 6$50,000 to $99,999
- 17$150,000 to $199,999
- 31$200,000 to $249,999
- 30$250,000 to $299,999
- 73$300,000 to $399,999
- 22$400,000 to $499,999
- 28$500,000 to $749,999
- 4$750,000 to $999,999
- 19$1,000,000 or more

Distribution of rent paid by renters
![Distribution of rent paid by renters]()
- 19$300 to $399
- 2$400 to $499
- 5$500 to $599
- 38$600 to $699
- 7$700 to $799
- 6$1,000 to $1,249
- 4$1,250 to $1,499
- 5$1,500 to $1,999
- 30$2,000 or more

Median rent in 2022:
| Orange Tree: | $1,322 |
| Chandler: | $1,692 |
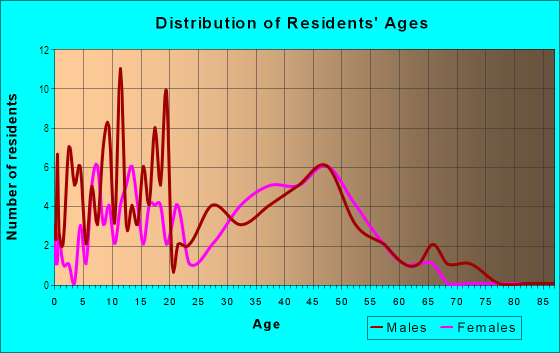
| Males: | 261 |
| Females: | 335 |
Males:
| This neighborhood: | 40.5 years |
| Whole city: | 35.8 years |
| This neighborhood: | 41.3 years |
| Whole city: | 38.3 years |
Average household size:
| Orange Tree: | 8.5 people |
| Chandler: | 2.6 people |
Percentage of family households:
| Orange Tree: | 54.1% |
| Chandler: | 53.2% |
| Here: | 68.8% |
| Chandler: | 50.7% |
Percentage of married-couple families with children (among all households):
| Orange Tree: | 29.5% |
| Chandler: | 26.2% |
Percentage of single-mother households (among all households):
| Orange Tree: | 2.8% |
| Chandler: | 7.3% |
Percentage of never married males 15 years old and over:
Percentage of never married females 15 years old and over:
| Orange Tree: | 15.7% |
| Chandler: | 20.3% |
Percentage of never married females 15 years old and over:
| Orange Tree: | 15.8% |
| city: | 14.9% |
Percentage of people that speak English not well or not at all:
| Orange Tree: | 0.0% |
| Chandler: | 3.1% |
Percentage of people born in this state:
Percentage of people born in another U.S. state:
Percentage of native residents but born outside the U.S.:
Percentage of foreign born residents:
| Here: | 40.5% |
| Chandler: | 35.8% |
Percentage of people born in another U.S. state:
| Orange Tree: | 49.3% |
| Chandler: | 44.6% |
Percentage of native residents but born outside the U.S.:
| Here: | 0.9% |
| city: | 1.5% |
Percentage of foreign born residents:
| Here: | 9.3% |
| Chandler: | 18.0% |
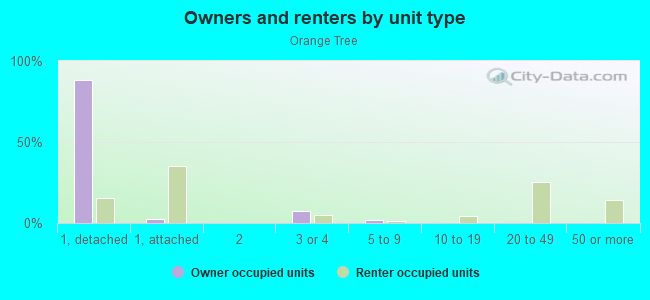
Owner-occupied
Renter-occupied

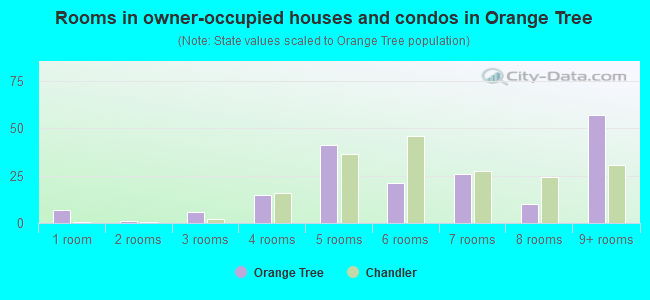
- Rooms in owner-occupied houses and condos in Orange Tree
- 71 room
- 12 rooms
- 63 rooms
- 154 rooms
- 415 rooms
- 216 rooms
- 267 rooms
- 108 rooms
- 579+ rooms
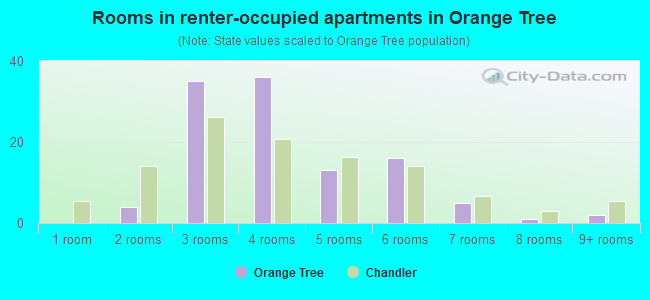
- Rooms in renter-occupied apartments in Orange Tree
- 01 room
- 42 rooms
- 353 rooms
- 364 rooms
- 135 rooms
- 166 rooms
- 57 rooms
- 18 rooms
- 29+ rooms
Owner-occupied
Renter-occupied
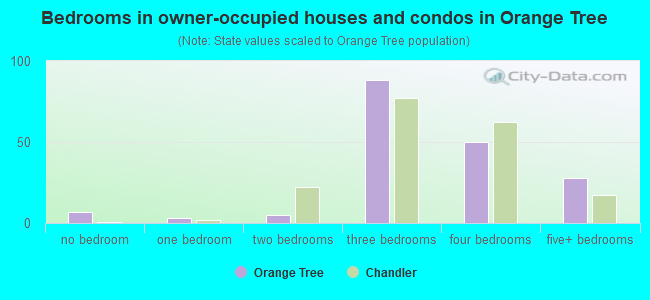
- Bedrooms in owner-occupied houses and condos in Orange Tree
- 7no bedroom
- 31 bedroom
- 52 bedrooms
- 883 bedrooms
- 504 bedrooms
- 285+ bedrooms
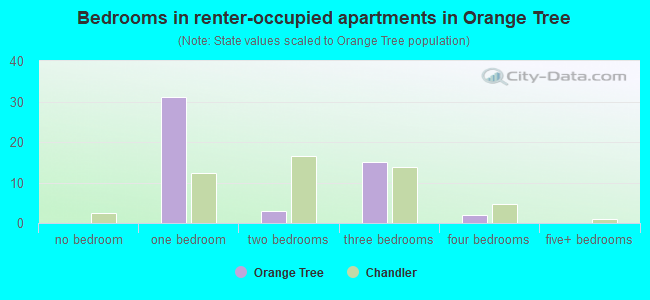
- Bedrooms in renter-occupied apartments in Orange Tree
- 0no bedroom
- 311 bedroom
- 32 bedrooms
- 153 bedrooms
- 24 bedrooms
- 05+ bedrooms
Average number of cars or other vehicles available in houses/condos:
Average number of cars or other vehicles available in apartments:
| This neighborhood: | 2.7 |
| Chandler: | 2.1 |
Average number of cars or other vehicles available in apartments:
| Here: | 2.0 |
| city: | 1.5 |
Percentage of units with a mortgage:
| Orange Tree: | 70.2% |
| Chandler: | 73.1% |
Average estimated value of detached houses in 2022 (97.8% of all units):
| Orange Tree: | $398,514 |
| Chandler: | $480,818 |
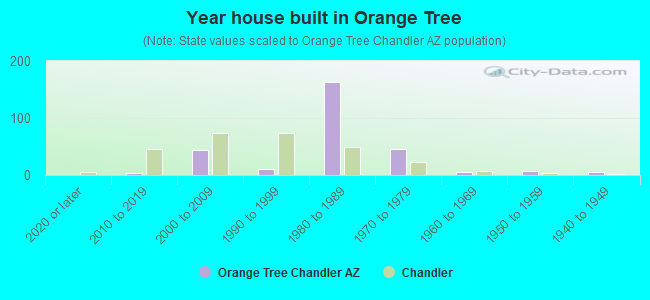
- Year house built in Orange Tree
- 02020 or later
- 32010 to 2019
- 432000 to 2009
- 111990 to 1999
- 1631980 to 1989
- 451970 to 1979
- 51960 to 1969
- 71950 to 1959
- 61940 to 1949
- 01939 or earlier
City-data.com crime index for city in 2020 (higher means more crime):
| City: | 165.7 |
| U.S. average: | 219.5 |
Travel time to work (commute)
![Travel time to work (commute)]()
- 5Less than 5 minutes
- 305 to 9 minutes
- 2310 to 14 minutes
- 4115 to 19 minutes
- 4720 to 24 minutes
- 1425 to 29 minutes
- 1130 to 34 minutes
- 1135 to 39 minutes
- 840 to 44 minutes
- 445 to 59 minutes
- 2360 to 89 minutes
- 590 or more minutes

Means of transportation to work
![Means of transportation to work]()
- 89.4%236Drove a car alone
- 7.6%20Carpooled
- 1.1%3Bus
- 2.7%7Motorcycle
- 3.0%8Walked
- 4.2%11Other means
- 10.2%27Worked at home

Time leaving home to go to work
![Time leaving home to go to work]()
- 412:00 a.m. to 4:59 a.m.
- 95:00 a.m. to 5:29 a.m.
- 275:30 a.m. to 5:59 a.m.
- 186:00 a.m. to 6:29 a.m.
- 106:30 a.m. to 6:59 a.m.
- 107:00 a.m. to 7:29 a.m.
- 237:30 a.m. to 7:59 a.m.
- 318:00 a.m. to 8:29 a.m.
- 88:30 a.m. to 8:59 a.m.
- 69:00 a.m. to 9:59 a.m.
- 1110:00 a.m. to 10:59 a.m.
- 311:00 a.m. to 11:59 a.m.
- 812:00 p.m. to 3:59 p.m.
- 284:00 p.m. to 11:59 p.m.

Occupations of males:
- Percentage of males in management occupations (except farmers):
Here: 15.7% city: 13.0%
- Percentage of males in business and financial operations occupations:
Here: 4.4% city: 7.1%
- Percentage of males in computer and mathematical occupations:
Here: 11.8% city: 8.4%
- Percentage of males in healthcare practitioners and technical occupations:
Here: 3.8% city: 3.0%
- Percentage of males in service occupations:
Here: 6.4% city: 11.0%
- Percentage of males in sales and office occupations:
Here: 47.9% city: 17.8%
- Percentage of males in production occupations:
Here: 2.5% city: 4.4%
- Percentage of males in transportation occupations:
Here: 5.0% city: 3.6%
Occupations of females:
- Percentage of females in management occupations (except farmers):
Here: 3.6% city: 11.0%
- Percentage of females in business and financial operations occupations:
Here: 4.3% city: 9.3%
- Percentage of females in computer and mathematical occupations:
Here: 14.3% city: 3.8%
- Percentage of females in legal occupations:
Here: 2.5% city: 1.3%
- Percentage of females in education, training, and library occupations:
Here: 3.6% city: 8.7%
- Percentage of females in arts, design, entertainment, sports, and media occupations:
Here: 4.6% city: 2.1%
- Percentage of females in healthcare practitioners and technical occupations:
Here: 9.2% city: 9.8%
- Percentage of females in service occupations:
Here: 26.4% city: 15.2%
- Percentage of females in sales and office occupations:
Here: 31.4% city: 28.7%
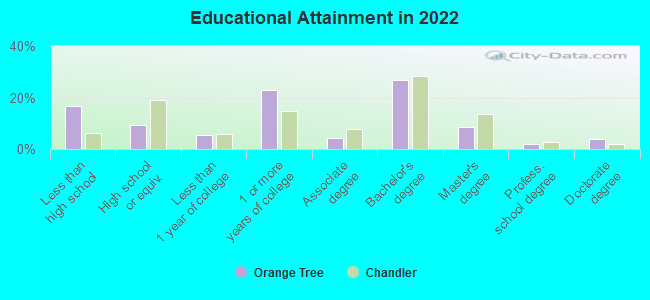
Education in this neighborhood (subdivision or community):
- Percentage of people 3 years and older in K-12 schools:
Orange Tree: 21.5% Chandler: 19.1%
- Percentage of people 3 years and older in undergraduate colleges:
Orange Tree: 4.6% Chandler: 4.5%
- Percentage of people 3 years and older in grad. or professional schools:
Orange Tree: 1.9% Chandler: 1.8%
- Percentage of students K-12 enrolled in private schools:
Orange Tree: 66.7% Chandler: 14.2%
Percentage of population below poverty level:
| Orange Tree: | 8.8% |
| Chandler: | 7.6% |
Median year owner moved in (as recorded in 2022):
Median year renter moved in (as recorded in 2022):
| Orange Tree: | 2005 |
| Chandler: | 2013 |
Median year renter moved in (as recorded in 2022):
| Orange Tree: | 2016 |
| Chandler: | 2020 |
Percentage of married-couple families with both working:
| Orange Tree: | 18.8% |
| Chandler: | 68.1% |
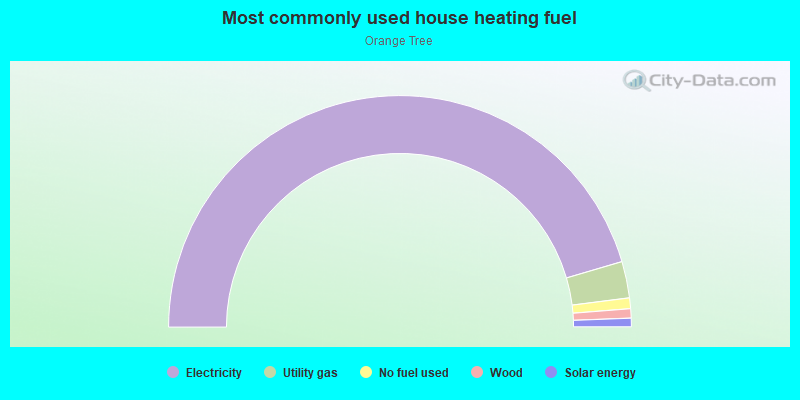
- 90.9%Electricity
- 5.1%Utility gas
- 1.5%No fuel used
- 1.3%Wood
- 1.2%Solar energy
Roads and streets:
W Warner Rd
Length: 0.57 miles
Direction: E-W
Address range: 2084 to 2706
Direction: E-W
Address range: 2084 to 2706
N Bullmoose Dr
Length: 0.51 miles
Directions: N-S, SE-NW
Address range: 2000 to 2499
Directions: N-S, SE-NW
Address range: 2000 to 2499
W Colt Rd
Length: 0.39 miles
Directions: E-W, N-S
Address range: 2200 to 2499
Directions: E-W, N-S
Address range: 2200 to 2499
W el Prado Rd
Length: 0.33 miles
Directions: E-W, SE-NW
Address range: 2000 to 2299
Directions: E-W, SE-NW
Address range: 2000 to 2299
W Los Arboles Pl
Length: 0.31 miles
Direction: E-W
Address range: 2200 to 2399
Direction: E-W
Address range: 2200 to 2399
W el Alba Way
Length: 0.30 miles
Direction: E-W
Address range: 2400 to 2698
Direction: E-W
Address range: 2400 to 2698
N Tamarisk St
Length: 0.24 miles
Directions: N-S, SE-NW
Address range: 2000 to 2199
Directions: N-S, SE-NW
Address range: 2000 to 2199
N Los Altos Dr
Length: 0.23 miles
Directions: E-W, SW-NE
Address range: 2100 to 2207
Directions: E-W, SW-NE
Address range: 2100 to 2207
W Mesquite St
Length: 0.23 miles
Direction: E-W
Address range: 2400 to 2642
Direction: E-W
Address range: 2400 to 2642
N 91st Pl
Length: 0.19 miles
Direction: N-S
Address range: 2000 to 2199
Direction: N-S
Address range: 2000 to 2199
N Salida del Sol
Length: 0.16 miles
Direction: N-S
Address range: 2000 to 2199
Direction: N-S
Address range: 2000 to 2199
W Mariposa St
Length: 0.16 miles
Direction: E-W
Address range: 2200 to 2299
Direction: E-W
Address range: 2200 to 2299
W Palomino Dr
Length: 0.10 miles
Direction: E-W
Address range: 2400 to 2453
Direction: E-W
Address range: 2400 to 2453
N el Dorado Ct
Length: 0.06 miles
Directions: N-S, SE-NW
Address range: 2000 to 2099
Directions: N-S, SE-NW
Address range: 2000 to 2099
N Dobson Rd
Length: 0.06 miles
Direction: N-S
Address range: 2152 to 2199
Direction: N-S
Address range: 2152 to 2199
Los Arboles Pl (W Los Arboles Pl)
Length: 0.04 miles
Direction: E-W
Direction: E-W
N Santa Anna Ct
Length: 0.03 miles
Direction: SE-NW
Address range: 2200 to 2299
Direction: SE-NW
Address range: 2200 to 2299