Estimated zip code population in 2022: 39,643 Zip code population in 2010: 37,564 Zip code population in 2000: 37,909
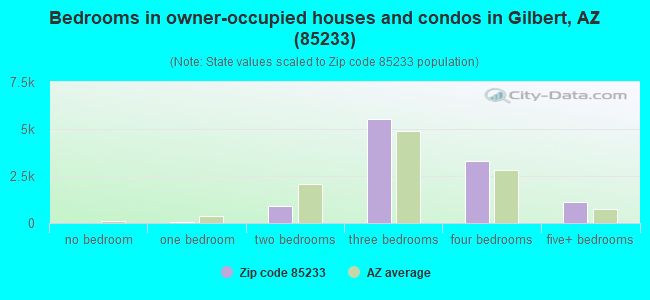
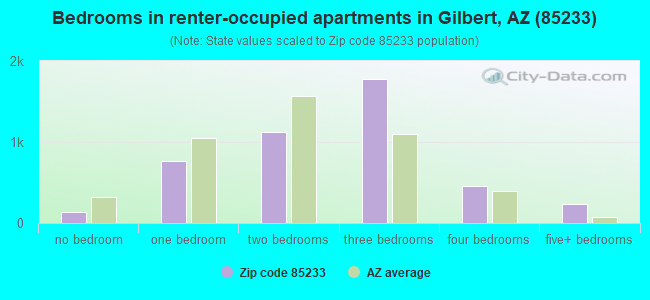
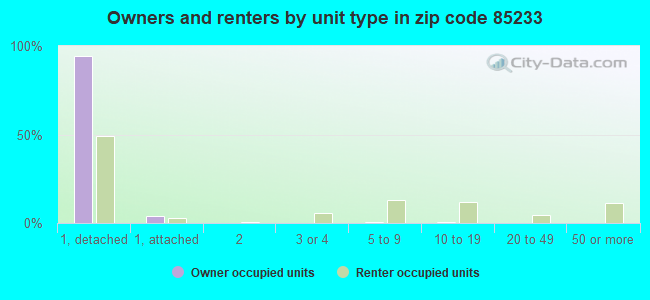
Houses and condos: 15,626 Renter-occupied apartments: 4,486
% of renters here:
29%
State:
33%
March 2022 cost of living index in zip code 85233: 101.2 (near average, U.S. average is 100)
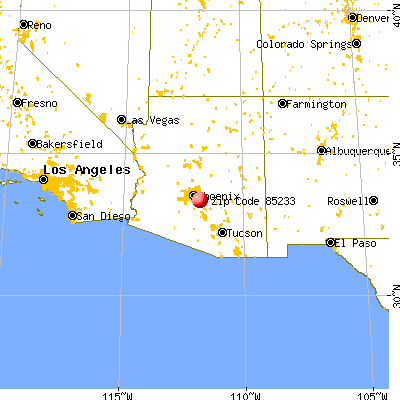
Land area: 9.7 sq. mi. Water area: 0.1 sq. mi.
Population density: 4,073 people per square mile
(average).
OSM Map
General Map
Google Map
MSN Map
OSM Map
General Map
Google Map
MSN Map
OSM Map
General Map
Google Map
MSN Map
OSM Map
General Map
Google Map
MSN Map
Please wait while loading the map...
Real estate property taxes paid for housing units in 2022:
This zip code:
0.4% ($1,918)
Arizona:
0.4% ($1,786)
Median real estate property taxes paid for housing units with mortgages in 2022: $1,979 (0.4%) Median real estate property taxes paid for housing units with no mortgage in 2022: $1,794 (0.4%)
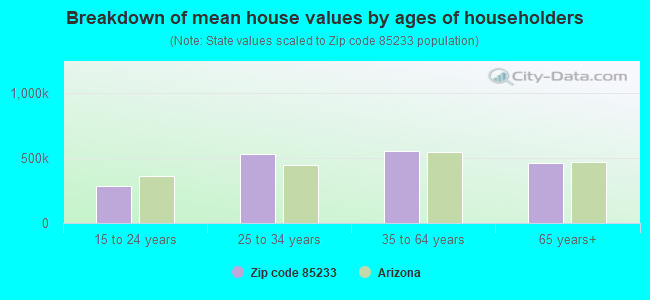
Estimated median house/condo value in 2022: $522,362
85233:
$522,362
Arizona:
$402,800
According to our research of Arizona and other state lists, there were 16 registered sex offenders living in 85233 zip code as of April 27, 2024. The ratio of all residents to sex offenders in zip code 85233 is 2,271 to 1. The ratio of registered sex offenders to all residents in this zip code is much lower than the state average.
Median resident age:
This zip code:
38.1 years
Arizona median age:
38.8 years
Average household size:
This zip code:
2.6 people
Arizona:
2.5 people
Averages for the 2020 tax year for zip code 85233, filed in 2021:
Average Adjusted Gross Income (AGI) in 2020: $80,613 (Individual Income Tax Returns)
Here:
$80,613
State:
$73,499
Salary/wage: $70,438 (reported on 86.0% of returns)
Here:
$70,438
State:
$59,499
(% of AGI for various income ranges: 1188.4% for AGIs below $25k, 3929.9% for AGIs $25k-50k, 7147.4% for AGIs $50k-75k, 11011.0% for AGIs $75k-100k, 21306.6% for AGIs $100k-200k, 64871.0% for AGIs over 200k)
Taxable interest for individuals: $1,347 (reported on 27.1% of returns)
This zip code:
$1,347
Arizona:
$2,325
(% of AGI for various income ranges: 16.2% for AGIs below $25k, 13.6% for AGIs $25k-50k, 31.3% for AGIs $50k-75k, 46.8% for AGIs $75k-100k, 83.2% for AGIs $100k-200k, 750.0% for AGIs over 200k)
Ordinary dividends: $4,142 (reported on 20.7% of returns)
Here:
$4,142
State:
$8,711
(% of AGI for various income ranges: 19.8% for AGIs below $25k, 25.3% for AGIs $25k-50k, 75.9% for AGIs $50k-75k, 90.7% for AGIs $75k-100k, 199.9% for AGIs $100k-200k, 1996.2% for AGIs over 200k)
Net capital gain/loss in AGI: +$12,989 (reported on 20.9% of returns)
Here:
+$12,989
State:
+$31,332
(% of AGI for various income ranges: 12.9% for AGIs below $25k, 29.5% for AGIs $25k-50k, 77.2% for AGIs $50k-75k, 149.8% for AGIs $75k-100k, 609.8% for AGIs $100k-200k, 8645.2% for AGIs over 200k)
Profit/loss from business: +$12,090 (reported on 17.2% of returns)
Here:
+$12,090
State:
+$13,214
(% of AGI for various income ranges: 145.4% for AGIs below $25k, 141.6% for AGIs $25k-50k, 243.3% for AGIs $50k-75k, 335.5% for AGIs $75k-100k, 568.1% for AGIs $100k-200k, 2234.8% for AGIs over 200k)
Taxable individual retirement arrangement distribution: $23,758 (reported on 7.6% of returns)
85233:
$23,758
Arizona:
$23,364
(% of AGI for various income ranges: 50.8% for AGIs below $25k, 78.4% for AGIs $25k-50k, 184.0% for AGIs $50k-75k, 298.7% for AGIs $75k-100k, 573.8% for AGIs $100k-200k, 2684.8% for AGIs over 200k)
Self-employed (Keogh) retirement plans: $17,471 (reported on 0.4% of returns)
85233:
$17,471
Arizona:
$26,938
(% of AGI for various income ranges: 25.6% for AGIs $100k-200k, 178.0% for AGIs over 200k)
Total itemized deductions: $29,836 (reported on 10.7% of returns)
Here:
$29,836
State:
$36,308
(% of AGI for various income ranges: 54.9% for AGIs below $25k, 123.8% for AGIs $25k-50k, 330.0% for AGIs $50k-75k, 505.9% for AGIs $75k-100k, 1022.1% for AGIs $100k-200k, 5099.5% for AGIs over 200k)
Charity contributions: $9,552 (reported on 8.7% of returns)
Here:
$9,552
State:
$11,955
(% of AGI for various income ranges: 3.1% for AGIs below $25k, 15.9% for AGIs $25k-50k, 40.6% for AGIs $50k-75k, 93.2% for AGIs $75k-100k, 258.3% for AGIs $100k-200k, 1964.8% for AGIs over 200k)
Taxes paid: $6,398 (reported on 10.7% of returns)
85233:
$6,398
State:
$6,820
(% of AGI for various income ranges: 6.0% for AGIs below $25k, 17.2% for AGIs $25k-50k, 57.3% for AGIs $50k-75k, 113.7% for AGIs $75k-100k, 260.4% for AGIs $100k-200k, 1069.0% for AGIs over 200k)
Earned income credit: $2,031 (reported on 10.4% of returns)
Here:
$2,031
State:
$2,383
(% of AGI for various income ranges: 65.9% for AGIs below $25k, 51.6% for AGIs $25k-50k, 1.1% for AGIs $50k-75k)
Percentage of individuals using paid preparers for their 2020 taxes: 93.8%
Here:
94%
State:
93%
(% for various income ranges: 92.1% for AGIs below $25k, 93.9% for AGIs $25k-50k, 94.7% for AGIs $50k-75k, 94.2% for AGIs $75k-100k, 94.3% for AGIs $100k-200k, 95.0% for AGIs over 200k)
Averages for the 2012 tax year for zip code 85233, filed in 2013:
Average Adjusted Gross Income (AGI) in 2012: $65,085 (Individual Income Tax Returns)
Here:
$65,085
State:
$57,644
Salary/wage: $58,926 (reported on 89.1% of returns)
Here:
$58,926
State:
$47,932
(% of AGI for various income ranges: 82.6% for AGIs below $25k, 86.4% for AGIs $25k-50k, 83.3% for AGIs $50k-75k, 84.6% for AGIs $75k-100k, 84.6% for AGIs $100k-200k, 61.5% for AGIs over 200k)
Taxable interest for individuals: $936 (reported on 31.7% of returns)
This zip code:
$936
Arizona:
$2,064
(% of AGI for various income ranges: 0.5% for AGIs below $25k, 0.3% for AGIs $25k-50k, 0.4% for AGIs $50k-75k, 0.4% for AGIs $75k-100k, 0.3% for AGIs $100k-200k, 0.9% for AGIs over 200k)
Ordinary dividends: $3,934 (reported on 19.6% of returns)
Here:
$3,934
State:
$7,268
(% of AGI for various income ranges: 1.1% for AGIs below $25k, 0.5% for AGIs $25k-50k, 0.6% for AGIs $50k-75k, 0.6% for AGIs $75k-100k, 0.7% for AGIs $100k-200k, 3.8% for AGIs over 200k)
Net capital gain/loss in AGI: +$6,109 (reported on 17.3% of returns)
Here:
+$6,109
State:
+$15,530
(% of AGI for various income ranges: 0.6% for AGIs $50k-75k, 0.5% for AGIs $75k-100k, 0.8% for AGIs $100k-200k, 7.1% for AGIs over 200k)
Profit/loss from business: +$11,481 (reported on 16.2% of returns)
Here:
+$11,481
State:
+$12,323
(% of AGI for various income ranges: 7.0% for AGIs below $25k, 3.9% for AGIs $25k-50k, 3.1% for AGIs $50k-75k, 2.0% for AGIs $75k-100k, 2.1% for AGIs $100k-200k, 2.9% for AGIs over 200k)
Taxable individual retirement arrangement distribution: $17,331 (reported on 7.8% of returns)
85233:
$17,331
Arizona:
$18,280
(% of AGI for various income ranges: 2.3% for AGIs below $25k, 1.7% for AGIs $25k-50k, 1.8% for AGIs $50k-75k, 2.2% for AGIs $75k-100k, 2.2% for AGIs $100k-200k, 2.1% for AGIs over 200k)
Self-employment retirement plans: $16,200 (reported on 0.4% of returns)
85233:
$16,200
Arizona:
$22,154
Total itemized deductions: $20,680 (20% of AGI, reported on 41.3% of returns)
Here:
$20,680
State:
$23,651
Here:
19.5% of AGI
State:
20.6% of AGI
(% of AGI for various income ranges: 10.6% for AGIs below $25k, 10.7% for AGIs $25k-50k, 13.8% for AGIs $50k-75k, 14.5% for AGIs $75k-100k, 14.2% for AGIs $100k-200k, 11.6% for AGIs over 200k)
Charity contributions: $3,652 (reported on 35.9% of returns)
Here:
$3,652
State:
$4,114
(% of AGI for various income ranges: 0.9% for AGIs below $25k, 1.2% for AGIs $25k-50k, 1.7% for AGIs $50k-75k, 2.1% for AGIs $75k-100k, 2.3% for AGIs $100k-200k, 2.6% for AGIs over 200k)
Taxes paid: $5,631 (reported on 41.3% of returns)
85233:
$5,631
State:
$6,509
(% of AGI for various income ranges: 1.5% for AGIs below $25k, 2.0% for AGIs $25k-50k, 2.9% for AGIs $50k-75k, 3.5% for AGIs $75k-100k, 4.2% for AGIs $100k-200k, 4.8% for AGIs over 200k)
Earned income credit: $2,106 (reported on 13.1% of returns)
Here:
$2,106
State:
$2,432
(% of AGI for various income ranges: 5.2% for AGIs below $25k, 1.0% for AGIs $25k-50k)
Percentage of individuals using paid preparers for their 2012 taxes: 47.0%
Here:
47%
State:
52%
(% for various income ranges: 41.1% for AGIs below $25k, 45.0% for AGIs $25k-50k, 48.5% for AGIs $50k-75k, 51.0% for AGIs $75k-100k, 52.8% for AGIs $100k-200k, 64.8% for AGIs over 200k)
Averages for the 2004 tax year for zip code 85233, filed in 2005:
Average Adjusted Gross Income (AGI) in 2004: $58,813 (Individual Income Tax Returns)
Here:
$58,813
State:
$50,097
Salary/wage: $54,470 (reported on 91.2% of returns)
Here:
$54,470
State:
$42,146
(% of AGI for various income ranges: 192.6% for AGIs below $10k, 86.1% for AGIs $10k-25k, 88.3% for AGIs $25k-50k, 88.0% for AGIs $50k-75k, 89.5% for AGIs $75k-100k, 77.9% for AGIs over 100k)
Taxable interest for individuals: $1,032 (reported on 44.9% of returns)
This zip code:
$1,032
Arizona:
$2,374
(% of AGI for various income ranges: 5.1% for AGIs below $10k, 1.1% for AGIs $10k-25k, 0.6% for AGIs $25k-50k, 0.7% for AGIs $50k-75k, 0.5% for AGIs $75k-100k, 0.9% for AGIs over 100k)
Taxable dividends: $1,257 (reported on 25.0% of returns)
Here:
$1,257
State:
$3,888
(% of AGI for various income ranges: 3.8% for AGIs below $10k, 0.8% for AGIs $10k-25k, 0.6% for AGIs $25k-50k, 0.4% for AGIs $50k-75k, 0.4% for AGIs $75k-100k, 0.5% for AGIs over 100k)
Net capital gain/loss: +$5,934 (reported on 22.6% of returns)
Here:
+$5,934
State:
+$17,569
(% of AGI for various income ranges: -4.0% for AGIs below $10k, 0.0% for AGIs $10k-25k, 0.5% for AGIs $25k-50k, 0.6% for AGIs $50k-75k, 0.7% for AGIs $75k-100k, 4.6% for AGIs over 100k)
Profit/loss from business: +$10,329 (reported on 16.1% of returns)
Here:
+$10,329
State:
+$11,088
(% of AGI for various income ranges: 1.6% for AGIs below $10k, 5.6% for AGIs $10k-25k, 2.6% for AGIs $25k-50k, 2.7% for AGIs $50k-75k, 2.4% for AGIs $75k-100k, 2.8% for AGIs over 100k)
Profit/loss from farming: +$3,765 (reported on 0.1% of returns)
Here:
+$3,765
State:
-$7,013
IRA payment deduction: $2,913 (reported on 2.8% of returns)
85233:
$2,913
Arizona:
$3,023
(% of AGI for various income ranges: 0.2% for AGIs $10k-25k, 0.2% for AGIs $25k-50k, 0.2% for AGIs $50k-75k, 0.1% for AGIs $75k-100k, 0.1% for AGIs over 100k)
Self-employed pension: $12,303 (reported on 0.7% of returns)
Here:
$12,303
Arizona:
$15,785
(% of AGI for various income ranges: 0.0% for AGIs $25k-50k, 0.1% for AGIs $50k-75k, 0.1% for AGIs $75k-100k, 0.2% for AGIs over 100k)
Total itemized deductions: $18,791 (21% of AGI, reported on 53.8% of returns)
Here:
$18,791
State:
$19,781
Here:
21.4% of AGI
State:
21.8% of AGI
(% of AGI for various income ranges: 29.6% for AGIs below $10k, 13.4% for AGIs $10k-25k, 18.0% for AGIs $25k-50k, 20.2% for AGIs $50k-75k, 18.5% for AGIs $75k-100k, 15.4% for AGIs over 100k)
Charity contributions deductions: $3,200 (4% of AGI, reported on 48.6% of returns)
Here:
$3,200
State:
$3,389
Here:
3.5% of AGI
State:
3.5% of AGI
(% of AGI for various income ranges: 1.9% for AGIs below $10k, 1.2% for AGIs $10k-25k, 2.0% for AGIs $25k-50k, 2.7% for AGIs $50k-75k, 2.6% for AGIs $75k-100k, 3.0% for AGIs over 100k)
Total tax: $8,637 (reported on 82.7% of returns)
85233:
$8,637
State:
$8,323
(% of AGI for various income ranges: 6.6% for AGIs below $10k, 4.6% for AGIs $10k-25k, 6.7% for AGIs $25k-50k, 8.6% for AGIs $50k-75k, 10.1% for AGIs $75k-100k, 17.3% for AGIs over 100k)
Earned income credit: $1,566 (reported on 9.3% of returns)
Here:
$1,566
State:
$1,786
Percentage of individuals using paid preparers for their 2004 taxes: 53.0%
Here:
53%
State:
60%
(% for various income ranges: 43.6% for AGIs below $10k, 51.8% for AGIs $10k-25k, 54.5% for AGIs $25k-50k, 55.1% for AGIs $50k-75k, 54.4% for AGIs $75k-100k, 57.3% for AGIs over 100k)
Likely homosexual households (counted as self-reported same-sex unmarried-partner households)
Lesbian couples: 0.2% of all households
Gay men: 0.4% of all households
Household received Food Stamps/SNAP in the past 12 months: 693 Household did not receive Food Stamps/SNAP in the past 12 months: 14,678
Women who had a birth in the past 12 months: 402 (364 now married, 45 unmarried) Women who did not have a birth in the past 12 months: 8,934 (4,149 now married, 4,763 unmarried)
Housing units in zip code 85233 with a mortgage: 8,148 (549 second mortgage, 506 both second mortgage and home equity loan) Houses without a mortgage: 224
Median monthly owner costs for units with a mortgage: $1,696 Median monthly owner costs for units without a mortgage: $450
Residents with income below the poverty level in 2022:
This zip code:
7.8%
Whole state:
12.5%
Residents with income below 50% of the poverty level in 2022:
This zip code:
4.3%
Whole state:
6.0%
Median number of rooms in houses and condos:
Here:
6.2
State:
6.0
Median number of rooms in apartments:
Here:
4.5
State:
4.1
Notable locations in this zip code not listed on our city pages
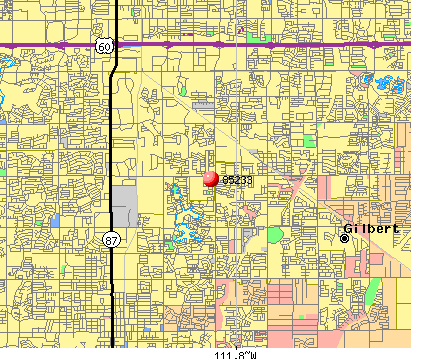
Churches in zip code 85233 include: Gilbert East Valley Bible Church (A), First United Methodist Church of Gilbert (B), Fellowship Connection Church (C), Sovereign Grace Church (D), Lord of Life Christian Church (E), Vineyard Community Church (F), The Church of Jesus Christ of Latter Day Saints (G). Display/hide their locations on the map
6,424 married couples with children.
2,045 single-parent households (827 men, 1,218 women).
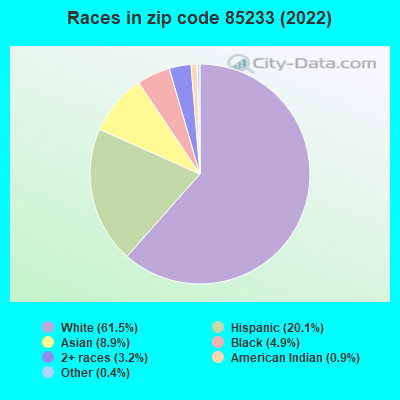
83.5% of residents of 85233 zip code speak English at home.
7.5% of residents speak Spanish at home (75% very well, 14% well, 6% not well, 5% not at all).
2.1% of residents speak other Indo-European language at home (80% very well, 12% well, 8% not well).
5.8% of residents speak Asian or Pacific Island language at home (52% very well, 17% well, 27% not well, 4% not at all).
1.4% of residents speak other language at home (89% very well, 8% well, 3% not well).
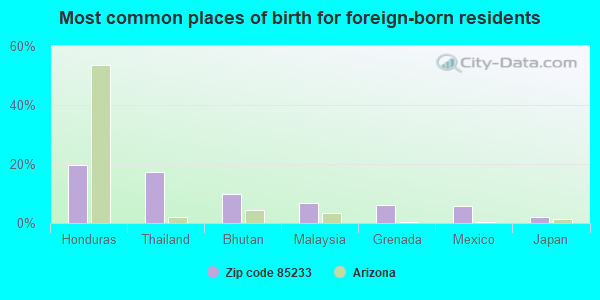
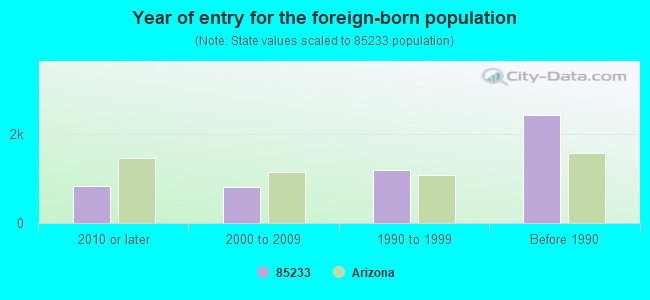
Foreign born population: 5,027 (12.7%) (75.9% of them are naturalized citizens)
Major facilities with environmental interests located in this zip code:
FIBER FAB INCORPORATED (636 WEST COMMERCE AVENUE in GILBERT, AZ)
(Integrated Compliance Information System) - ICIS-09-1998-0090, FORMAL ENFORCEMENT ACTION COMPLIANCE ACTIVITY (Tracking inspections of insecticide, fungicide, and rodenticide, and toxic substances) CRITERIA AND HAZARDOUS AIR POLLUTANT INVENTORY (Inventory of air pollution sources) Conditionally Exempt Small Quantity Generators, less than 100 kg/month of hazardous waste (Resource Conservation and Recovery Act (tracking hazardous waste)) - notification (Resource Conservation and Recovery Act (tracking hazardous waste)) TRI REPORTER (Tracking of toxic chemicals releasing facilities) Business SIC classification: PLASTICS PRODUCTS Business NAICS classification: ALL OTHER PLASTICS PRODUCT MANUFACTURING. Organizations: EARL J AND PATRICIA S BECKER (CONTACT/OWNER)
Alternative names: ASHLAND SPECIALTY CHEMICAL CO
ASHLAND SPECIALTY (1331 WEST HOUSTON AVENUE in GILBERT, AZ)
STATE MASTER (Arizona's Tracking Of The Environment) - AZURITE-6342, PESTICIDES PROGRAM CRITERIA AND HAZARDOUS AIR POLLUTANT INVENTORY (Inventory of air pollution sources) HAZARDOUS WASTE BIENNIAL REPORTER (Resource Conservation and Recovery Act (tracking hazardous waste)) Small Quantity Generators, between 100 kg and 1000 kg of hazardous waste/month (Resource Conservation and Recovery Act (tracking hazardous waste)) Business SIC classification: COATED FABRICS, NOT RUBBERIZED; RADIO AND TELEVISION BROADCASTING AND COMMUNICATIONS EQUIPMENT Business NAICS classification: FABRIC COATING MILLS.; RADIO AND TELEVISION BROADCASTING AND WIRELESS COMMUNICATIONS EQUIPMENT MANUFACTURING. Organizations: AIR PRODUCTS AND CHEMICALS INC (CONTACT/OPERATOR)
, ASHLAND SPECIALTY CHEMICAL CO (CONTACT/OPERATOR)
, HEXCEL CORPORATION (CONTACT/OWNER)
, SYMPOSIUM PARTNERS LLC (CONTACT/OWNER)
, BUTLER REAL ESTATE INC (CONTACT/OWNER)
Alternative names: AIR PRODUCTS AND CHEMICALS INC, HEXCEL ADVANCED PRODUCTS, HEXCEL SATELLITE PRODUCTS, HEXCEL SATELLITE PRODUCTS - FORMER
ENTRADA DEL ORO (T1S R10E S30 in FLORENCE JUNCTION, AZ)
STATE MASTER (Arizona's Tracking Of The Environment) - AZURITE-14001, DRINKING WATER PROGRAM, WASTE National Pollutant Discharge Elimination System NON-MAJOR (Tracking pollutant discharge elimination systems) - permit Business SIC classification: SEWERAGE SYSTEMS Organizations: GROSVENOR HOLDINGS (CONTACT/GENERAL)
Alternative names: ENTRADA DEL ORO HOMEOWNERS
COSTCO WHOLESALE (1415 ARIZONA AVE in GILBERT, AZ)
STATE MASTER (Arizona's Tracking Of The Environment) - AZURITE-6681, PESTICIDES PROGRAM Conditionally Exempt Small Quantity Generators, less than 100 kg/month of hazardous waste (Resource Conservation and Recovery Act (tracking hazardous waste)) - notification Organizations: COSTCO WHOLESALE CORPORATION (CONTACT/OWNER)
Alternative names: COSTCO WHOLESALE 481
GPMI CO (1051 N. FIESTA BLVD. in GILBERT, AZ)
COMPLIANCE ACTIVITY (Tracking inspections of insecticide, fungicide, and rodenticide, and toxic substances) STATE MASTER (New Jersey environmental info) - NJEMS-003836, PESTICIDES - PESTICIDE PRODUCER, PESTICIDES - MANUFACTURE
EDU-PRIZE (580 W. MELODY DR. in GILBERT, AZ)
(National Center for Education Statistics) - STATE ID-101 Organizations: EDU-PRIZE, INC. (SCHOOL DISTRICT)
GILBERT ELEMENTARY SCHOOL (175 W ELLIOT RD in GILBERT, AZ)
(National Center for Education Statistics) - STATE ID-140 Organizations: GILBERT UNIFIED DISTRICT (SCHOOL DISTRICT)
ANOTECH CORP (734 N GOLDEN KEY STE D-1 in GILBERT, AZ)
ENFORCEMENT/COMPLIANCE ACTIVITY (Integrated Compliance Information System) (Resource Conservation and Recovery Act (tracking hazardous waste)) Business NAICS classification: ELECTROPLATING, PLATING, POLISHING, ANODIZING, AND COLORING. Organizations: DALE AND CLOYD CARPENTER (CONTACT/OWNER)
GENERAL DYNAMICS SPECTRUM ASTRO SPACE SY (1433 N TECH BLVD in GILBERT, AZ)
(Resource Conservation and Recovery Act (tracking hazardous waste)) Organizations: GENERAL DYNAMICS C4 SYSTEMS (CONTACT/OWNER)
DIAGNOSTIC IMAGING INC (761 N MONTEREY STE 101 in GILBERT, AZ)
(Resource Conservation and Recovery Act (tracking hazardous waste))
EARNHARDTS DODGE BODY SHOP (1301 N COLORADO ST in GILBERT, AZ)
CRITERIA AND HAZARDOUS AIR POLLUTANT INVENTORY (Inventory of air pollution sources) Small Quantity Generators, between 100 kg and 1000 kg of hazardous waste/month (Resource Conservation and Recovery Act (tracking hazardous waste)) - notification Business SIC classification: TOP, BODY, AND UPHOLSTERY REPAIR SHOPS AND PAINT SHOPS Business NAICS classification: AUTOMOTIVE BODY, PAINT, AND INTERIOR REPAIR AND MAINTENANCE.; AUTOMOTIVE BODY, PAINT, AND INTERIOR REPAIR AND MAINTENANCE. Organizations: HAL J EARNHARDT III (CONTACT/OWNER)
ECONO LUBE N TUNE 291 (815 COOPER RD in GILBERT, AZ)
(Resource Conservation and Recovery Act (tracking hazardous waste))
ARIZONA DEPART OF ENVIRONMENTAL QUALITY (619 W COMMERCE AVE WELLS GW in GILBERT, AZ)
Housing units lacking complete plumbing facilities: 0.2% Housing units lacking complete kitchen facilities: 0.1%
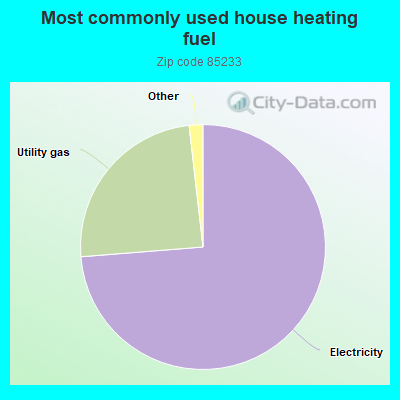
73.8%Electricity
24.5%Utility gas
0.6%Solar energy
0.5%Bottled, tank, or LP gas
Place of birth for U.S.-born residents:
This state: 16,123
Northeast: 2,546
Midwest: 5,960
South: 1,781
West: 7,785
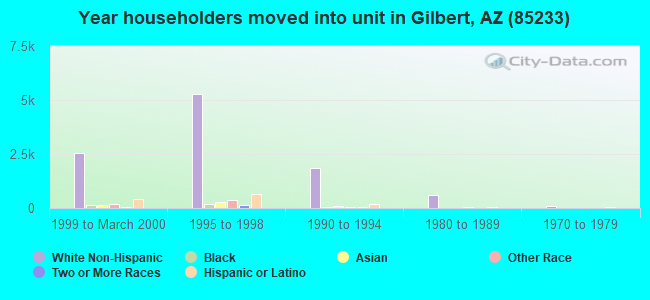
31% of the 85233 zip code residents lived in the same house 5 years ago. Out of people who lived in different houses, 61% lived in this county. Out of people who lived in different counties, 50% lived in Arizona.
89% of the 85233 zip code residents lived in the same house 1 year ago. Out of people who lived in different houses, 59% moved from this county. Out of people who lived in different houses, 4% moved from different county within same state. Out of people who lived in different houses, 35% moved from different state. Out of people who lived in different houses, 4% moved from abroad.
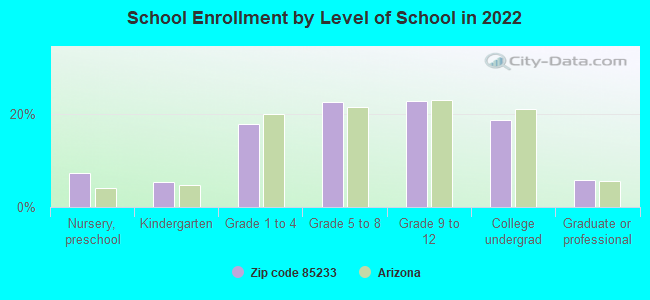
Private vs. public school enrollment:
Students in private schools in grades 1 to 8 (elementary and middle school): 387
Here:
10.0%
Arizona:
10.4%
Students in private schools in grades 9 to 12 (high school): 164
Here:
7.6%
Arizona:
8.8%
Students in private undergraduate colleges: 250
Here:
14.1%
Arizona:
13.1%
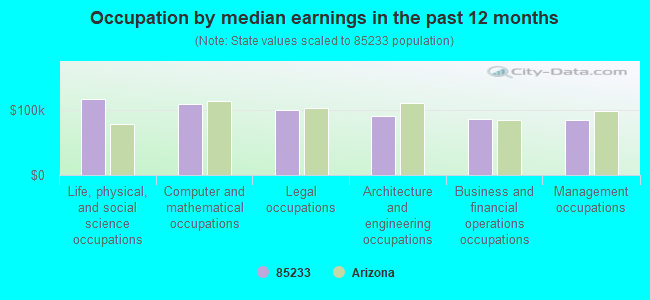
Occupation by median earnings in the past 12 months ($)
117,614Life, physical, and social science occupations
110,601Computer and mathematical occupations
101,127Legal occupations
91,369Architecture and engineering occupations
87,145Business and financial operations occupations
85,356Management occupations
Companies with biggest federal contracts located in this zip code (GILBERT, AZ):
SPECTRUM ASTRO INCORPORATED (1440 NORTH FIESTA BLVD; small business) 500 employees, $134000000 revenue: $2,468,217 in 10 contractsfrom 2003 to 2005
Contracts for Feasibility Studies (non-construction), Aeronautics and Space Technology -- Basic Research (R&D), Space Vehicle Handling and Servicing Equipment, Other Professional Services, and moreby National Oceanic and Atmospheric Administration/Under Secretary for Oceans and Atmosphere, NASA, Army Signed by year:2000: $0; 2001: $0; 2002: $0; 2003: $1,069,945; 2004: $1,198,000; 2005: $200,272; 2006: $0.
Biggest contracts:
$1,000,000 with National Oceanic and Atmospheric Administration/Under Secretary for Oceans and Atmosphere for Feasibility Studies (non-construction). Taking place in DC. Signed on 2003-10-27. Completion date: 2004-10-26.
$334,000 with NASA for Aeronautics and Space Technology -- Basic Research (R&D). Signed on 2004-01-07. Completion date: 2006-01-06.
$330,000 with NASA for Space Vehicle Handling and Servicing Equipment. Signed on 2004-08-17. Completion date: 2004-11-17.
$259,000 with NASA for Aeronautics and Space Technology -- Basic Research (R&D). Signed on 2004-12-29. Completion date: 2006-01-31.
EXTEX, LTD (1383 N TECH BLVD STE 103; small business) 50 employees, $0 revenue. : $2,214,150 in 36 contractsfrom 2000 to 2006
Contracts for Gas Turbines and Jet Engines, Aircraft; Prime Moving, and Components, Bearings, Antifriction, Unmounted, Miscellaneous Power Transmission Equipment, Pipe, Tube and Rigid Tubing by Army, Defense Logistics Agency Signed by year:2000: $1,098,997; 2001: $113,622; 2002: $371,564; 2003: $306,334; 2004: $174,651; 2005: $47,456; 2006: $101,526.
Biggest contracts:
$582,000 with Army for Gas Turbines and Jet Engines, Aircraft; Prime Moving, and Components. Signed on 2000-05-04. Completion date: 2000-10-19.
$236,500, same as above.Signed on 2000-05-01. Completion date: 2000-09-28.
$173,850, same as above.Signed on 2002-11-20. Completion date: 2005-07-31.
$82,650, same as above.Signed on 2003-12-16. Completion date: 2004-03-10.
WESTERN AIR INTERNATIONAL (1239 W SAN PEDRO ST; small business) 50 employees, $0 revenue. Woman Owned Business: $746,904 in 29 contractsfrom 1999 to 2006
Contracts for Microcircuits, Electronic, Aircraft Air Conditioning, Heating, and Pressurizing Equipment, Miscellaneous Engine Accessories, Aircraft, Antennas, Waveguides, and Related Equipment, and moreby Defense Logistics Agency, Navy, U.S. Coast Guard, Air Force, and others Signed by year:2000: $46,115; 2001: $244,245; 2002: $74,291; 2003: $27,551; 2004: $122,257; 2005: $169,846; 2006: $25,171.
Biggest contracts:
$98,081 with Defense Logistics Agency for Microcircuits, Electronic. Signed on 2001-05-31. Completion date: 2002-05-31.
$82,752 with Navy for Aircraft Air Conditioning, Heating, and Pressurizing Equipment. Taking place in TX. Signed on 2004-11-02. Completion date: 2005-03-23.
$75,600 with Navy for Miscellaneous Engine Accessories, Aircraft. Signed on 2001-05-21. Completion date: 2001-06-04.
$63,250 with U.S. Coast Guard for Antennas, Waveguides, and Related Equipment. Signed on 2005-09-12. Completion date: 2005-11-11.
TIMKEN ALCOR AEROSPACE TECHNOL (1015 N MCQUEEN RD STE 167) : $580,449 in 42 contractsfrom 2002 to 2005
Contracts for Gas Turbines and Jet Engines, Aircraft; Prime Moving, and Components, Bearings, Antifriction, Unmounted, Miscellaneous Power Transmission Equipment, Pipe, Tube and Rigid Tubing, and moreby Army Signed by year:2000: $0; 2001: $0; 2002: $82,131; 2003: $312,755; 2004: $60,714; 2005: $124,849; 2006: $0.
Biggest contracts:
$45,893 with Army for Gas Turbines and Jet Engines, Aircraft; Prime Moving, and Components. Signed on 2005-07-21. Completion date: 2005-08-31.
$41,883 with Army for Bearings, Antifriction, Unmounted. Signed on 2005-10-26. Completion date: 2005-12-30.
$40,200 with Army for Gas Turbines and Jet Engines, Aircraft; Prime Moving, and Components. Signed on 2003-12-15. Completion date: 2004-03-01.
$36,051, same as above.Signed on 2003-06-17. Completion date: 2004-01-30.
CDC POOL SPECIALTIES LLC (1475 N MCQUEEN; small business)
$94,950 with Air Force for Maintenance, Repair or Alteration of Real Property -- Recreational Buildings. Signed on 2005-04-12. Completion date: 2005-06-11.
SILICON PHOTONICS GROUP (1489 S DOVE ST; small business)
$68,935 with Army for Defense Electronics and Communication Equipment -- Basic Research (R&D). Signed on 2005-11-21. Completion date: 2006-05-30.
A-PROFESSIONAL LOCKS, INC (115 S WILLIAM DILLARD DRIV; small business)
$38,208 with U.S. Special Operations Command for Miscellaneous Alarm, Signal and Security Detection Systems. Signed on 2005-12-14. Completion date: 2006-02-28.
A COMPANY, INC (1475 N MCQUEEN RD; small business) : $22,940 in 5 contractsfrom 2003 to 2006
Contracts for Waste Disposal Equipment, Lease or Rental of Equipment -- Miscellaneous by Bureau of Reclamation, Air Force Signed by year:2000: $0; 2001: $0; 2002: $0; 2003: $8,000; 2004: $0; 2005: $4,800; 2006: $10,140.
Biggest contracts:
$8,000 with Bureau of Reclamation for Waste Disposal Equipment. Signed on 2003-10-02. Completion date: 2003-11-25.
$4,800 with Air Force for Lease or Rental of Equipment -- Miscellaneous. Signed on 2005-10-01. Completion date: 2006-09-30.
$3,640, same as above.Signed on 2006-06-05. Completion date: 2006-09-30.
$3,500, same as above.Signed on 2006-04-25. Completion date: 2006-09-30.
SOUTHWEST REBAR FABRICATORS & (1285 N MCQUEEN RD; small business)
$14,931 with Air Force for Clay and Concrete Products Industries Machinery. Signed on 2003-09-03. Completion date: 2003-09-12.
ORANGE-SOL INDUSTRIAL PRODUCTS (1400 N FIESTA BLVD, BLDG 1; small business) : $14,672 in 6 contractsfrom 2004 to 2005
Contracts for Surgical Dressing Materials, Cleaning and Polishing Compounds and Preparations, Miscellaneous Chemical Specialties by Army, Navy Signed by year:2000: $0; 2001: $0; 2002: $0; 2003: $0; 2004: $352; 2005: $14,320; 2006: $0.
Biggest contracts:
$7,090 with Army for Surgical Dressing Materials. Signed on 2005-11-15. Completion date: 2005-11-23.
$4,254, same as above.Signed on 2005-12-02. Completion date: 2005-12-16.
$2,835, same as above.Signed on 2005-07-14. Completion date: 2005-07-29.
$189 with Navy for Cleaning and Polishing Compounds and Preparations. Signed on 2004-11-19. Completion date: 2004-12-08.
Top industries in this zip code by the number of employees in 2005:
2005 - 2018 National Fire Incident Reporting System (NFIRS) incidents
Based on the data from the years 2005 - 2018 the average number of fire incidents per year is 51. The highest number of reported fire incidents - 75 took place in 2009, and the least - 28 in 2013. The data has an increasing trend.
When looking into fire subcategories, the most incidents belonged to: Outside Fires (45.6%), and Structure Fires (31.3%).
Fire incident types reported to NFIRS in Zip Code 85233


+$3,765
-$7,013
 Nearest zip codes: 85225, 85210, 85204, 85202, 85234, 85224.


 Based on the data from the years 2005 - 2018 the average number of fire incidents per year is 51. The highest number of reported fire incidents - 75 took place in 2009, and the least - 28 in 2013. The data has an increasing trend.
 When looking into fire subcategories, the most incidents belonged to: Outside Fires (45.6%), and Structure Fires (31.3%).