Races in Aberdeen, South Dakota (SD) Detailed Stats
Data:
Races - White alone (%)
Races - White alone (% change since 2000)
Races - Black alone (%)
Races - Black alone (% change since 2000)
Races - American Indian alone (%)
Races - American Indian alone (% change since 2000)
Races - Asian alone (%)
Races - Asian alone (% change since 2000)
Races - Hispanic (%)
Races - Hispanic (% change since 2000)
Races - Native Hawaiian and Other Pacific Islander alone (%)
Races - Native Hawaiian and Other Pacific Islander alone (% change since 2000)
Races - Two or more races(%)
Races - Two or more races(% change since 2000)
Races - Other race alone (%)
Races - Other race alone (% change since 2000)
Racial diversity
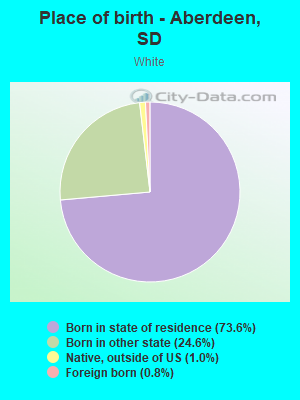
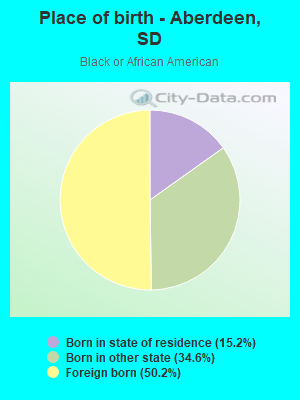
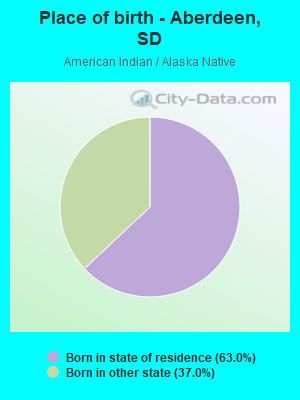
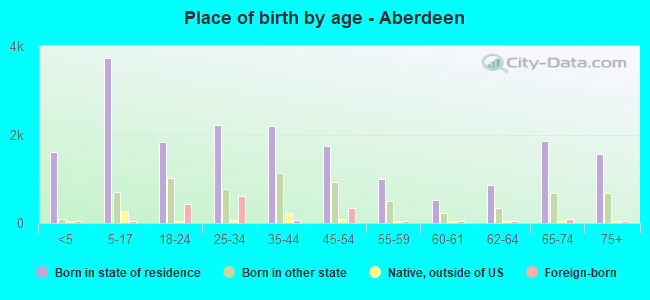
Place of birth - Born in state of residence (%)
Place of birth - Born in state of residence (%) - White
Place of birth - Born in state of residence (%) - Black or African American
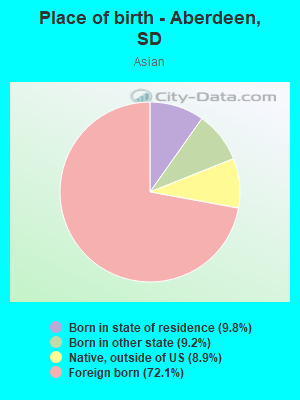
Place of birth - Born in state of residence (%) - Asian
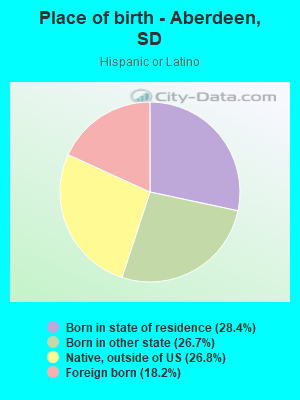
Place of birth - Born in state of residence (%) - Hispanic or Latino
Place of birth - Born in state of residence (%) - American Indian and Alaska Native
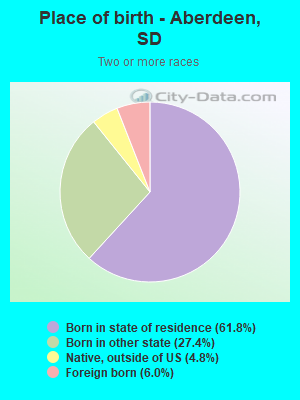
Place of birth - Born in state of residence (%) - Multirace
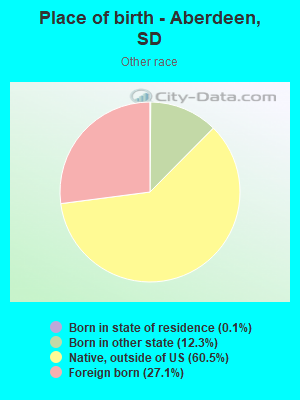
Place of birth - Born in state of residence (%) - Other Race
Place of birth - Born in other state (%)
Place of birth - Born in other state (%) - White
Place of birth - Born in other state (%) - Black or African American
Place of birth - Born in other state (%) - Asian
Place of birth - Born in other state (%) - Hispanic or Latino
Place of birth - Born in other state (%) - American Indian and Alaska Native
Place of birth - Born in other state (%) - Multirace
Place of birth - Born in other state (%) - Other Race
Place of birth - Native, outside of US (%)
Place of birth - Native, outside of US (%) - White
Place of birth - Native, outside of US (%) - Black or African American
Place of birth - Native, outside of US (%) - Asian
Place of birth - Native, outside of US (%) - Hispanic or Latino
Place of birth - Native, outside of US (%) - American Indian and Alaska Native
Place of birth - Native, outside of US (%) - Multirace
Place of birth - Native, outside of US (%) - Other Race
Place of birth - Foreign born (%)
Place of birth - Foreign born (%) - White
Place of birth - Foreign born (%) - Black or African American
Place of birth - Foreign born (%) - Asian
Place of birth - Foreign born (%) - Hispanic or Latino
Place of birth - Foreign born (%) - American Indian and Alaska Native
Place of birth - Foreign born (%) - Multirace
Place of birth - Foreign born (%) - Other Race
Residents speaking English at home (%)
Residents speaking English at home - Born in the United States (%)
Residents speaking English at home - Native, born elsewhere (%)
Residents speaking English at home - Foreign born (%)
Residents speaking Spanish at home (%)
Residents speaking Spanish at home - Born in the United States (%)
Residents speaking Spanish at home - Native, born elsewhere (%)
Residents speaking Spanish at home - Foreign born (%)
Residents speaking other language at home (%)
Residents speaking other language at home - Born in the United States (%)
Residents speaking other language at home - Native, born elsewhere (%)
Residents speaking other language at home - Foreign born (%)
Marital status - Never married (%)
Marital status - Now married (%)
Marital status - Separated (%)
Marital status - Widowed (%)
Marital status - Divorced (%)
Ancestries Reported - Arab (%)
Ancestries Reported - Czech (%)
Ancestries Reported - Danish (%)
Ancestries Reported - Dutch (%)
Ancestries Reported - English (%)
Ancestries Reported - French (%)
Ancestries Reported - French Canadian (%)
Ancestries Reported - German (%)
Ancestries Reported - Greek (%)
Ancestries Reported - Hungarian (%)
Ancestries Reported - Irish (%)
Ancestries Reported - Italian (%)
Ancestries Reported - Lithuanian (%)
Ancestries Reported - Norwegian (%)
Ancestries Reported - Polish (%)
Ancestries Reported - Portuguese (%)
Ancestries Reported - Russian (%)
Ancestries Reported - Scotch-Irish (%)
Ancestries Reported - Scottish (%)
Ancestries Reported - Slovak (%)
Ancestries Reported - Subsaharan African (%)
Ancestries Reported - Swedish (%)
Ancestries Reported - Swiss (%)
Ancestries Reported - Ukrainian (%)
Ancestries Reported - United States (%)
Ancestries Reported - Welsh (%)
Ancestries Reported - West Indian (%)
Ancestries Reported - Other (%)
Geographical mobility - Same house 1 year ago (%)
Geographical mobility - Same house 1 year ago (%) - White
Geographical mobility - Same house 1 year ago (%) - Black or African American
Geographical mobility - Same house 1 year ago (%) - Asian
Geographical mobility - Same house 1 year ago (%) - Hispanic or Latino
Geographical mobility - Same house 1 year ago (%) - American Indian and Alaska Native
Geographical mobility - Same house 1 year ago (%) - Multirace
Geographical mobility - Same house 1 year ago (%) - Other Race
Geographical mobility - Moved within same county (%)
Geographical mobility - Moved within same county (%) - White
Geographical mobility - Moved within same county (%) - Black or African American
Geographical mobility - Moved within same county (%) - Asian
Geographical mobility - Moved within same county (%) - Hispanic or Latino
Geographical mobility - Moved within same county (%) - American Indian and Alaska Native
Geographical mobility - Moved within same county (%) - Multirace
Geographical mobility - Moved within same county (%) - Other Race
Geographical mobility - Moved from different county within same state (%)
Geographical mobility - Moved from different county within same state (%) - White
Geographical mobility - Moved from different county within same state (%) - Black or African American
Geographical mobility - Moved from different county within same state (%) - Asian
Geographical mobility - Moved from different county within same state (%) - Hispanic or Latino
Geographical mobility - Moved from different county within same state (%) - American Indian and Alaska Native
Geographical mobility - Moved from different county within same state (%) - Multirace
Geographical mobility - Moved from different county within same state (%) - Other Race
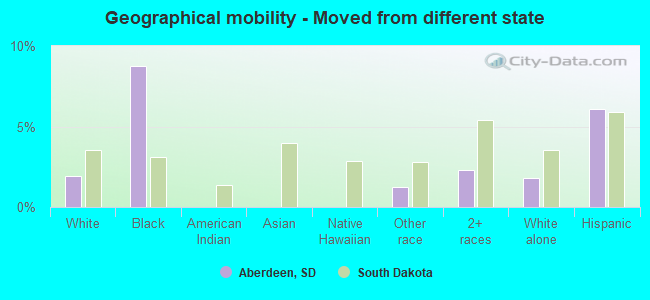
Geographical mobility - Moved from different state (%)
Geographical mobility - Moved from different state (%) - White
Geographical mobility - Moved from different state (%) - Black or African American
Geographical mobility - Moved from different state (%) - Asian
Geographical mobility - Moved from different state (%) - Hispanic or Latino
Geographical mobility - Moved from different state (%) - American Indian and Alaska Native
Geographical mobility - Moved from different state (%) - Multirace
Geographical mobility - Moved from different state (%) - Other Race
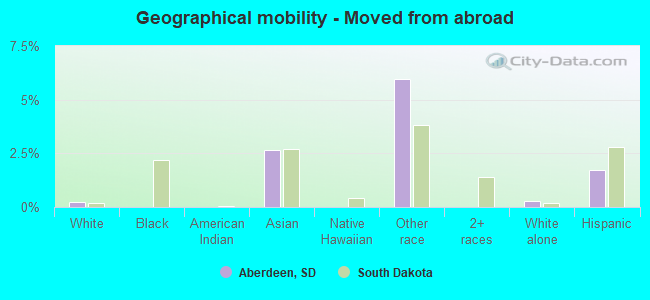
Geographical mobility - Moved from abroad (%)
Geographical mobility - Moved from abroad (%) - White
Geographical mobility - Moved from abroad (%) - Black or African American
Geographical mobility - Moved from abroad (%) - Asian
Geographical mobility - Moved from abroad (%) - Hispanic or Latino
Geographical mobility - Moved from abroad (%) - American Indian and Alaska Native
Geographical mobility - Moved from abroad (%) - Multirace
Geographical mobility - Moved from abroad (%) - Other Race
Place of birth for the foreign-born population - Ireland (%)
Place of birth for the foreign-born population - Denmark (%)
Place of birth for the foreign-born population - Norway (%)
Place of birth for the foreign-born population - Sweden (%)
Place of birth for the foreign-born population - United Kingdom (%)
Place of birth for the foreign-born population - England (%)
Place of birth for the foreign-born population - Scotland (%)
Place of birth for the foreign-born population - Other Northern Europe (%)
Place of birth for the foreign-born population - Austria (%)
Place of birth for the foreign-born population - Belgium (%)
Place of birth for the foreign-born population - France (%)
Place of birth for the foreign-born population - Germany (%)
Place of birth for the foreign-born population - Netherlands (%)
Place of birth for the foreign-born population - Switzerland (%)
Place of birth for the foreign-born population - Other Western Europe (%)
Place of birth for the foreign-born population - Greece (%)
Place of birth for the foreign-born population - Italy (%)
Place of birth for the foreign-born population - Portugal (%)
Place of birth for the foreign-born population - Spain (%)
Place of birth for the foreign-born population - Other Southern Europe (%)
Place of birth for the foreign-born population - Albania (%)
Place of birth for the foreign-born population - Belarus (%)
Place of birth for the foreign-born population - Bosnia and Herzegovina (%)
Place of birth for the foreign-born population - Bulgaria (%)
Place of birth for the foreign-born population - Croatia (%)
Place of birth for the foreign-born population - Czechoslovakia (%)
Place of birth for the foreign-born population - Hungary (%)
Place of birth for the foreign-born population - Latvia (%)
Place of birth for the foreign-born population - Lithuania (%)
Place of birth for the foreign-born population - North Macedonia (Macedonia) (%)
Place of birth for the foreign-born population - Moldova (%)
Place of birth for the foreign-born population - Poland (%)
Place of birth for the foreign-born population - Romania (%)
Place of birth for the foreign-born population - Russia (%)
Place of birth for the foreign-born population - Serbia (%)
Place of birth for the foreign-born population - Ukraine (%)
Place of birth for the foreign-born population - Other Eastern Europe (%)
Place of birth for the foreign-born population - China (%)
Place of birth for the foreign-born population - Hong Kong (%)
Place of birth for the foreign-born population - Taiwan (%)
Place of birth for the foreign-born population - Japan (%)
Place of birth for the foreign-born population - Korea (%)
Place of birth for the foreign-born population - Other Eastern Asia (%)
Place of birth for the foreign-born population - Afghanistan (%)
Place of birth for the foreign-born population - Bangladesh (%)
Place of birth for the foreign-born population - India (%)
Place of birth for the foreign-born population - Iran (%)
Place of birth for the foreign-born population - Kazakhstan (%)
Place of birth for the foreign-born population - Nepal (%)
Place of birth for the foreign-born population - Pakistan (%)
Place of birth for the foreign-born population - Sri Lanka (%)
Place of birth for the foreign-born population - Uzbekistan (%)
Place of birth for the foreign-born population - Other South Central Asia (%)
Place of birth for the foreign-born population - Burma (%)
Place of birth for the foreign-born population - Cambodia (%)
Place of birth for the foreign-born population - Indonesia (%)
Place of birth for the foreign-born population - Laos (%)
Place of birth for the foreign-born population - Malaysia (%)
Place of birth for the foreign-born population - Philippines (%)
Place of birth for the foreign-born population - Singapore (%)
Place of birth for the foreign-born population - Thailand (%)
Place of birth for the foreign-born population - Vietnam (%)
Place of birth for the foreign-born population - Other South Eastern Asia (%)
Place of birth for the foreign-born population - Armenia (%)
Place of birth for the foreign-born population - Iraq (%)
Place of birth for the foreign-born population - Israel (%)
Place of birth for the foreign-born population - Jordan (%)
Place of birth for the foreign-born population - Kuwait (%)
Place of birth for the foreign-born population - Lebanon (%)
Place of birth for the foreign-born population - Saudi Arabia (%)
Place of birth for the foreign-born population - Syria (%)
Place of birth for the foreign-born population - Turkey (%)
Place of birth for the foreign-born population - Yemen (%)
Place of birth for the foreign-born population - Other Western Asia (%)
Place of birth for the foreign-born population - Eritrea (%)
Place of birth for the foreign-born population - Ethiopia (%)
Place of birth for the foreign-born population - Kenya (%)
Place of birth for the foreign-born population - Somalia (%)
Place of birth for the foreign-born population - Uganda (%)
Place of birth for the foreign-born population - Zimbabwe (%)
Place of birth for the foreign-born population - Other Eastern Africa (%)
Place of birth for the foreign-born population - Cameroon (%)
Place of birth for the foreign-born population - Congo (%)
Place of birth for the foreign-born population - Democratic Republic of Congo (Zaire) (%)
Place of birth for the foreign-born population - Other Middle Africa (%)
Place of birth for the foreign-born population - Egypt (%)
Place of birth for the foreign-born population - Morocco (%)
Place of birth for the foreign-born population - Sudan (%)
Place of birth for the foreign-born population - Other Northern Africa (%)
Place of birth for the foreign-born population - South Africa (%)
Place of birth for the foreign-born population - Other Southern Africa (%)
Place of birth for the foreign-born population - Cabo Verde (%)
Place of birth for the foreign-born population - Ghana (%)
Place of birth for the foreign-born population - Liberia (%)
Place of birth for the foreign-born population - Nigeria (%)
Place of birth for the foreign-born population - Senegal (%)
Place of birth for the foreign-born population - Sierra Leone (%)
Place of birth for the foreign-born population - Other Western Africa (%)
Place of birth for the foreign-born population - Australia (%)
Place of birth for the foreign-born population - New Zealand (%)
Place of birth for the foreign-born population - Fiji (%)
Place of birth for the foreign-born population - Micronesia (%)
Place of birth for the foreign-born population - Bahamas (%)
Place of birth for the foreign-born population - Barbados (%)
Place of birth for the foreign-born population - Cuba (%)
Place of birth for the foreign-born population - Dominica (%)
Place of birth for the foreign-born population - Dominican Republic (%)
Place of birth for the foreign-born population - Grenada (%)
Place of birth for the foreign-born population - Haiti (%)
Place of birth for the foreign-born population - Jamaica (%)
Place of birth for the foreign-born population - St. Vincent and the Grenadines (%)
Place of birth for the foreign-born population - Trinidad and Tobago (%)
Place of birth for the foreign-born population - West Indies (%)
Place of birth for the foreign-born population - Other Caribbean (%)
Place of birth for the foreign-born population - Belize (%)
Place of birth for the foreign-born population - Costa Rica (%)
Place of birth for the foreign-born population - El Salvador (%)
Place of birth for the foreign-born population - Guatemala (%)
Place of birth for the foreign-born population - Honduras (%)
Place of birth for the foreign-born population - Mexico (%)
Place of birth for the foreign-born population - Nicaragua (%)
Place of birth for the foreign-born population - Panama (%)
Place of birth for the foreign-born population - Other Central America (%)
Place of birth for the foreign-born population - Argentina (%)
Place of birth for the foreign-born population - Bolivia (%)
Place of birth for the foreign-born population - Brazil (%)
Place of birth for the foreign-born population - Chile (%)
Place of birth for the foreign-born population - Colombia (%)
Place of birth for the foreign-born population - Ecuador (%)
Place of birth for the foreign-born population - Guyana (%)
Place of birth for the foreign-born population - Peru (%)
Place of birth for the foreign-born population - Uruguay (%)
Place of birth for the foreign-born population - Venezuela (%)
Place of birth for the foreign-born population - Other South America (%)
Place of birth for the foreign-born population - Canada (%)
Place of birth for the foreign-born population - Other Northern America (%)
Place of birth for the foreign-born population - Other (%)
Latest news about races in Aberdeen, SD collected exclusively by city-data.com from local newspapers, TV, and radio stations
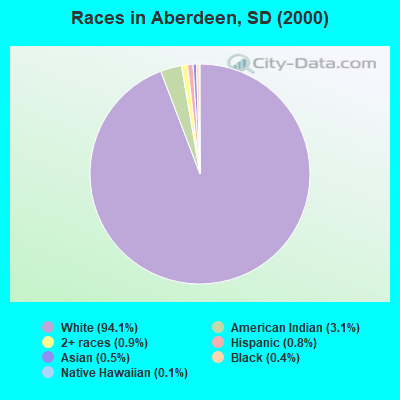
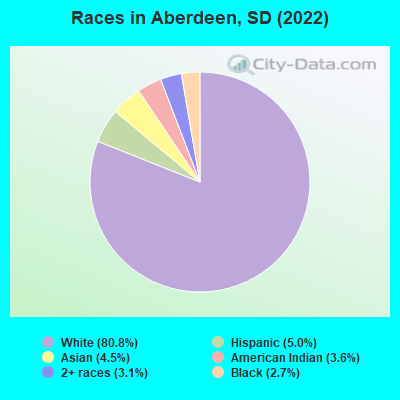
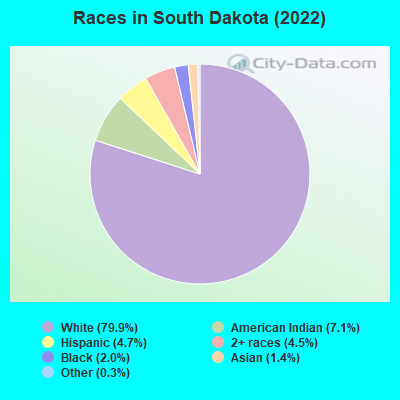
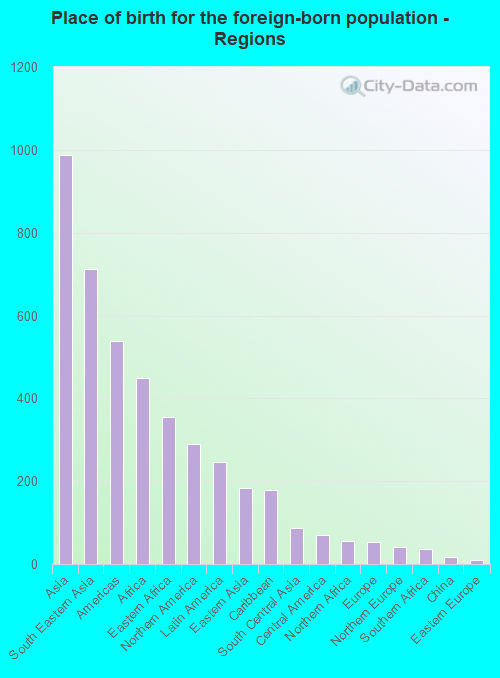
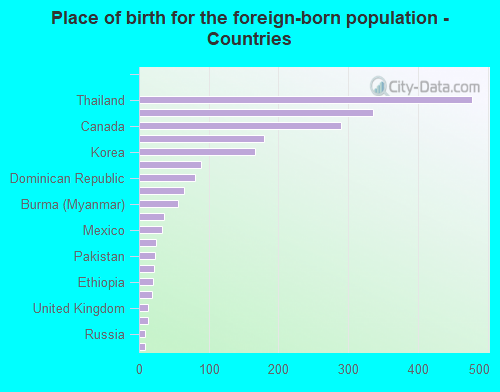
According to 2022 data, the most numerous races in Aberdeen, SD are White alone (23,432 residents), American Indian alone (1,035 residents), and Hispanic (1,460 residents). 89.8% of Aberdeen residents speak English at home. 7.0% of Aberdeen, SD residents are foreign-born (3.4% born in Asia, 1.5% born in Africa, 1.0% born in North America, 0.9% born in Latin America), which is 46.3% greater than the foreign-born rate of 3.7% across the entire state of South Dakota.
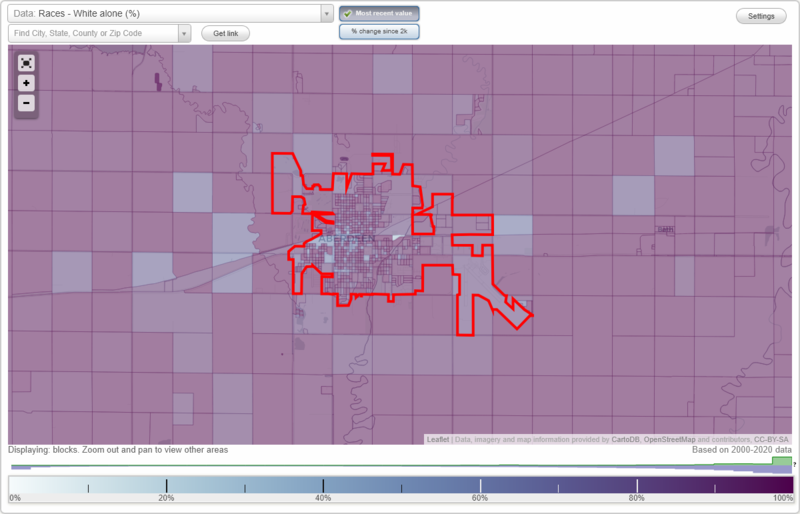
Race distribution in Aberdeen
2000 2022
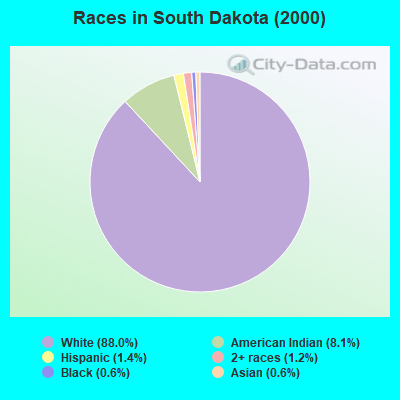
664,585 88.0% White alone 60,988 8.1% American Indian alone 10,903 1.4% Hispanic 8,960 1.2% Two or more races 4,563 0.6% Black alone 4,316 0.6% Asian alone 310 0.04% Other race alone 219 0.03% Native Hawaiian and Other
726,885 79.9% White alone 64,666 7.1% American Indian alone 42,430 4.7% Hispanic 40,984 4.5% Two or more races 18,053 2.0% Black alone 12,874 1.4% Asian alone 3,136 0.3% Other race alone 796 0.09% Native Hawaiian and Other
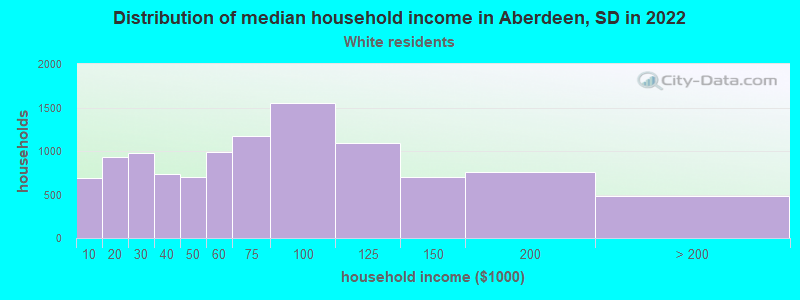
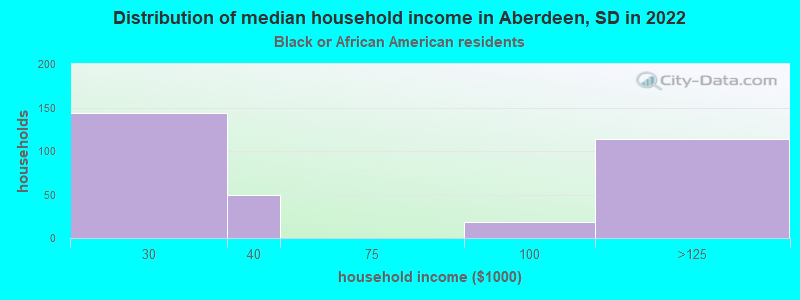
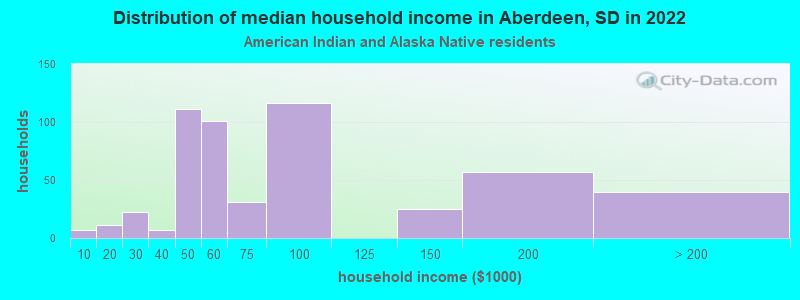
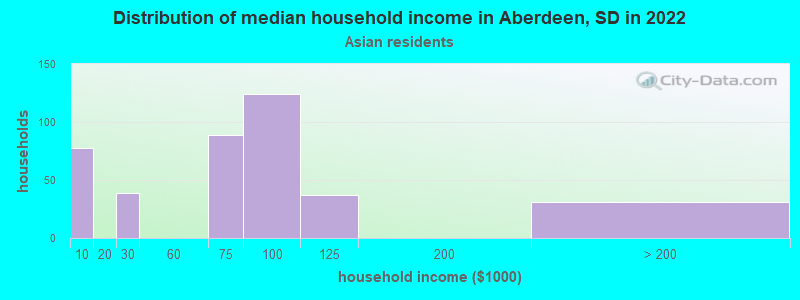
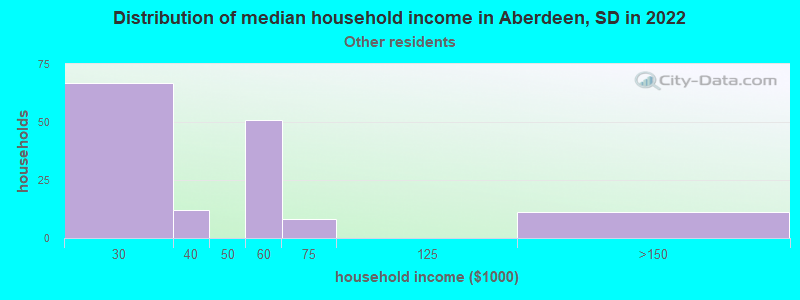
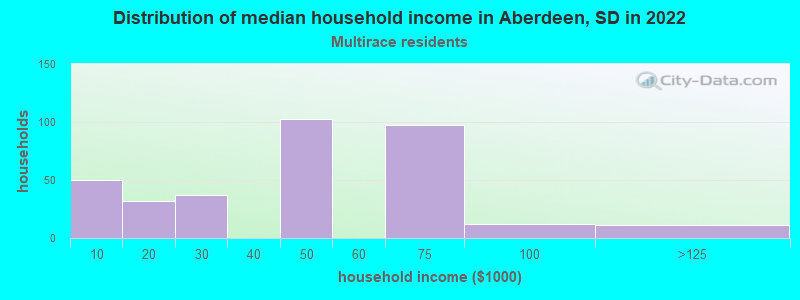
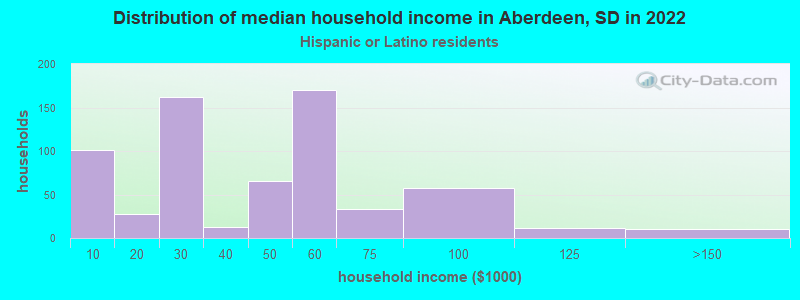
Income and house value in Aberdeen Median household income in 2022 $64,953 White non-Hispanic householders$54,853 American Indian and Alaska Native householders$62,637 Asian householders$38,219 Some other race householders$39,530 Two or more races householders$44,340 Hispanic or Latino race householdersMedian 2022 house value $220,891 White Non-Hispanic householders$345,124 Black or African American householders$176,652 American Indian or Alaska Native householders$227,254 Some other race householders$136,352 Two or more races householders$227,254 Hispanic or Latino householders
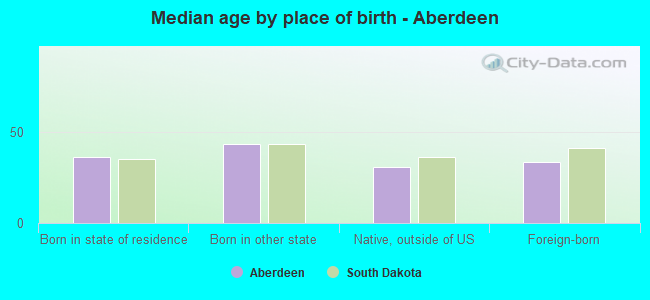
Median age by race in Aberdeen
40.3 Median age for White residents38.5 42.5 30.5 Median age for Black or African American residents31.0 23.3 32.8 Median age for American Indian / Alaska Native residents25.8 37.1 23.0 Median age for Asian residents26.7 20.1 -1,333,333,332.0 Median age for Native Hawaiian / Pacific Islander residents-1,038,202,246.2 -670,599,802.7 33.1 Median age for Other race residents26.1 55.1 14.8 Median age for Two or more races residents13.9 15.8 40.4 Median age for White alone residents38.7 42.8 23.6 Median age for Hispanic or Latino residents22.8 24.0
Owner/renter occupied households by race in Aberdeen
House owners and renters - White residents 6,911 64.4% Owner occupied3,828 35.6% Renter occupiedHouse owners and renters - Black or African American residents 55 20.1% Owner occupied218 79.9% Renter occupiedHouse owners and renters - American Indian / Alaska Native residents 164 31.4% Owner occupied360 68.6% Renter occupiedHouse owners and renters - Asian residents 70 17.2% Owner occupied337 82.8% Renter occupiedHouse owners and renters - Other race residents 33 14.4% Owner occupied195 85.6% Renter occupiedHouse owners and renters - Two or more races residents 161 44.9% Owner occupied198 55.1% Renter occupiedHouse owners and renters - White alone residents 6,919 65.0% Owner occupied3,728 35.0% Renter occupiedHouse owners and renters - Hispanic or Latino residents 82 14.0% Owner occupied503 86.0% Renter occupied
Language usage in Aberdeen
English speakers - Total 89.8% of residents of Aberdeen speak English at home.
3.3% of residents speak Spanish at home 342 38.3% Speak English very well550 61.7% Speak English less than very well7.3% of residents speak other language at home 1,216 61.4% Speak English very well764 38.6% Speak English less than very well
English speakers - Born in the United States 95.3% of residents of Aberdeen speak English at home.
3.0% of residents speak Spanish at home 138 66.0% Speak English very well71 34.0% Speak English less than very well1.1% of residents speak other language at home 70 88.6% Speak English very well9 11.4% Speak English less than very well
English speakers - Native, born elsewhere 62.8% of residents of Aberdeen speak English at home.
33.3% of residents speak Spanish at home 45 17.2% Speak English very well216 82.8% Speak English less than very well5.0% of residents speak other language at home 39 100.0% Speak English less than very well
English speakers - Foreign-born 13.5% of residents of Aberdeen speak English at home.
16.1% of residents speak Spanish at home 56 18.7% Speak English very well244 81.3% Speak English less than very well68.9% of residents speak other language at home 571 44.6% Speak English very well710 55.4% Speak English less than very well
White (Caucasian) - Speak only English Native:
97.9% (21,662)Foreign-born:
23.9% (45)
White (Caucasian) - Speak another language Native:
2.0% (448)Foreign-born:
73.3% (138)
Black or African American - Speak only English Native:
84.2% (173)Foreign-born:
0.7% (3)
Black or African American - Speak another language Native:
9.1% (19)Foreign-born:
100.0% (354)
Asian - Speak only English Native:
63.7% (250)Foreign-born:
13.0% (115)
Asian - Speak another language Native:
34.6% (136)Foreign-born:
86.5% (764)
Other race - Speak another language Native:
55.7% (169)Foreign-born:
100.0% (171)
Two or more races - Speak another language Native:
19.6% (227)Foreign-born:
100.0% (90)
White alone - Speak only English Native:
98.0% (21,611)Foreign-born:
33.7% (46)
White alone - Speak another language Native:
1.9% (415)Foreign-born:
66.8% (92)
Hispanic or Latino - Speak another language Native:
45.9% (457)Foreign-born:
100.0% (281)
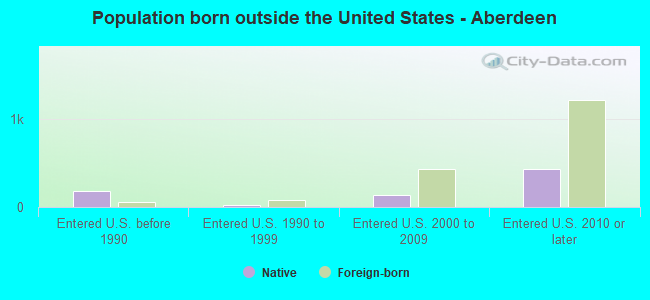
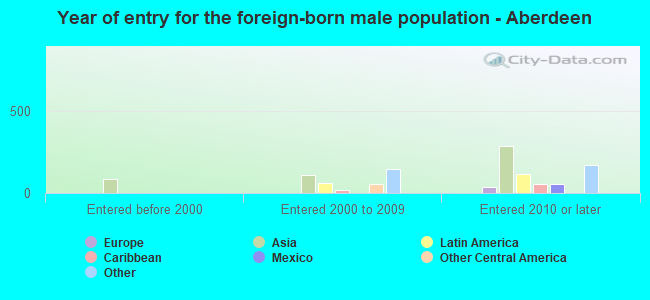
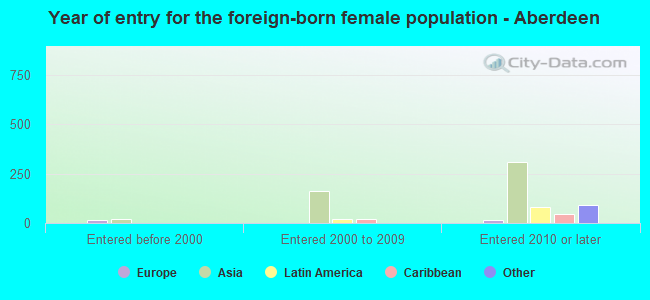
Foreign-born residents in Aberdeen 2,026 residents are foreign born (3.4% Asia , 1.5% Africa , 1.0% North America , 0.9% Latin America ).
This city:
7.0%South Dakota:
3.8%
Marital status for residents in Aberdeen Marital status - White (Caucasian) population 15 years and over
Males 37.6% Never married47.9% Now married0.5% Separated1.7% Widowed12.3% DivorcedFemales 30.4% Never married46.6% Now married0.6% Separated10.7% Widowed11.6% DivorcedWomen who gave birth in the past 12 months Now married:
48.4% (137)Unmarried:
51.6% (146)
Women who did not give birth in the past 12 months Now married:
43.6% (2,168)Unmarried:
56.4% (2,804)
Marital status - Black or African American population 15 years and over
Males 81.2% Never married18.3% Now married0.0% Separated0.0% Widowed0.5% DivorcedFemales 45.9% Never married54.1% Now married0.0% Separated0.0% Widowed0.0% DivorcedWomen who gave birth in the past 12 months Now married:
100.0% (85)Unmarried:
0.0% (0)
Women who did not give birth in the past 12 months Now married:
0.0% (0)Unmarried:
100.0% (72)
Marital status - American Indian / Alaska Native population 15 years and over
Males 50.2% Never married11.2% Now married0.0% Separated0.0% Widowed38.6% DivorcedFemales 45.1% Never married12.6% Now married0.8% Separated11.5% Widowed30.0% DivorcedWomen who gave birth in the past 12 months Now married:
0.0% (0)Unmarried:
100.0% (14)
Women who did not give birth in the past 12 months Now married:
11.1% (35)Unmarried:
88.9% (278)
Marital status - Asian population 15 years and over
Males 69.6% Never married30.4% Now married0.0% Separated0.0% Widowed0.0% DivorcedFemales 39.3% Never married44.1% Now married0.0% Separated9.0% Widowed7.6% DivorcedWomen who gave birth in the past 12 months Now married:
74.3% (73)Unmarried:
25.7% (25)
Women who did not give birth in the past 12 months Now married:
23.4% (73)Unmarried:
76.6% (238)
Marital status - Other race population 15 years and over
Males 24.8% Never married56.2% Now married5.0% Separated0.0% Widowed14.0% DivorcedFemales 27.4% Never married72.6% Now married0.0% Separated0.0% Widowed0.0% DivorcedWomen who did not give birth in the past 12 months Now married:
46.5% (26)Unmarried:
53.5% (30)
Marital status - Two or more races population 15 years and over
Males 56.5% Never married27.2% Now married0.0% Separated0.0% Widowed16.3% DivorcedFemales 60.2% Never married32.2% Now married0.0% Separated0.0% Widowed7.5% DivorcedWomen who gave birth in the past 12 months Now married:
0.0% (0)Unmarried:
100.0% (22)
Women who did not give birth in the past 12 months Now married:
12.9% (35)Unmarried:
87.1% (233)
Marital status - White alone, not Hispanic / Latino population 15 years and over
Males 37.0% Never married48.4% Now married0.5% Separated1.7% Widowed12.5% DivorcedFemales 29.8% Never married47.1% Now married0.6% Separated10.8% Widowed11.7% DivorcedWomen who gave birth in the past 12 months Now married:
48.4% (138)Unmarried:
51.6% (147)
Women who did not give birth in the past 12 months Now married:
44.4% (2,174)Unmarried:
55.6% (2,717)
Marital status - Hispanic or Latino population 15 years and over
Males 60.7% Never married27.1% Now married1.3% Separated0.0% Widowed10.9% DivorcedFemales 57.9% Never married26.0% Now married0.0% Separated13.9% Widowed2.2% DivorcedWomen who gave birth in the past 12 months Now married:
0.0% (0)Unmarried:
100.0% (20)
Women who did not give birth in the past 12 months Now married:
16.4% (46)Unmarried:
83.6% (234)
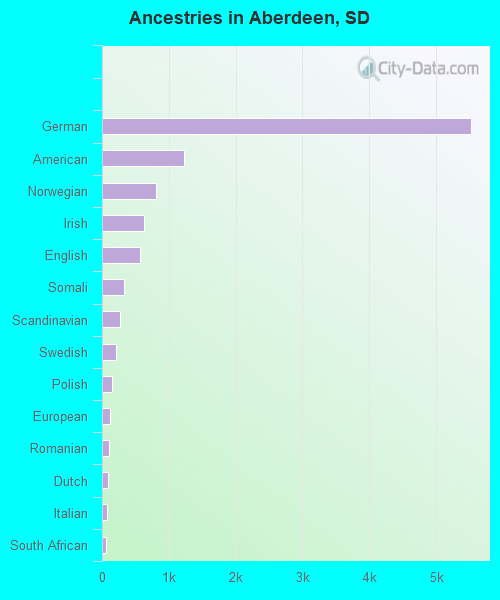
Ancestries in Aberdeen
5,517 40.3% German1,222 8.9% American812 5.9% Norwegian636 4.6% Irish566 4.1% English332 2.4% Somali267 2.0% Scandinavian204 1.5% Swedish144 1.1% Polish122 0.9% European110 0.8% Romanian90 0.7% Dutch69 0.5% Italian53 0.4% South African48 0.4% Danish47 0.3% Finnish31 0.2% Scotch-Irish31 0.2% Welsh22 0.2% Scottish21 0.2% Ethiopian18 0.1% French Canadian17 0.1% German Russian16 0.1% Northern European14 0.1% African11 0.08% British11 0.08% French10 0.07% Czech8 0.06% Jamaican7 0.05% Belgian7 0.05% Russian
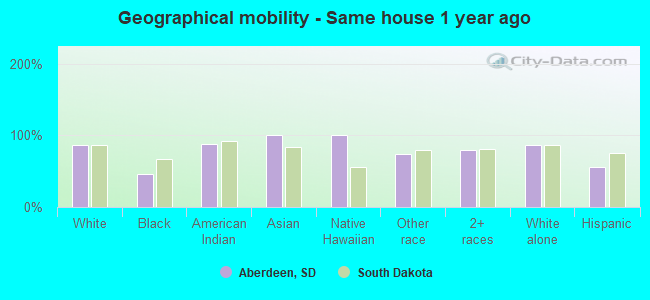
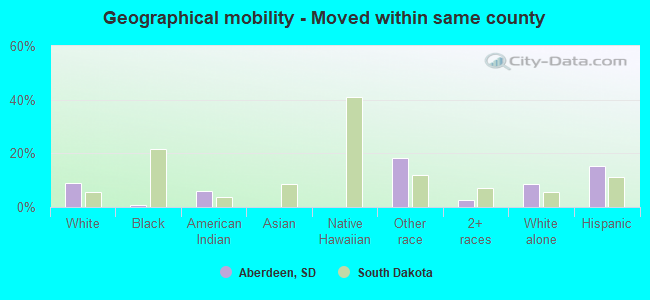
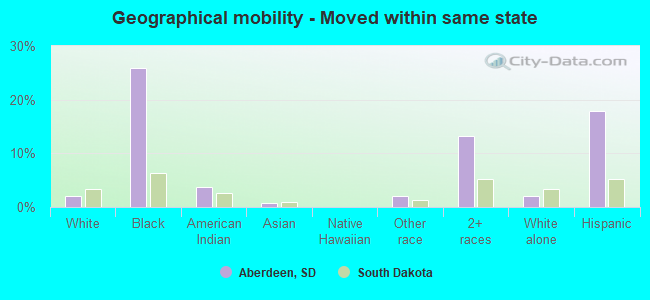
Geographical mobility in Aberdeen Same house 1 year ago 20,172 86.5% White (Caucasian)347 46.4% Black or African American991 88.3% American Indian / Alaska Native1,318 99.6% Asian14 100.0% Native Hawaiian / Pacific Islander392 73.8% Other race1,176 79.6% Two or more races20,182 87.0% White alone, not Hispanic / Latino792 56.1% Hispanic or LatinoMoved within same county 2,095 9.0% White / Caucasian5 0.6% Black or African American68 6.1% American Indian / Alaska Native97 18.2% Other race39 2.7% Two or more races2,003 8.6% White alone, not Hispanic / Latino215 15.2% Hispanic or LatinoMoved within same state 485 2.1% White / Caucasian193 25.8% Black or African American41 3.7% American Indian / Alaska Native11 0.8% Asian11 2.0% Other race195 13.2% Two or more races466 2.0% White alone, not Hispanic / Latino254 18.0% Hispanic or LatinoMoved from different state 442 1.9% White / Caucasian65 8.7% Black or African American7 1.2% Other race34 2.3% Two or more races416 1.8% White alone, not Hispanic / Latino86 6.1% Hispanic or LatinoMoved from abroad 58 0.2% White35 2.7% Asian32 5.9% Other race65 0.3% White alone, not Hispanic / Latino24 1.7% Hispanic or Latino
Children Nativity (place of birth) in Aberdeen
Children under 6 years - Living with two parents Both parents native 1,191 100.0% NativeBoth parents foreign-born 95 100.0% NativeOne native, one foreign-born parent 59 100.0% NativeChildren under 6 years - Living with one parent Native parent 593 100.0% NativeForeign-born parent 61 100.0% NativeChildren 6 to 17 years - Living with two parents Both parents native 2,686 100.0% NativeBoth parents foreign-born 91 75.8% Native29 24.2% Foreign-bornOne native, one foreign-born parent 17 100.0% NativeChildren 6 to 17 years - Living with one parent Native parent 1,196 100.0% NativeForeign-born parent 13 43.5% Native17 56.5% Foreign-born
Grandparents responsible for own grandchildren in Aberdeen
Grandparents (30 to 59 years) White / Caucasian 41 39.2% Responsible for grandchildren64 60.8% Not responsible for grandchildrenAmerican Indian / Alaska Native 18 100.0% Responsible for grandchildrenOther race 35 100.0% Responsible for grandchildrenWhite alone, not Hispanic / Latino 41 39.1% Responsible for grandchildren64 60.9% Not responsible for grandchildrenHispanic or Latino 29 100.0% Responsible for grandchildrenGrandparents (60 years and over) White / Caucasian 35 52.9% Responsible for grandchildren31 47.1% Not responsible for grandchildrenAmerican Indian / Alaska Native 18 55.8% Responsible for grandchildren14 44.2% Not responsible for grandchildrenOther race 45 100.0% Responsible for grandchildrenWhite alone, not Hispanic / Latino 36 53.5% Responsible for grandchildren31 46.5% Not responsible for grandchildrenHispanic or Latino 54 100.0% Responsible for grandchildren