Races in Aiea, Hawaii (HI) Detailed Stats
Data:
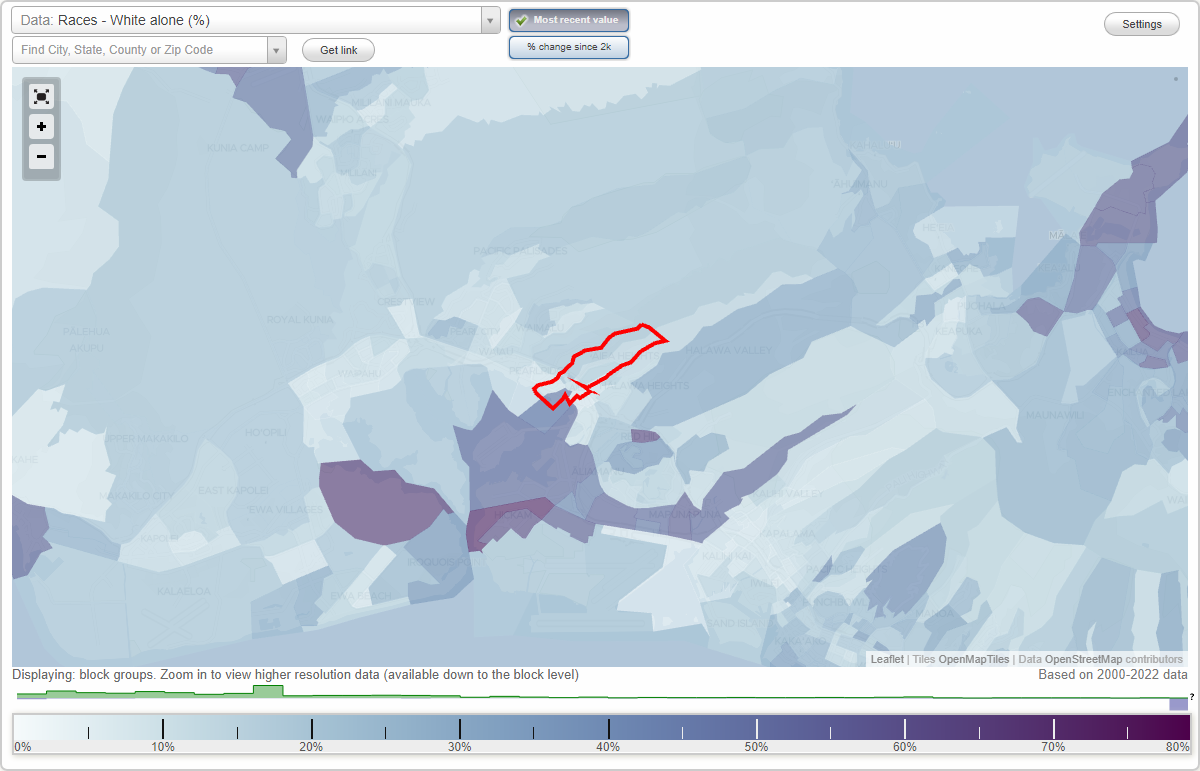
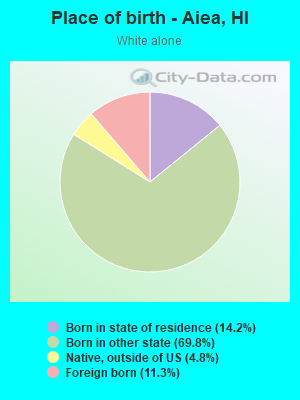
Races - White alone (%)
Races - White alone (% change since 2000)
Races - Black alone (%)
Races - Black alone (% change since 2000)
Races - American Indian alone (%)
Races - American Indian alone (% change since 2000)
Races - Asian alone (%)
Races - Asian alone (% change since 2000)
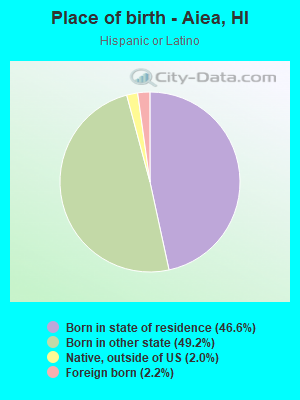
Races - Hispanic (%)
Races - Hispanic (% change since 2000)
Races - Native Hawaiian and Other Pacific Islander alone (%)
Races - Native Hawaiian and Other Pacific Islander alone (% change since 2000)
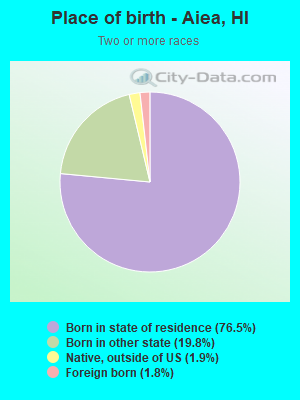
Races - Two or more races(%)
Races - Two or more races(% change since 2000)
Races - Other race alone (%)
Races - Other race alone (% change since 2000)
Racial diversity
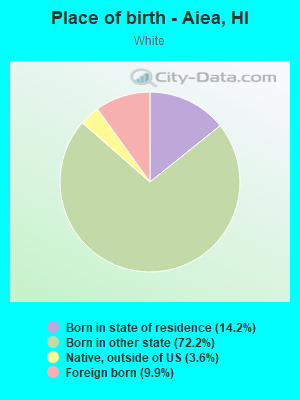
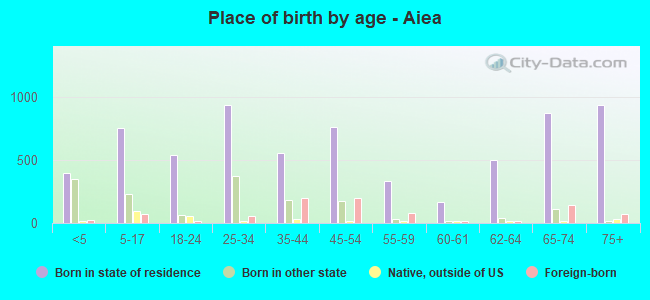
Place of birth - Born in state of residence (%)
Place of birth - Born in state of residence (%) - White
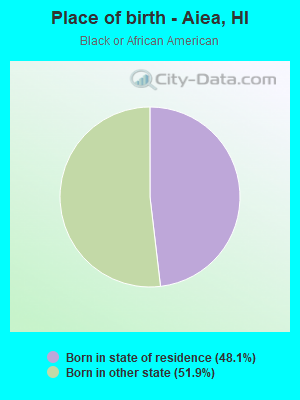
Place of birth - Born in state of residence (%) - Black or African American
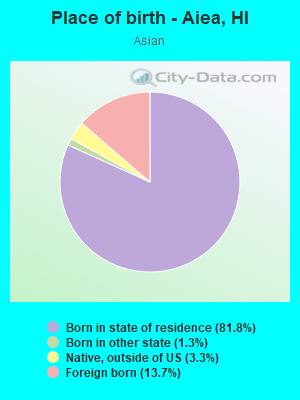
Place of birth - Born in state of residence (%) - Asian
Place of birth - Born in state of residence (%) - Hispanic or Latino
Place of birth - Born in state of residence (%) - American Indian and Alaska Native
Place of birth - Born in state of residence (%) - Multirace
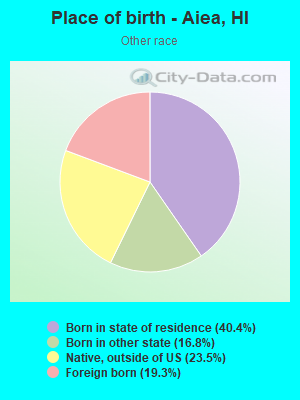
Place of birth - Born in state of residence (%) - Other Race
Place of birth - Born in other state (%)
Place of birth - Born in other state (%) - White
Place of birth - Born in other state (%) - Black or African American
Place of birth - Born in other state (%) - Asian
Place of birth - Born in other state (%) - Hispanic or Latino
Place of birth - Born in other state (%) - American Indian and Alaska Native
Place of birth - Born in other state (%) - Multirace
Place of birth - Born in other state (%) - Other Race
Place of birth - Native, outside of US (%)
Place of birth - Native, outside of US (%) - White
Place of birth - Native, outside of US (%) - Black or African American
Place of birth - Native, outside of US (%) - Asian
Place of birth - Native, outside of US (%) - Hispanic or Latino
Place of birth - Native, outside of US (%) - American Indian and Alaska Native
Place of birth - Native, outside of US (%) - Multirace
Place of birth - Native, outside of US (%) - Other Race
Place of birth - Foreign born (%)
Place of birth - Foreign born (%) - White
Place of birth - Foreign born (%) - Black or African American
Place of birth - Foreign born (%) - Asian
Place of birth - Foreign born (%) - Hispanic or Latino
Place of birth - Foreign born (%) - American Indian and Alaska Native
Place of birth - Foreign born (%) - Multirace
Place of birth - Foreign born (%) - Other Race
Residents speaking English at home (%)
Residents speaking English at home - Born in the United States (%)
Residents speaking English at home - Native, born elsewhere (%)
Residents speaking English at home - Foreign born (%)
Residents speaking Spanish at home (%)
Residents speaking Spanish at home - Born in the United States (%)
Residents speaking Spanish at home - Native, born elsewhere (%)
Residents speaking Spanish at home - Foreign born (%)
Residents speaking other language at home (%)
Residents speaking other language at home - Born in the United States (%)
Residents speaking other language at home - Native, born elsewhere (%)
Residents speaking other language at home - Foreign born (%)
Marital status - Never married (%)
Marital status - Now married (%)
Marital status - Separated (%)
Marital status - Widowed (%)
Marital status - Divorced (%)
Ancestries Reported - Arab (%)
Ancestries Reported - Czech (%)
Ancestries Reported - Danish (%)
Ancestries Reported - Dutch (%)
Ancestries Reported - English (%)
Ancestries Reported - French (%)
Ancestries Reported - French Canadian (%)
Ancestries Reported - German (%)
Ancestries Reported - Greek (%)
Ancestries Reported - Hungarian (%)
Ancestries Reported - Irish (%)
Ancestries Reported - Italian (%)
Ancestries Reported - Lithuanian (%)
Ancestries Reported - Norwegian (%)
Ancestries Reported - Polish (%)
Ancestries Reported - Portuguese (%)
Ancestries Reported - Russian (%)
Ancestries Reported - Scotch-Irish (%)
Ancestries Reported - Scottish (%)
Ancestries Reported - Slovak (%)
Ancestries Reported - Subsaharan African (%)
Ancestries Reported - Swedish (%)
Ancestries Reported - Swiss (%)
Ancestries Reported - Ukrainian (%)
Ancestries Reported - United States (%)
Ancestries Reported - Welsh (%)
Ancestries Reported - West Indian (%)
Ancestries Reported - Other (%)
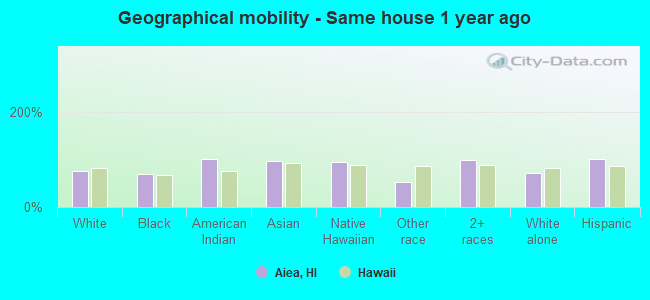
Geographical mobility - Same house 1 year ago (%)
Geographical mobility - Same house 1 year ago (%) - White
Geographical mobility - Same house 1 year ago (%) - Black or African American
Geographical mobility - Same house 1 year ago (%) - Asian
Geographical mobility - Same house 1 year ago (%) - Hispanic or Latino
Geographical mobility - Same house 1 year ago (%) - American Indian and Alaska Native
Geographical mobility - Same house 1 year ago (%) - Multirace
Geographical mobility - Same house 1 year ago (%) - Other Race
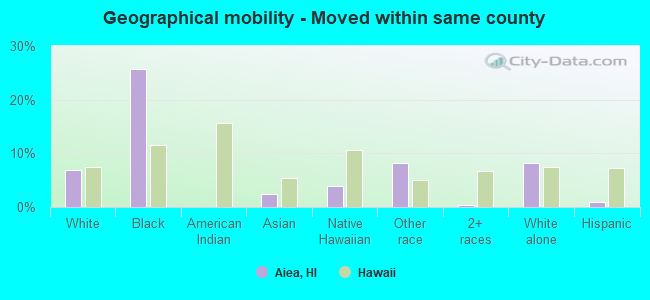
Geographical mobility - Moved within same county (%)
Geographical mobility - Moved within same county (%) - White
Geographical mobility - Moved within same county (%) - Black or African American
Geographical mobility - Moved within same county (%) - Asian
Geographical mobility - Moved within same county (%) - Hispanic or Latino
Geographical mobility - Moved within same county (%) - American Indian and Alaska Native
Geographical mobility - Moved within same county (%) - Multirace
Geographical mobility - Moved within same county (%) - Other Race
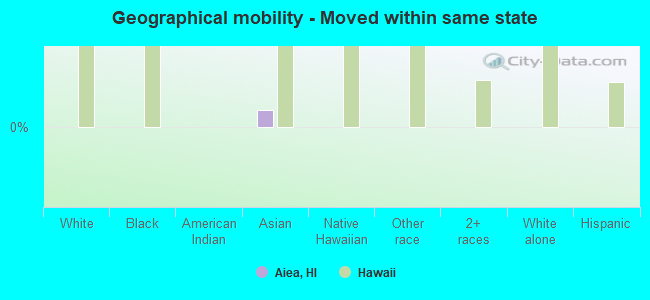
Geographical mobility - Moved from different county within same state (%)
Geographical mobility - Moved from different county within same state (%) - White
Geographical mobility - Moved from different county within same state (%) - Black or African American
Geographical mobility - Moved from different county within same state (%) - Asian
Geographical mobility - Moved from different county within same state (%) - Hispanic or Latino
Geographical mobility - Moved from different county within same state (%) - American Indian and Alaska Native
Geographical mobility - Moved from different county within same state (%) - Multirace
Geographical mobility - Moved from different county within same state (%) - Other Race
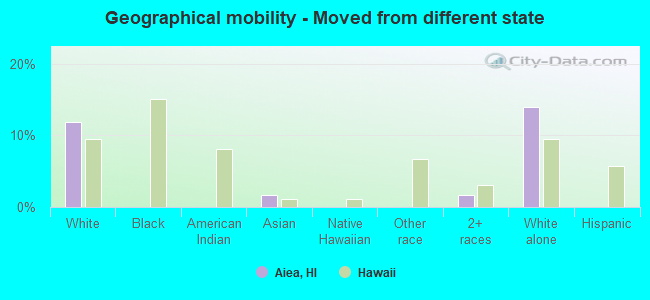
Geographical mobility - Moved from different state (%)
Geographical mobility - Moved from different state (%) - White
Geographical mobility - Moved from different state (%) - Black or African American
Geographical mobility - Moved from different state (%) - Asian
Geographical mobility - Moved from different state (%) - Hispanic or Latino
Geographical mobility - Moved from different state (%) - American Indian and Alaska Native
Geographical mobility - Moved from different state (%) - Multirace
Geographical mobility - Moved from different state (%) - Other Race
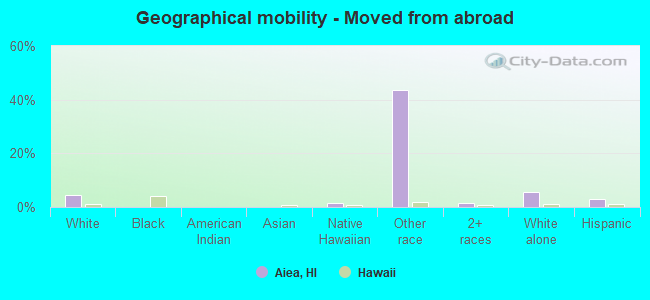
Geographical mobility - Moved from abroad (%)
Geographical mobility - Moved from abroad (%) - White
Geographical mobility - Moved from abroad (%) - Black or African American
Geographical mobility - Moved from abroad (%) - Asian
Geographical mobility - Moved from abroad (%) - Hispanic or Latino
Geographical mobility - Moved from abroad (%) - American Indian and Alaska Native
Geographical mobility - Moved from abroad (%) - Multirace
Geographical mobility - Moved from abroad (%) - Other Race
Place of birth for the foreign-born population - Ireland (%)
Place of birth for the foreign-born population - Denmark (%)
Place of birth for the foreign-born population - Norway (%)
Place of birth for the foreign-born population - Sweden (%)
Place of birth for the foreign-born population - United Kingdom (%)
Place of birth for the foreign-born population - England (%)
Place of birth for the foreign-born population - Scotland (%)
Place of birth for the foreign-born population - Other Northern Europe (%)
Place of birth for the foreign-born population - Austria (%)
Place of birth for the foreign-born population - Belgium (%)
Place of birth for the foreign-born population - France (%)
Place of birth for the foreign-born population - Germany (%)
Place of birth for the foreign-born population - Netherlands (%)
Place of birth for the foreign-born population - Switzerland (%)
Place of birth for the foreign-born population - Other Western Europe (%)
Place of birth for the foreign-born population - Greece (%)
Place of birth for the foreign-born population - Italy (%)
Place of birth for the foreign-born population - Portugal (%)
Place of birth for the foreign-born population - Spain (%)
Place of birth for the foreign-born population - Other Southern Europe (%)
Place of birth for the foreign-born population - Albania (%)
Place of birth for the foreign-born population - Belarus (%)
Place of birth for the foreign-born population - Bosnia and Herzegovina (%)
Place of birth for the foreign-born population - Bulgaria (%)
Place of birth for the foreign-born population - Croatia (%)
Place of birth for the foreign-born population - Czechoslovakia (%)
Place of birth for the foreign-born population - Hungary (%)
Place of birth for the foreign-born population - Latvia (%)
Place of birth for the foreign-born population - Lithuania (%)
Place of birth for the foreign-born population - North Macedonia (Macedonia) (%)
Place of birth for the foreign-born population - Moldova (%)
Place of birth for the foreign-born population - Poland (%)
Place of birth for the foreign-born population - Romania (%)
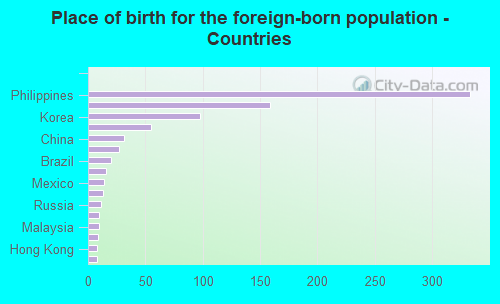
Place of birth for the foreign-born population - Russia (%)
Place of birth for the foreign-born population - Serbia (%)
Place of birth for the foreign-born population - Ukraine (%)
Place of birth for the foreign-born population - Other Eastern Europe (%)
Place of birth for the foreign-born population - China (%)
Place of birth for the foreign-born population - Hong Kong (%)
Place of birth for the foreign-born population - Taiwan (%)
Place of birth for the foreign-born population - Japan (%)
Place of birth for the foreign-born population - Korea (%)
Place of birth for the foreign-born population - Other Eastern Asia (%)
Place of birth for the foreign-born population - Afghanistan (%)
Place of birth for the foreign-born population - Bangladesh (%)
Place of birth for the foreign-born population - India (%)
Place of birth for the foreign-born population - Iran (%)
Place of birth for the foreign-born population - Kazakhstan (%)
Place of birth for the foreign-born population - Nepal (%)
Place of birth for the foreign-born population - Pakistan (%)
Place of birth for the foreign-born population - Sri Lanka (%)
Place of birth for the foreign-born population - Uzbekistan (%)
Place of birth for the foreign-born population - Other South Central Asia (%)
Place of birth for the foreign-born population - Burma (%)
Place of birth for the foreign-born population - Cambodia (%)
Place of birth for the foreign-born population - Indonesia (%)
Place of birth for the foreign-born population - Laos (%)
Place of birth for the foreign-born population - Malaysia (%)
Place of birth for the foreign-born population - Philippines (%)
Place of birth for the foreign-born population - Singapore (%)
Place of birth for the foreign-born population - Thailand (%)
Place of birth for the foreign-born population - Vietnam (%)
Place of birth for the foreign-born population - Other South Eastern Asia (%)
Place of birth for the foreign-born population - Armenia (%)
Place of birth for the foreign-born population - Iraq (%)
Place of birth for the foreign-born population - Israel (%)
Place of birth for the foreign-born population - Jordan (%)
Place of birth for the foreign-born population - Kuwait (%)
Place of birth for the foreign-born population - Lebanon (%)
Place of birth for the foreign-born population - Saudi Arabia (%)
Place of birth for the foreign-born population - Syria (%)
Place of birth for the foreign-born population - Turkey (%)
Place of birth for the foreign-born population - Yemen (%)
Place of birth for the foreign-born population - Other Western Asia (%)
Place of birth for the foreign-born population - Eritrea (%)
Place of birth for the foreign-born population - Ethiopia (%)
Place of birth for the foreign-born population - Kenya (%)
Place of birth for the foreign-born population - Somalia (%)
Place of birth for the foreign-born population - Uganda (%)
Place of birth for the foreign-born population - Zimbabwe (%)
Place of birth for the foreign-born population - Other Eastern Africa (%)
Place of birth for the foreign-born population - Cameroon (%)
Place of birth for the foreign-born population - Congo (%)
Place of birth for the foreign-born population - Democratic Republic of Congo (Zaire) (%)
Place of birth for the foreign-born population - Other Middle Africa (%)
Place of birth for the foreign-born population - Egypt (%)
Place of birth for the foreign-born population - Morocco (%)
Place of birth for the foreign-born population - Sudan (%)
Place of birth for the foreign-born population - Other Northern Africa (%)
Place of birth for the foreign-born population - South Africa (%)
Place of birth for the foreign-born population - Other Southern Africa (%)
Place of birth for the foreign-born population - Cabo Verde (%)
Place of birth for the foreign-born population - Ghana (%)
Place of birth for the foreign-born population - Liberia (%)
Place of birth for the foreign-born population - Nigeria (%)
Place of birth for the foreign-born population - Senegal (%)
Place of birth for the foreign-born population - Sierra Leone (%)
Place of birth for the foreign-born population - Other Western Africa (%)
Place of birth for the foreign-born population - Australia (%)
Place of birth for the foreign-born population - New Zealand (%)
Place of birth for the foreign-born population - Fiji (%)
Place of birth for the foreign-born population - Micronesia (%)
Place of birth for the foreign-born population - Bahamas (%)
Place of birth for the foreign-born population - Barbados (%)
Place of birth for the foreign-born population - Cuba (%)
Place of birth for the foreign-born population - Dominica (%)
Place of birth for the foreign-born population - Dominican Republic (%)
Place of birth for the foreign-born population - Grenada (%)
Place of birth for the foreign-born population - Haiti (%)
Place of birth for the foreign-born population - Jamaica (%)
Place of birth for the foreign-born population - St. Vincent and the Grenadines (%)
Place of birth for the foreign-born population - Trinidad and Tobago (%)
Place of birth for the foreign-born population - West Indies (%)
Place of birth for the foreign-born population - Other Caribbean (%)
Place of birth for the foreign-born population - Belize (%)
Place of birth for the foreign-born population - Costa Rica (%)
Place of birth for the foreign-born population - El Salvador (%)
Place of birth for the foreign-born population - Guatemala (%)
Place of birth for the foreign-born population - Honduras (%)
Place of birth for the foreign-born population - Mexico (%)
Place of birth for the foreign-born population - Nicaragua (%)
Place of birth for the foreign-born population - Panama (%)
Place of birth for the foreign-born population - Other Central America (%)
Place of birth for the foreign-born population - Argentina (%)
Place of birth for the foreign-born population - Bolivia (%)
Place of birth for the foreign-born population - Brazil (%)
Place of birth for the foreign-born population - Chile (%)
Place of birth for the foreign-born population - Colombia (%)
Place of birth for the foreign-born population - Ecuador (%)
Place of birth for the foreign-born population - Guyana (%)
Place of birth for the foreign-born population - Peru (%)
Place of birth for the foreign-born population - Uruguay (%)
Place of birth for the foreign-born population - Venezuela (%)
Place of birth for the foreign-born population - Other South America (%)
Place of birth for the foreign-born population - Canada (%)
Place of birth for the foreign-born population - Other Northern America (%)
Place of birth for the foreign-born population - Other (%)
Latest news about races in Aiea, HI collected exclusively by city-data.com from local newspapers, TV, and radio stations
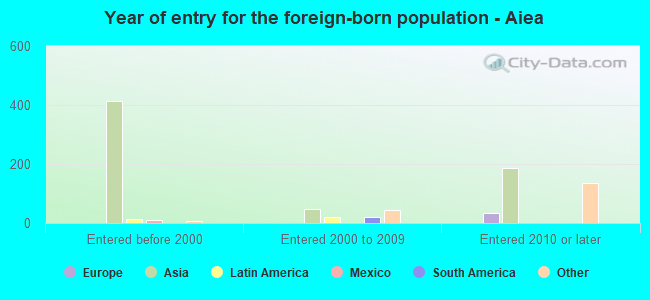
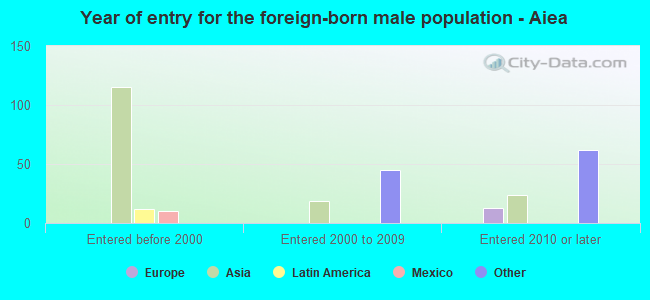
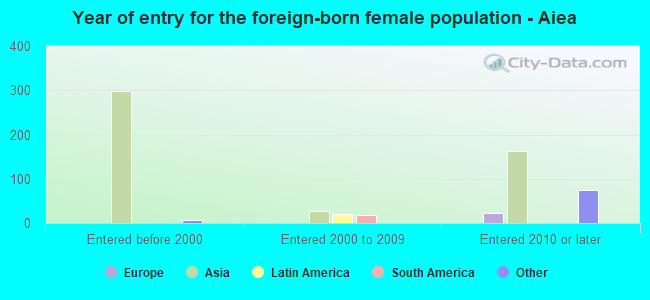
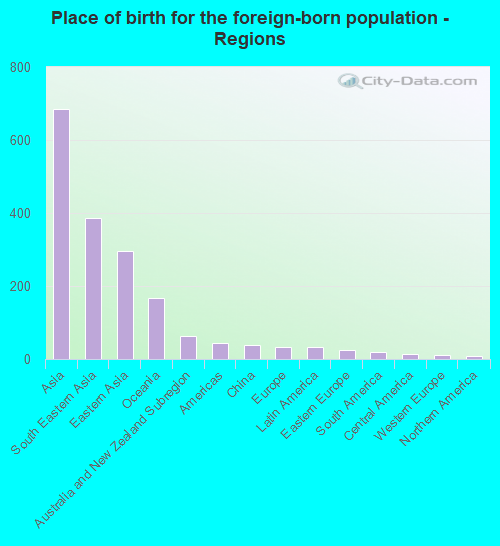
According to 2022 data, the most numerous races in Aiea, HI are Asian alone (4,454 residents), Two or more races (1,921 residents), and White alone (1,102 residents). 85.4% of Aiea residents speak English at home. 9.9% of Aiea, HI residents are foreign-born (7.0% born in Asia, 1.7% born in Oceania), which is 82.6% less than the foreign-born rate of 18.0% across the entire state of Hawaii.
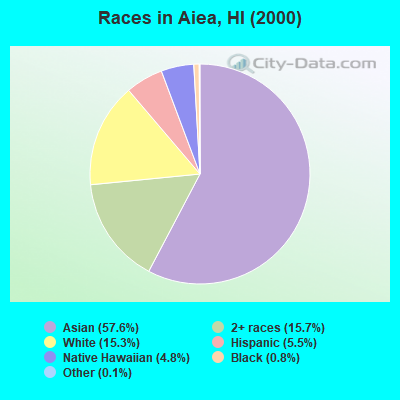
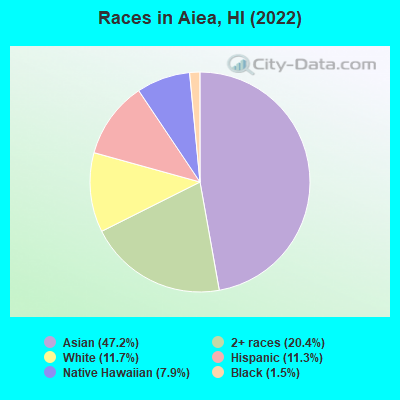
Race distribution in Aiea
2000 2022
494,149 40.8% Asian alone 277,091 22.9% White alone 218,700 18.1% Two or more races 108,441 9.0% Native Hawaiian and Other 87,699 7.2% Hispanic 20,829 1.7% Black alone 2,089 0.2% Other race alone 2,539 0.2% American Indian alone
498,125 34.6% Asian alone 318,574 22.1% Two or more races 297,937 20.7% White alone 160,103 11.1% Hispanic 134,567 9.3% Native Hawaiian and Other 23,682 1.6% Black alone 5,378 0.4% Other race alone 1,830 0.1% American Indian alone
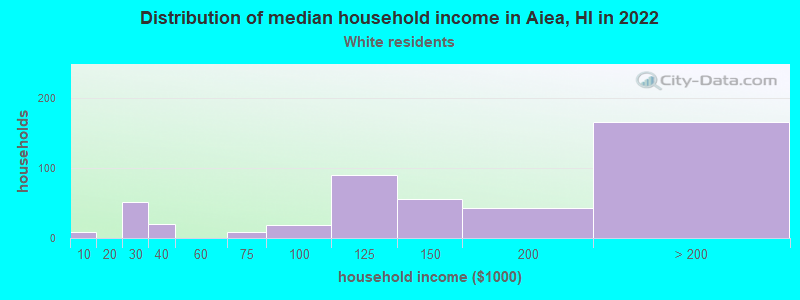
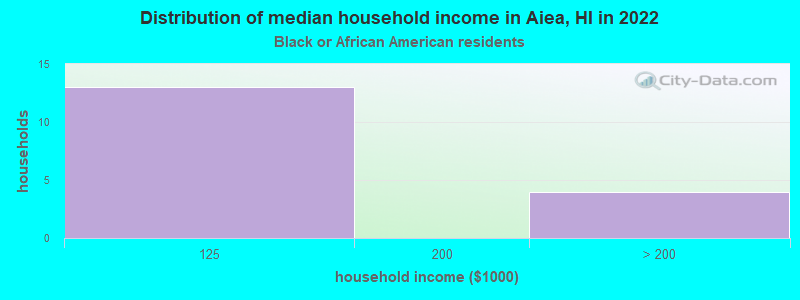
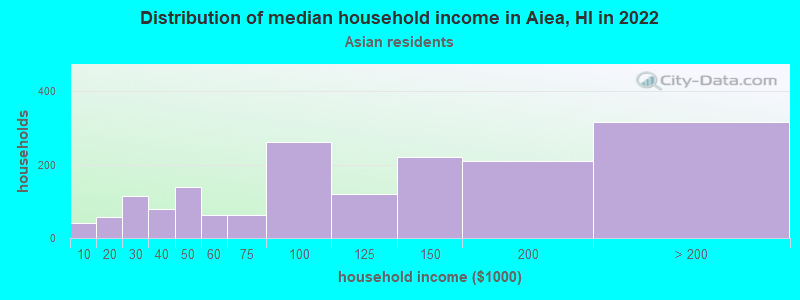
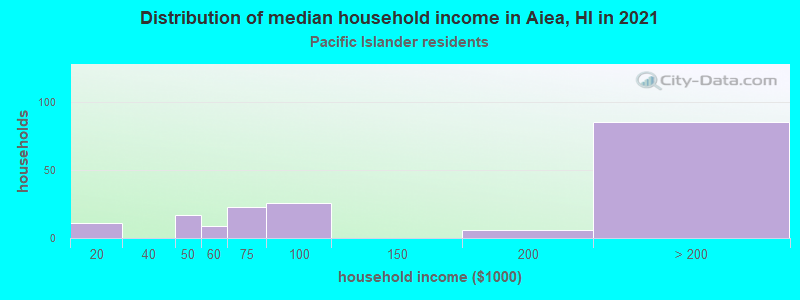
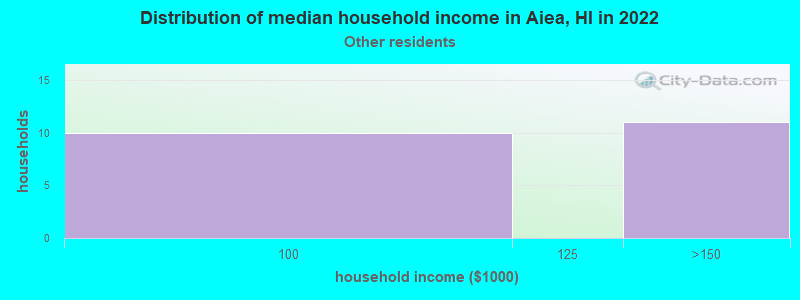
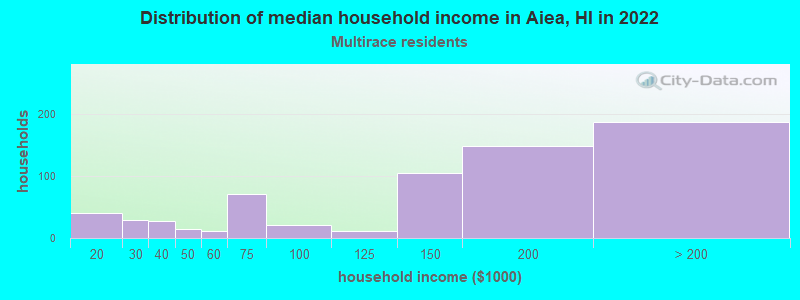
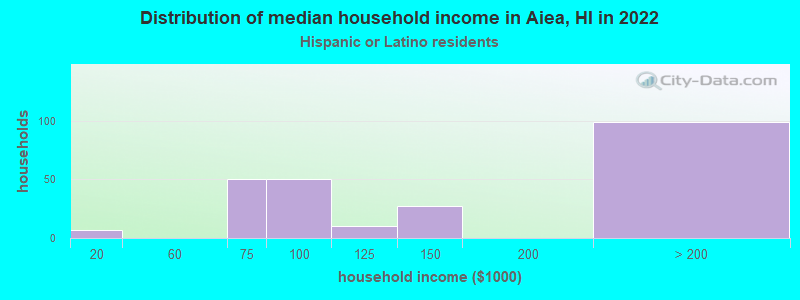
Income and house value in Aiea Median household income in 2022 $139,390 White non-Hispanic householders$102,066 Asian householders$155,983 Two or more races householders$123,020 Hispanic or Latino race householdersMedian 2022 house value over $1,000,000 White Non-Hispanic householders$809,409 Black or African American householders over $1,000,000 Asian householders$903,890 Native Hawaiian and other Pacific Islander householdersover $1,000,000 Two or more races householders$969,525 Hispanic or Latino householders
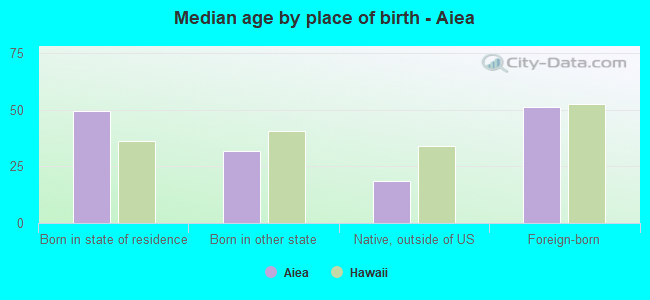
Median age by race in Aiea
33.9 Median age for White residents33.8 33.6 22.6 Median age for Black or African American residents22.9 18.9 -693,430,656.2 Median age for American Indian / Alaska Native residents-715,953,306.7 -629,508,196.1 55.5 Median age for Asian residents57.8 54.1 30.9 Median age for Native Hawaiian / Pacific Islander residents30.4 41.0 24.3 Median age for Other race residents21.7 24.3 31.3 Median age for Two or more races residents31.2 28.2 34.6 Median age for White alone residents34.9 33.8 25.8 Median age for Hispanic or Latino residents26.3 23.4
Owner/renter occupied households by race in Aiea
House owners and renters - White residents 167 36.7% Owner occupied288 63.3% Renter occupiedHouse owners and renters - Black or African American residents 23 100.0% Renter occupiedHouse owners and renters - Asian residents 1,523 90.1% Owner occupied168 9.9% Renter occupiedHouse owners and renters - Native Hawaiian / Pacific Islander residents 99 53.5% Owner occupied86 46.5% Renter occupiedHouse owners and renters - Other race residents 8 40.7% Owner occupied12 59.3% Renter occupiedHouse owners and renters - Two or more races residents 510 76.3% Owner occupied158 23.7% Renter occupiedHouse owners and renters - White alone residents 146 38.3% Owner occupied235 61.7% Renter occupiedHouse owners and renters - Hispanic or Latino residents 124 49.1% Owner occupied128 50.9% Renter occupied
Language usage in Aiea
English speakers - Total 85.4% of residents of Aiea speak English at home.
2.1% of residents speak Spanish at home 126 68.1% Speak English very well59 31.9% Speak English less than very well13.2% of residents speak other language at home 715 62.7% Speak English very well426 37.3% Speak English less than very well
English speakers - Born in the United States 84.7% of residents of Aiea speak English at home.
11.8% of residents speak Spanish at home 102 69.9% Speak English very well44 30.1% Speak English less than very well4.1% of residents speak other language at home 51 100.0% Speak English very well
English speakers - Native, born elsewhere 78.0% of residents of Aiea speak English at home.
9.0% of residents speak Spanish at home 11 50.0% Speak English very well11 50.0% Speak English less than very well14.7% of residents speak other language at home 29 80.6% Speak English very well7 19.4% Speak English less than very well
English speakers - Foreign-born 33.2% of residents of Aiea speak English at home.
0.9% of residents speak Spanish at home 8 100.0% Speak English very well65.8% of residents speak other language at home 260 46.7% Speak English very well297 53.3% Speak English less than very well
White (Caucasian) - Speak only English Native:
90.6% (934)Foreign-born:
63.1% (79)
White (Caucasian) - Speak another language Native:
8.5% (88)Foreign-born:
38.2% (48)
Asian - Speak only English Native:
90.4% (3,351)Foreign-born:
23.5% (138)
Asian - Speak another language Native:
9.8% (364)Foreign-born:
76.4% (450)
Native Hawaiian / Pacific Islander - Speak only English Native:
100.0% (559)Foreign-born:
39.3% (32)
Native Hawaiian / Pacific Islander - Speak another language Native:
1.8% (10)Foreign-born:
59.1% (47)
Other race - Speak only English Native:
60.7% (39)Foreign-born:
30.4% (5)
Other race - Speak another language Native:
37.7% (24)Foreign-born:
71.9% (13)
Two or more races - Speak only English Native:
89.0% (2,088)Foreign-born:
74.7% (36)
Two or more races - Speak another language Native:
11.1% (260)Foreign-born:
26.4% (13)
White alone - Speak only English Native:
90.1% (795)Foreign-born:
64.0% (80)
White alone - Speak another language Native:
9.3% (82)Foreign-born:
36.1% (45)
Hispanic or Latino - Speak only English Native:
75.0% (592)Foreign-born:
19.4% (5)
Hispanic or Latino - Speak another language Native:
24.6% (194)Foreign-born:
80.3% (19)
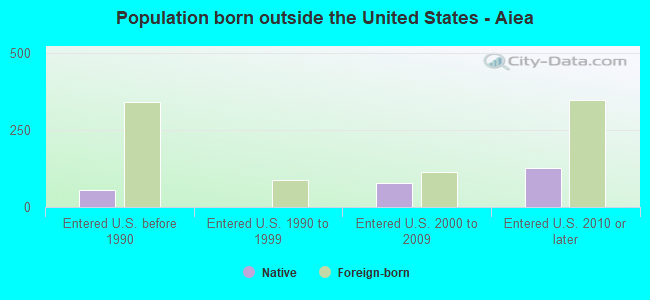
Foreign-born residents in Aiea 930 residents are foreign born (7.0% Asia , 1.7% Oceania ).
This city:
9.9%Hawaii:
18.0%
Marital status for residents in Aiea Marital status - White (Caucasian) population 15 years and over
Males 30.8% Never married63.4% Now married0.0% Separated0.0% Widowed5.8% DivorcedFemales 23.6% Never married68.5% Now married0.0% Separated5.6% Widowed2.2% DivorcedWomen who did not give birth in the past 12 months Now married:
68.3% (212)Unmarried:
31.7% (98)
Marital status - Black or African American population 15 years and over
Males 0.0% Never married100.0% Now married0.0% Separated0.0% Widowed0.0% DivorcedFemales 40.0% Never married22.9% Now married0.0% Separated0.0% Widowed37.1% DivorcedWomen who did not give birth in the past 12 months Now married:
22.9% (8)Unmarried:
77.1% (26)
Marital status - Asian population 15 years and over
Males 25.0% Never married61.3% Now married0.4% Separated5.4% Widowed7.8% DivorcedFemales 27.7% Never married48.0% Now married0.0% Separated15.1% Widowed9.1% DivorcedWomen who gave birth in the past 12 months Now married:
83.1% (47)Unmarried:
16.9% (10)
Women who did not give birth in the past 12 months Now married:
46.9% (343)Unmarried:
53.1% (388)
Marital status - Native Hawaiian / Pacific Islander population 15 years and over
Males 31.9% Never married36.4% Now married0.0% Separated0.5% Widowed31.1% DivorcedFemales 48.4% Never married51.6% Now married0.0% Separated0.0% Widowed0.0% DivorcedWomen who gave birth in the past 12 months Now married:
0.0% (0)Unmarried:
100.0% (26)
Women who did not give birth in the past 12 months Now married:
11.9% (11)Unmarried:
88.1% (79)
Marital status - Other race population 15 years and over
Males 55.1% Never married44.9% Now married0.0% Separated0.0% Widowed0.0% DivorcedFemales 45.8% Never married54.2% Now married0.0% Separated0.0% Widowed0.0% DivorcedWomen who gave birth in the past 12 months Now married:
100.0% (16)Unmarried:
0.0% (0)
Women who did not give birth in the past 12 months Now married:
0.0% (0)Unmarried:
100.0% (14)
Marital status - Two or more races population 15 years and over
Males 41.7% Never married48.5% Now married2.5% Separated2.3% Widowed5.1% DivorcedFemales 49.5% Never married40.9% Now married0.0% Separated5.7% Widowed3.9% DivorcedWomen who did not give birth in the past 12 months Now married:
22.5% (112)Unmarried:
77.5% (384)
Marital status - White alone, not Hispanic / Latino population 15 years and over
Males 27.6% Never married67.0% Now married0.0% Separated0.0% Widowed5.4% DivorcedFemales 24.9% Never married66.7% Now married0.0% Separated5.9% Widowed2.4% DivorcedWomen who did not give birth in the past 12 months Now married:
65.8% (195)Unmarried:
34.2% (101)
Marital status - Hispanic or Latino population 15 years and over
Males 32.0% Never married63.3% Now married0.0% Separated0.0% Widowed4.7% DivorcedFemales 40.6% Never married55.4% Now married0.0% Separated0.0% Widowed4.0% DivorcedWomen who gave birth in the past 12 months Now married:
100.0% (13)Unmarried:
0.0% (0)
Women who did not give birth in the past 12 months Now married:
44.2% (72)Unmarried:
55.8% (91)
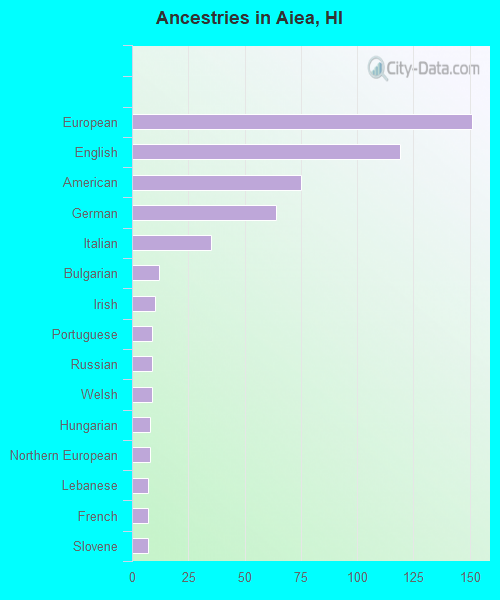
Ancestries in Aiea
151 3.0% European119 2.3% English75 1.5% American64 1.3% German35 0.7% Italian12 0.2% Bulgarian10 0.2% Irish9 0.2% Portuguese9 0.2% Russian9 0.2% Welsh8 0.2% Hungarian8 0.2% Northern European7 0.1% Lebanese7 0.1% French7 0.1% Slovene
Children Nativity (place of birth) in Aiea
Children under 6 years - Living with two parents Both parents native 641 100.0% NativeBoth parents foreign-born 15 100.0% NativeOne native, one foreign-born parent 104 100.0% NativeChildren under 6 years - Living with one parent Native parent 114 90.9% Native11 9.1% Foreign-bornChildren 6 to 17 years - Living with two parents Both parents native 447 90.0% Native50 10.0% Foreign-bornBoth parents foreign-born 33 100.0% Foreign-bornOne native, one foreign-born parent 141 100.0% NativeChildren 6 to 17 years - Living with one parent Native parent 148 100.0% NativeForeign-born parent 11 45.6% Native13 54.4% Foreign-born
Grandparents responsible for own grandchildren in Aiea
Grandparents (30 to 59 years) Asian 12 55.4% Responsible for grandchildren9 44.6% Not responsible for grandchildren
Grandparents (60 years and over) Asian 4 2.0% Responsible for grandchildren223 98.0% Not responsible for grandchildren