Races in Alliance, Ohio (OH) Detailed Stats
Data:
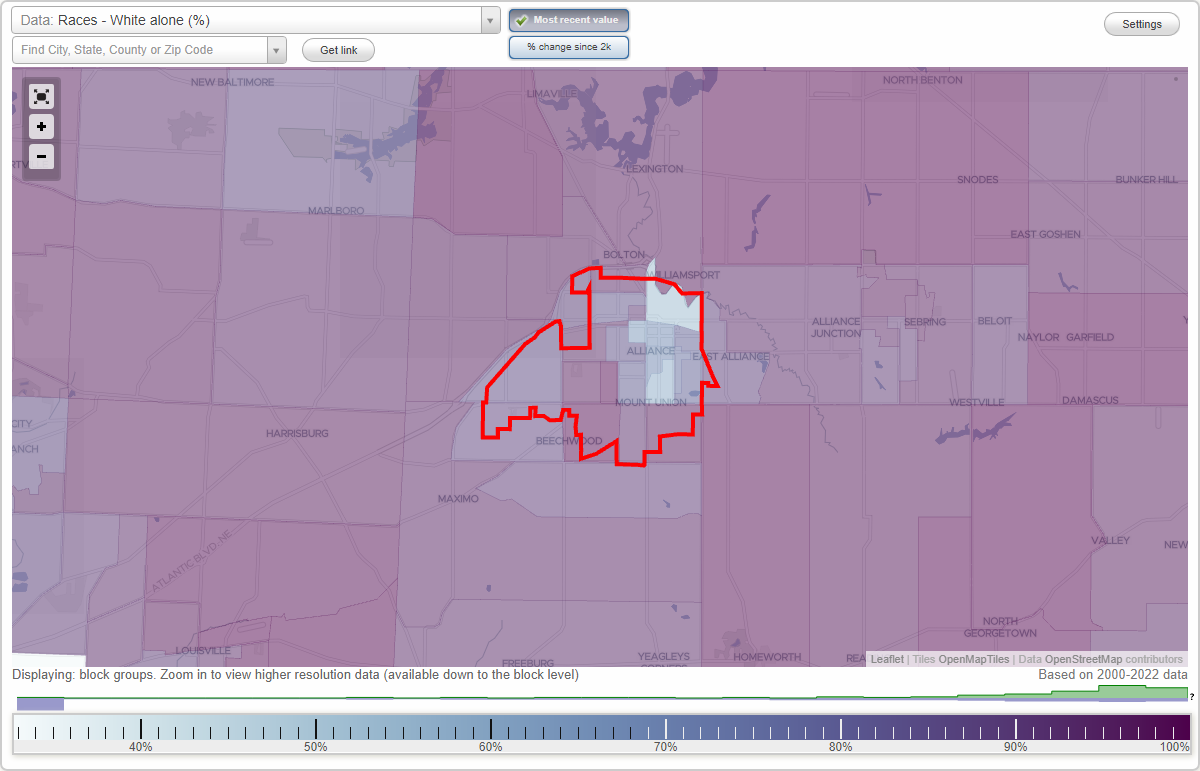
Races - White alone (%)
Races - White alone (% change since 2000)
Races - Black alone (%)
Races - Black alone (% change since 2000)
Races - American Indian alone (%)
Races - American Indian alone (% change since 2000)
Races - Asian alone (%)
Races - Asian alone (% change since 2000)
Races - Hispanic (%)
Races - Hispanic (% change since 2000)
Races - Native Hawaiian and Other Pacific Islander alone (%)
Races - Native Hawaiian and Other Pacific Islander alone (% change since 2000)
Races - Two or more races(%)
Races - Two or more races(% change since 2000)
Races - Other race alone (%)
Races - Other race alone (% change since 2000)
Racial diversity
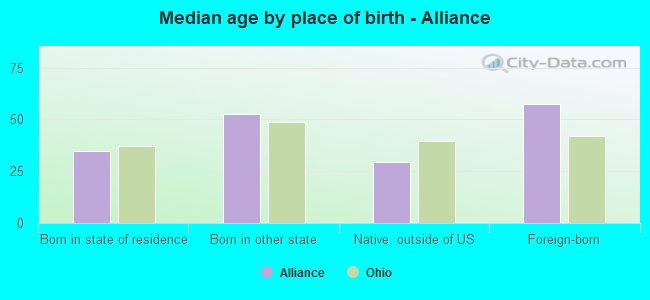
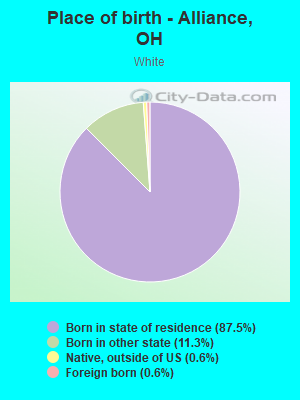
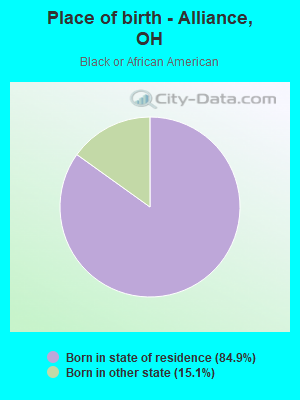
Place of birth - Born in state of residence (%)
Place of birth - Born in state of residence (%) - White
Place of birth - Born in state of residence (%) - Black or African American
Place of birth - Born in state of residence (%) - Asian
Place of birth - Born in state of residence (%) - Hispanic or Latino
Place of birth - Born in state of residence (%) - American Indian and Alaska Native
Place of birth - Born in state of residence (%) - Multirace
Place of birth - Born in state of residence (%) - Other Race
Place of birth - Born in other state (%)
Place of birth - Born in other state (%) - White
Place of birth - Born in other state (%) - Black or African American
Place of birth - Born in other state (%) - Asian
Place of birth - Born in other state (%) - Hispanic or Latino
Place of birth - Born in other state (%) - American Indian and Alaska Native
Place of birth - Born in other state (%) - Multirace
Place of birth - Born in other state (%) - Other Race
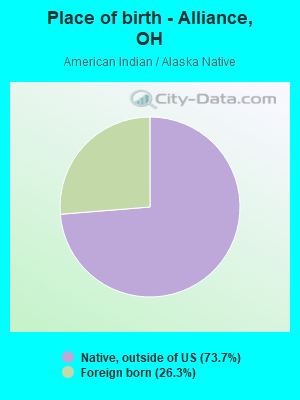
Place of birth - Native, outside of US (%)
Place of birth - Native, outside of US (%) - White
Place of birth - Native, outside of US (%) - Black or African American
Place of birth - Native, outside of US (%) - Asian
Place of birth - Native, outside of US (%) - Hispanic or Latino
Place of birth - Native, outside of US (%) - American Indian and Alaska Native
Place of birth - Native, outside of US (%) - Multirace
Place of birth - Native, outside of US (%) - Other Race
Place of birth - Foreign born (%)
Place of birth - Foreign born (%) - White
Place of birth - Foreign born (%) - Black or African American
Place of birth - Foreign born (%) - Asian
Place of birth - Foreign born (%) - Hispanic or Latino
Place of birth - Foreign born (%) - American Indian and Alaska Native
Place of birth - Foreign born (%) - Multirace
Place of birth - Foreign born (%) - Other Race
Residents speaking English at home (%)
Residents speaking English at home - Born in the United States (%)
Residents speaking English at home - Native, born elsewhere (%)
Residents speaking English at home - Foreign born (%)
Residents speaking Spanish at home (%)
Residents speaking Spanish at home - Born in the United States (%)
Residents speaking Spanish at home - Native, born elsewhere (%)
Residents speaking Spanish at home - Foreign born (%)
Residents speaking other language at home (%)
Residents speaking other language at home - Born in the United States (%)
Residents speaking other language at home - Native, born elsewhere (%)
Residents speaking other language at home - Foreign born (%)
Marital status - Never married (%)
Marital status - Now married (%)
Marital status - Separated (%)
Marital status - Widowed (%)
Marital status - Divorced (%)
Ancestries Reported - Arab (%)
Ancestries Reported - Czech (%)
Ancestries Reported - Danish (%)
Ancestries Reported - Dutch (%)
Ancestries Reported - English (%)
Ancestries Reported - French (%)
Ancestries Reported - French Canadian (%)
Ancestries Reported - German (%)
Ancestries Reported - Greek (%)
Ancestries Reported - Hungarian (%)
Ancestries Reported - Irish (%)
Ancestries Reported - Italian (%)
Ancestries Reported - Lithuanian (%)
Ancestries Reported - Norwegian (%)
Ancestries Reported - Polish (%)
Ancestries Reported - Portuguese (%)
Ancestries Reported - Russian (%)
Ancestries Reported - Scotch-Irish (%)
Ancestries Reported - Scottish (%)
Ancestries Reported - Slovak (%)
Ancestries Reported - Subsaharan African (%)
Ancestries Reported - Swedish (%)
Ancestries Reported - Swiss (%)
Ancestries Reported - Ukrainian (%)
Ancestries Reported - United States (%)
Ancestries Reported - Welsh (%)
Ancestries Reported - West Indian (%)
Ancestries Reported - Other (%)
Geographical mobility - Same house 1 year ago (%)
Geographical mobility - Same house 1 year ago (%) - White
Geographical mobility - Same house 1 year ago (%) - Black or African American
Geographical mobility - Same house 1 year ago (%) - Asian
Geographical mobility - Same house 1 year ago (%) - Hispanic or Latino
Geographical mobility - Same house 1 year ago (%) - American Indian and Alaska Native
Geographical mobility - Same house 1 year ago (%) - Multirace
Geographical mobility - Same house 1 year ago (%) - Other Race
Geographical mobility - Moved within same county (%)
Geographical mobility - Moved within same county (%) - White
Geographical mobility - Moved within same county (%) - Black or African American
Geographical mobility - Moved within same county (%) - Asian
Geographical mobility - Moved within same county (%) - Hispanic or Latino
Geographical mobility - Moved within same county (%) - American Indian and Alaska Native
Geographical mobility - Moved within same county (%) - Multirace
Geographical mobility - Moved within same county (%) - Other Race
Geographical mobility - Moved from different county within same state (%)
Geographical mobility - Moved from different county within same state (%) - White
Geographical mobility - Moved from different county within same state (%) - Black or African American
Geographical mobility - Moved from different county within same state (%) - Asian
Geographical mobility - Moved from different county within same state (%) - Hispanic or Latino
Geographical mobility - Moved from different county within same state (%) - American Indian and Alaska Native
Geographical mobility - Moved from different county within same state (%) - Multirace
Geographical mobility - Moved from different county within same state (%) - Other Race
Geographical mobility - Moved from different state (%)
Geographical mobility - Moved from different state (%) - White
Geographical mobility - Moved from different state (%) - Black or African American
Geographical mobility - Moved from different state (%) - Asian
Geographical mobility - Moved from different state (%) - Hispanic or Latino
Geographical mobility - Moved from different state (%) - American Indian and Alaska Native
Geographical mobility - Moved from different state (%) - Multirace
Geographical mobility - Moved from different state (%) - Other Race
Geographical mobility - Moved from abroad (%)
Geographical mobility - Moved from abroad (%) - White
Geographical mobility - Moved from abroad (%) - Black or African American
Geographical mobility - Moved from abroad (%) - Asian
Geographical mobility - Moved from abroad (%) - Hispanic or Latino
Geographical mobility - Moved from abroad (%) - American Indian and Alaska Native
Geographical mobility - Moved from abroad (%) - Multirace
Geographical mobility - Moved from abroad (%) - Other Race
Place of birth for the foreign-born population - Ireland (%)
Place of birth for the foreign-born population - Denmark (%)
Place of birth for the foreign-born population - Norway (%)
Place of birth for the foreign-born population - Sweden (%)
Place of birth for the foreign-born population - United Kingdom (%)
Place of birth for the foreign-born population - England (%)
Place of birth for the foreign-born population - Scotland (%)
Place of birth for the foreign-born population - Other Northern Europe (%)
Place of birth for the foreign-born population - Austria (%)
Place of birth for the foreign-born population - Belgium (%)
Place of birth for the foreign-born population - France (%)
Place of birth for the foreign-born population - Germany (%)
Place of birth for the foreign-born population - Netherlands (%)
Place of birth for the foreign-born population - Switzerland (%)
Place of birth for the foreign-born population - Other Western Europe (%)
Place of birth for the foreign-born population - Greece (%)
Place of birth for the foreign-born population - Italy (%)
Place of birth for the foreign-born population - Portugal (%)
Place of birth for the foreign-born population - Spain (%)
Place of birth for the foreign-born population - Other Southern Europe (%)
Place of birth for the foreign-born population - Albania (%)
Place of birth for the foreign-born population - Belarus (%)
Place of birth for the foreign-born population - Bosnia and Herzegovina (%)
Place of birth for the foreign-born population - Bulgaria (%)
Place of birth for the foreign-born population - Croatia (%)
Place of birth for the foreign-born population - Czechoslovakia (%)
Place of birth for the foreign-born population - Hungary (%)
Place of birth for the foreign-born population - Latvia (%)
Place of birth for the foreign-born population - Lithuania (%)
Place of birth for the foreign-born population - North Macedonia (Macedonia) (%)
Place of birth for the foreign-born population - Moldova (%)
Place of birth for the foreign-born population - Poland (%)
Place of birth for the foreign-born population - Romania (%)
Place of birth for the foreign-born population - Russia (%)
Place of birth for the foreign-born population - Serbia (%)
Place of birth for the foreign-born population - Ukraine (%)
Place of birth for the foreign-born population - Other Eastern Europe (%)
Place of birth for the foreign-born population - China (%)
Place of birth for the foreign-born population - Hong Kong (%)
Place of birth for the foreign-born population - Taiwan (%)
Place of birth for the foreign-born population - Japan (%)
Place of birth for the foreign-born population - Korea (%)
Place of birth for the foreign-born population - Other Eastern Asia (%)
Place of birth for the foreign-born population - Afghanistan (%)
Place of birth for the foreign-born population - Bangladesh (%)
Place of birth for the foreign-born population - India (%)
Place of birth for the foreign-born population - Iran (%)
Place of birth for the foreign-born population - Kazakhstan (%)
Place of birth for the foreign-born population - Nepal (%)
Place of birth for the foreign-born population - Pakistan (%)
Place of birth for the foreign-born population - Sri Lanka (%)
Place of birth for the foreign-born population - Uzbekistan (%)
Place of birth for the foreign-born population - Other South Central Asia (%)
Place of birth for the foreign-born population - Burma (%)
Place of birth for the foreign-born population - Cambodia (%)
Place of birth for the foreign-born population - Indonesia (%)
Place of birth for the foreign-born population - Laos (%)
Place of birth for the foreign-born population - Malaysia (%)
Place of birth for the foreign-born population - Philippines (%)
Place of birth for the foreign-born population - Singapore (%)
Place of birth for the foreign-born population - Thailand (%)
Place of birth for the foreign-born population - Vietnam (%)
Place of birth for the foreign-born population - Other South Eastern Asia (%)
Place of birth for the foreign-born population - Armenia (%)
Place of birth for the foreign-born population - Iraq (%)
Place of birth for the foreign-born population - Israel (%)
Place of birth for the foreign-born population - Jordan (%)
Place of birth for the foreign-born population - Kuwait (%)
Place of birth for the foreign-born population - Lebanon (%)
Place of birth for the foreign-born population - Saudi Arabia (%)
Place of birth for the foreign-born population - Syria (%)
Place of birth for the foreign-born population - Turkey (%)
Place of birth for the foreign-born population - Yemen (%)
Place of birth for the foreign-born population - Other Western Asia (%)
Place of birth for the foreign-born population - Eritrea (%)
Place of birth for the foreign-born population - Ethiopia (%)
Place of birth for the foreign-born population - Kenya (%)
Place of birth for the foreign-born population - Somalia (%)
Place of birth for the foreign-born population - Uganda (%)
Place of birth for the foreign-born population - Zimbabwe (%)
Place of birth for the foreign-born population - Other Eastern Africa (%)
Place of birth for the foreign-born population - Cameroon (%)
Place of birth for the foreign-born population - Congo (%)
Place of birth for the foreign-born population - Democratic Republic of Congo (Zaire) (%)
Place of birth for the foreign-born population - Other Middle Africa (%)
Place of birth for the foreign-born population - Egypt (%)
Place of birth for the foreign-born population - Morocco (%)
Place of birth for the foreign-born population - Sudan (%)
Place of birth for the foreign-born population - Other Northern Africa (%)
Place of birth for the foreign-born population - South Africa (%)
Place of birth for the foreign-born population - Other Southern Africa (%)
Place of birth for the foreign-born population - Cabo Verde (%)
Place of birth for the foreign-born population - Ghana (%)
Place of birth for the foreign-born population - Liberia (%)
Place of birth for the foreign-born population - Nigeria (%)
Place of birth for the foreign-born population - Senegal (%)
Place of birth for the foreign-born population - Sierra Leone (%)
Place of birth for the foreign-born population - Other Western Africa (%)
Place of birth for the foreign-born population - Australia (%)
Place of birth for the foreign-born population - New Zealand (%)
Place of birth for the foreign-born population - Fiji (%)
Place of birth for the foreign-born population - Micronesia (%)
Place of birth for the foreign-born population - Bahamas (%)
Place of birth for the foreign-born population - Barbados (%)
Place of birth for the foreign-born population - Cuba (%)
Place of birth for the foreign-born population - Dominica (%)
Place of birth for the foreign-born population - Dominican Republic (%)
Place of birth for the foreign-born population - Grenada (%)
Place of birth for the foreign-born population - Haiti (%)
Place of birth for the foreign-born population - Jamaica (%)
Place of birth for the foreign-born population - St. Vincent and the Grenadines (%)
Place of birth for the foreign-born population - Trinidad and Tobago (%)
Place of birth for the foreign-born population - West Indies (%)
Place of birth for the foreign-born population - Other Caribbean (%)
Place of birth for the foreign-born population - Belize (%)
Place of birth for the foreign-born population - Costa Rica (%)
Place of birth for the foreign-born population - El Salvador (%)
Place of birth for the foreign-born population - Guatemala (%)
Place of birth for the foreign-born population - Honduras (%)
Place of birth for the foreign-born population - Mexico (%)
Place of birth for the foreign-born population - Nicaragua (%)
Place of birth for the foreign-born population - Panama (%)
Place of birth for the foreign-born population - Other Central America (%)
Place of birth for the foreign-born population - Argentina (%)
Place of birth for the foreign-born population - Bolivia (%)
Place of birth for the foreign-born population - Brazil (%)
Place of birth for the foreign-born population - Chile (%)
Place of birth for the foreign-born population - Colombia (%)
Place of birth for the foreign-born population - Ecuador (%)
Place of birth for the foreign-born population - Guyana (%)
Place of birth for the foreign-born population - Peru (%)
Place of birth for the foreign-born population - Uruguay (%)
Place of birth for the foreign-born population - Venezuela (%)
Place of birth for the foreign-born population - Other South America (%)
Place of birth for the foreign-born population - Canada (%)
Place of birth for the foreign-born population - Other Northern America (%)
Place of birth for the foreign-born population - Other (%)
Latest news about races in Alliance, OH collected exclusively by city-data.com from local newspapers, TV, and radio stations
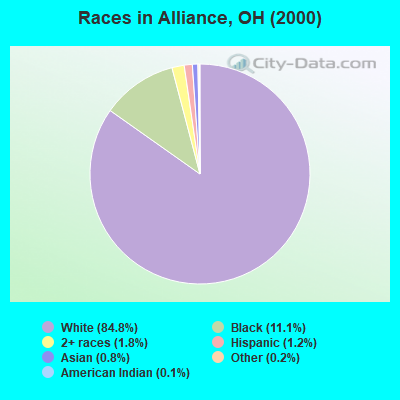
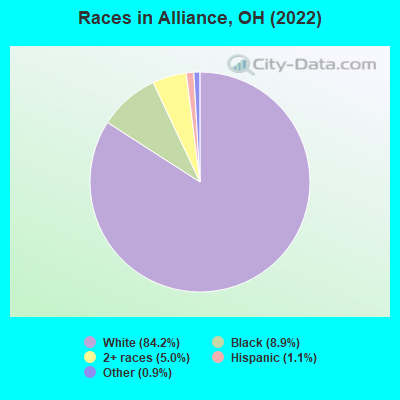
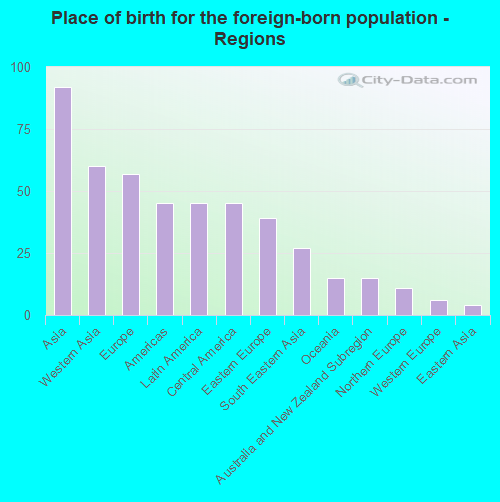
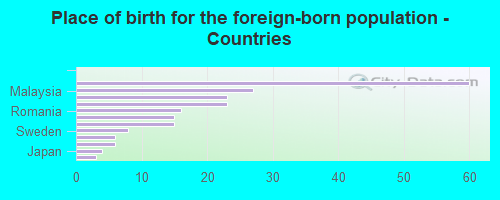
According to 2022 data, the most numerous races in Alliance, OH are White alone (18,107 residents), Black alone (1,923 residents), and Two or more races (1,065 residents). 98.8% of Alliance residents speak English at home. 1.0% of Alliance, OH residents are foreign-born , which is 311.8% less than the foreign-born rate of 4.0% across the entire state of Ohio.
Race distribution in Alliance
2000 2022
9,538,111 84.0% White alone 1,290,662 11.4% Black alone 217,123 1.9% Hispanic 137,770 1.2% Two or more races 131,670 1.2% Asian alone 21,985 0.2% American Indian alone 13,483 0.1% Other race alone 2,336 0.02% Native Hawaiian and Other
8,948,793 76.1% White alone 1,401,403 11.9% Black alone 529,291 4.5% Two or more races 517,232 4.4% Hispanic 293,387 2.5% Asian alone 52,805 0.4% Other race alone 9,785 0.08% American Indian alone 3,362 0.03% Native Hawaiian and Other
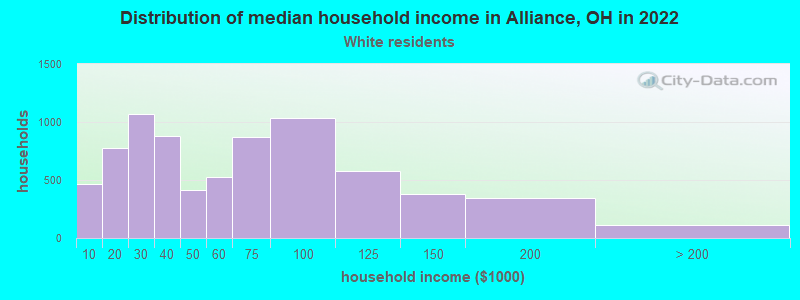
Income and house value in Alliance Median household income in 2022 $52,676 White non-Hispanic householders$44,386 Black householders$58,059 Two or more races householders$98,875 Hispanic or Latino race householdersMedian 2022 house value $117,341 White Non-Hispanic householders$74,585 Black or African American householders$73,951 Some other race householders$43,547 Two or more races householders$74,901 Hispanic or Latino householders
Median age by race in Alliance
38.9 Median age for White residents35.6 40.9 35.6 Median age for Black or African American residents30.0 39.8 30.5 Median age for American Indian / Alaska Native residents-864,561,402.6 21.8 -557,755,775.0 Median age for Asian residents-544,855,966.5 -643,216,079.8 -666,666,666.0 Median age for Native Hawaiian / Pacific Islander residents-666,666,666.0 -666,666,666.0 26.0 Median age for Other race residents26.6 3.2 21.5 Median age for Two or more races residents17.3 25.9 38.9 Median age for White alone residents35.6 40.9 24.4 Median age for Hispanic or Latino residents20.1 43.3
Owner/renter occupied households by race in Alliance
House owners and renters - White residents 3,686 49.7% Owner occupied3,733 50.3% Renter occupiedHouse owners and renters - Black or African American residents 231 41.4% Owner occupied327 58.6% Renter occupiedHouse owners and renters - American Indian / Alaska Native residents 8 100.0% Owner occupiedHouse owners and renters - Other race residents 4 5.8% Owner occupied65 94.2% Renter occupiedHouse owners and renters - Two or more races residents 55 21.9% Owner occupied194 78.1% Renter occupiedHouse owners and renters - White alone residents 3,684 49.7% Owner occupied3,735 50.3% Renter occupiedHouse owners and renters - Hispanic or Latino residents 11 16.8% Owner occupied53 83.2% Renter occupied
Language usage in Alliance
English speakers - Total 98.8% of residents of Alliance speak English at home.
0.5% of residents speak Spanish at home 63 58.9% Speak English very well44 41.1% Speak English less than very well0.9% of residents speak other language at home 141 80.6% Speak English very well34 19.4% Speak English less than very well
All residents speak only English at home
English speakers - Native, born elsewhere 61.5% of residents of Alliance speak English at home.
27.3% of residents speak Spanish at home 51 100.0% Speak English very well3.2% of residents speak other language at home 6 100.0% Speak English very well
English speakers - Foreign-born 54.9% of residents of Alliance speak English at home.
11.9% of residents speak Spanish at home 14 60.9% Speak English very well9 39.1% Speak English less than very well24.4% of residents speak other language at home 12 25.5% Speak English very well35 74.5% Speak English less than very well
White (Caucasian) - Speak only English Native:
99.3% (16,764)Foreign-born:
27.9% (30)
White (Caucasian) - Speak another language Native:
0.7% (126)Foreign-born:
74.9% (80)
American Indian / Alaska Native - Speak another language Native:
100.0% (47)Foreign-born:
96.6% (21)
Two or more races - Speak only English Native:
96.9% (1,065)Foreign-born:
84.8% (104)
White alone - Speak only English Native:
99.2% (16,695)Foreign-born:
29.9% (25)
White alone - Speak another language Native:
0.8% (135)Foreign-born:
74.9% (63)
Hispanic or Latino - Speak only English Native:
90.3% (209)Foreign-born:
24.5% (6)
Hispanic or Latino - Speak another language Native:
11.6% (27)Foreign-born:
98.4% (24)
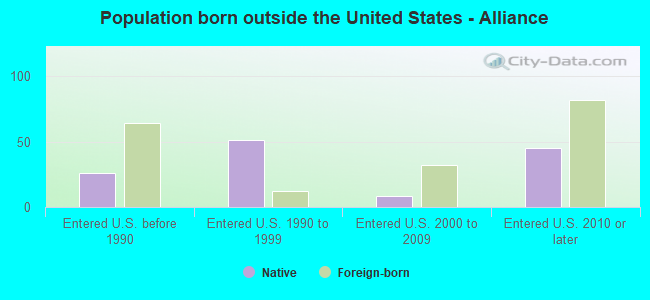
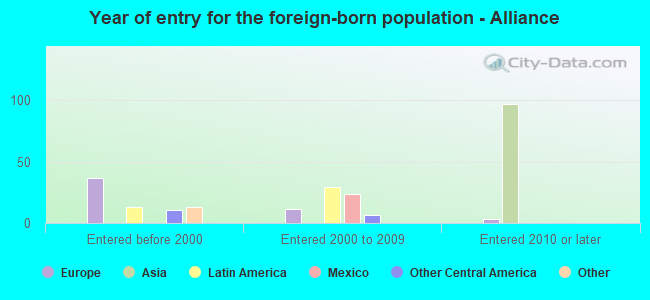
Foreign-born residents in Alliance 209 residents are foreign born
Marital status for residents in Alliance Marital status - White (Caucasian) population 15 years and over
Males 42.2% Never married37.8% Now married2.6% Separated2.1% Widowed15.2% DivorcedFemales 33.2% Never married35.2% Now married1.1% Separated11.6% Widowed19.0% DivorcedWomen who gave birth in the past 12 months Now married:
20.3% (60)Unmarried:
79.7% (234)
Women who did not give birth in the past 12 months Now married:
30.0% (1,076)Unmarried:
70.0% (2,508)
Marital status - Black or African American population 15 years and over
Males 65.5% Never married10.5% Now married5.1% Separated0.0% Widowed18.9% DivorcedFemales 47.2% Never married9.2% Now married0.7% Separated13.9% Widowed28.9% DivorcedWomen who did not give birth in the past 12 months Now married:
6.9% (27)Unmarried:
93.1% (369)
Marital status - American Indian / Alaska Native population 15 years and over
Males 0.0% Never married100.0% Now married0.0% Separated0.0% Widowed0.0% DivorcedFemales 84.8% Never married15.2% Now married0.0% Separated0.0% Widowed0.0% DivorcedWomen who did not give birth in the past 12 months Now married:
0.0% (0)Unmarried:
100.0% (48)
Marital status - Other race population 15 years and over
Males 91.1% Never married0.0% Now married0.0% Separated0.0% Widowed8.9% DivorcedFemales 0.0% Never married0.0% Now married0.0% Separated0.0% Widowed100.0% DivorcedMarital status - Two or more races population 15 years and over
Males 72.8% Never married27.2% Now married0.0% Separated0.0% Widowed0.0% DivorcedFemales 54.6% Never married37.2% Now married6.0% Separated0.0% Widowed2.2% DivorcedWomen who did not give birth in the past 12 months Now married:
38.8% (152)Unmarried:
61.2% (239)
Marital status - White alone, not Hispanic / Latino population 15 years and over
Males 42.1% Never married37.9% Now married2.7% Separated2.1% Widowed15.2% DivorcedFemales 33.1% Never married35.4% Now married1.1% Separated11.7% Widowed18.8% DivorcedWomen who gave birth in the past 12 months Now married:
20.3% (60)Unmarried:
79.7% (233)
Women who did not give birth in the past 12 months Now married:
30.2% (1,074)Unmarried:
69.8% (2,483)
Marital status - Hispanic or Latino population 15 years and over
Males 92.2% Never married7.8% Now married0.0% Separated0.0% Widowed0.0% DivorcedFemales 64.2% Never married6.6% Now married0.0% Separated0.0% Widowed29.2% DivorcedWomen who did not give birth in the past 12 months Now married:
0.0% (0)Unmarried:
100.0% (81)
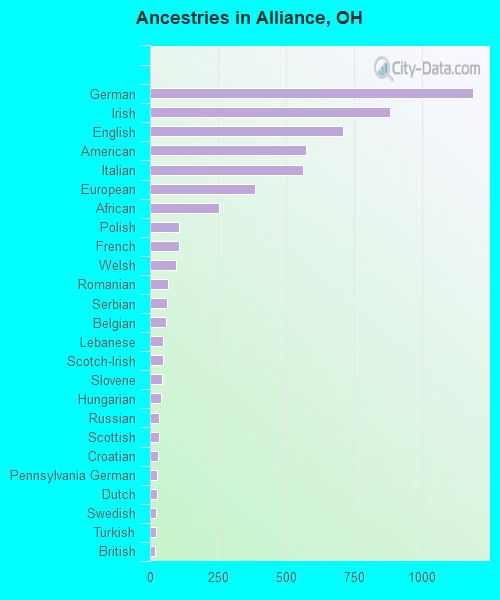
Ancestries in Alliance
1,187 15.8% German883 11.7% Irish710 9.4% English575 7.7% American564 7.5% Italian385 5.1% European252 3.4% African107 1.4% Polish105 1.4% French95 1.3% Welsh66 0.9% Romanian61 0.8% Serbian57 0.8% Belgian49 0.7% Lebanese49 0.7% Scotch-Irish44 0.6% Slovene39 0.5% Hungarian34 0.5% Russian32 0.4% Scottish30 0.4% Croatian26 0.3% Pennsylvania German24 0.3% Dutch22 0.3% Swedish21 0.3% Turkish20 0.3% British13 0.2% Swiss11 0.1% Greek11 0.1% Scandinavian10 0.1% Slovak3 0.04% Finnish1 0.01% Czech1 0.01% Eastern European
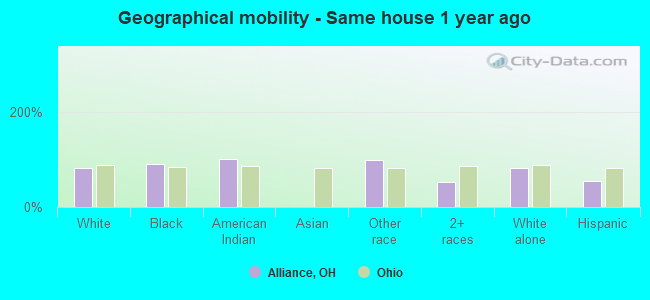
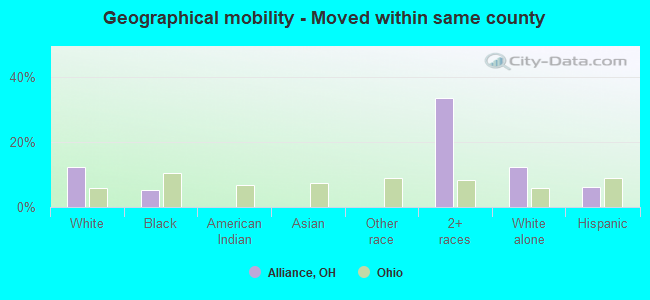
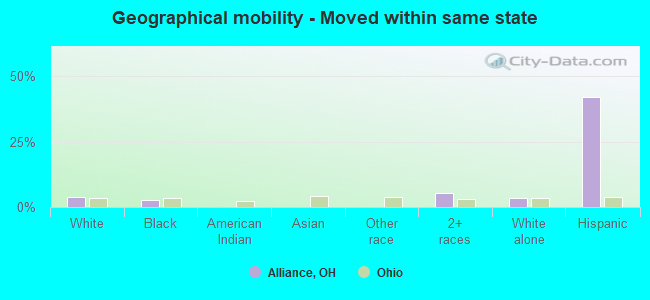
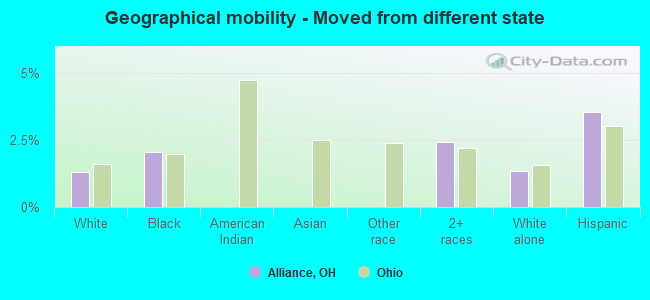
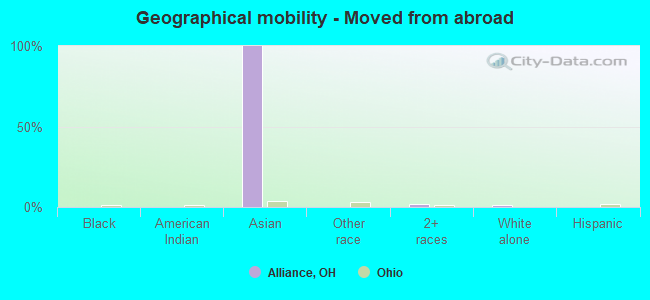
Geographical mobility in Alliance Same house 1 year ago 14,529 80.5% White (Caucasian)1,735 91.3% Black or African American71 100.0% American Indian / Alaska Native210 98.6% Other race616 53.1% Two or more races14,528 80.7% White alone, not Hispanic / Latino123 54.4% Hispanic or LatinoMoved within same county 2,214 12.3% White / Caucasian100 5.3% Black or African American389 33.6% Two or more races2,226 12.4% White alone, not Hispanic / Latino14 6.1% Hispanic or LatinoMoved within same state 681 3.8% White / Caucasian53 2.8% Black or African American61 5.3% Two or more races627 3.5% White alone, not Hispanic / Latino95 42.0% Hispanic or LatinoMoved from different state 232 1.3% White / Caucasian39 2.1% Black or African American28 2.4% Two or more races238 1.3% White alone, not Hispanic / Latino8 3.5% Hispanic or LatinoMoved from abroad 87 0.5% White4 100.0% Asian27 2.3% Two or more races104 0.6% White alone, not Hispanic / Latino
Children Nativity (place of birth) in Alliance
Children under 6 years - Living with two parents Both parents native 548 100.0% NativeChildren under 6 years - Living with one parent Native parent 862 100.0% Native
Children 6 to 17 years - Living with two parents Both parents native 1,420 100.0% NativeOne native, one foreign-born parent 6 100.0% NativeChildren 6 to 17 years - Living with one parent Native parent 1,191 100.0% Native
Grandparents responsible for own grandchildren in Alliance
Grandparents (30 to 59 years) White / Caucasian 7 13.4% Responsible for grandchildren44 86.6% Not responsible for grandchildrenWhite alone, not Hispanic / Latino 7 12.9% Responsible for grandchildren46 87.1% Not responsible for grandchildrenGrandparents (60 years and over) White / Caucasian 21 15.7% Responsible for grandchildren111 84.3% Not responsible for grandchildrenWhite alone, not Hispanic / Latino 21 16.7% Responsible for grandchildren104 83.3% Not responsible for grandchildren