Races in Baldwin Harbor, New York (NY) Detailed Stats
Data:
Races - White alone (%)
Races - White alone (% change since 2000)
Races - Black alone (%)
Races - Black alone (% change since 2000)
Races - American Indian alone (%)
Races - American Indian alone (% change since 2000)
Races - Asian alone (%)
Races - Asian alone (% change since 2000)
Races - Hispanic (%)
Races - Hispanic (% change since 2000)
Races - Native Hawaiian and Other Pacific Islander alone (%)
Races - Native Hawaiian and Other Pacific Islander alone (% change since 2000)
Races - Two or more races(%)
Races - Two or more races(% change since 2000)
Races - Other race alone (%)
Races - Other race alone (% change since 2000)
Racial diversity
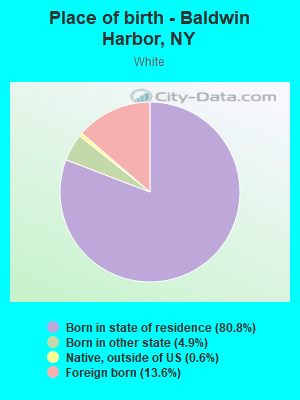
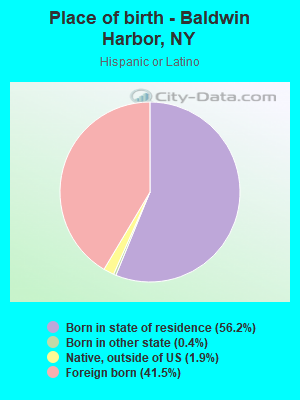
Place of birth - Born in state of residence (%)
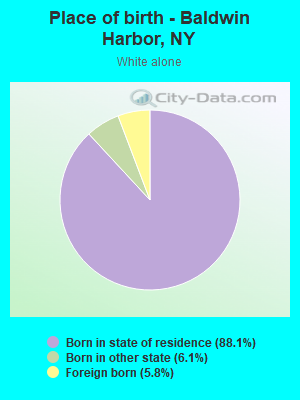
Place of birth - Born in state of residence (%) - White
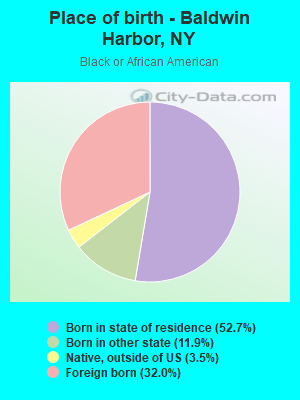
Place of birth - Born in state of residence (%) - Black or African American
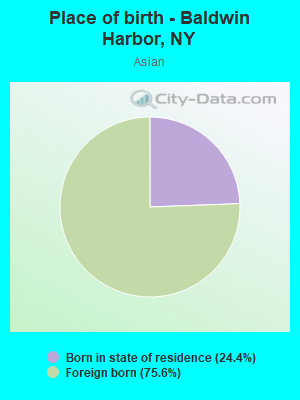
Place of birth - Born in state of residence (%) - Asian
Place of birth - Born in state of residence (%) - Hispanic or Latino
Place of birth - Born in state of residence (%) - American Indian and Alaska Native
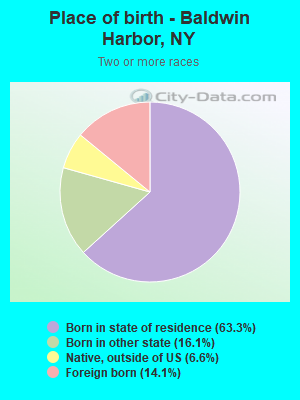
Place of birth - Born in state of residence (%) - Multirace
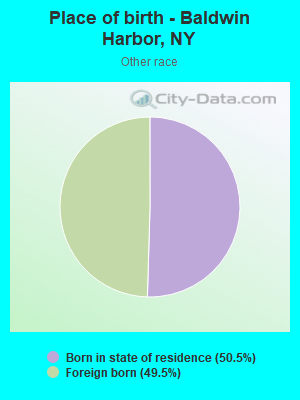
Place of birth - Born in state of residence (%) - Other Race
Place of birth - Born in other state (%)
Place of birth - Born in other state (%) - White
Place of birth - Born in other state (%) - Black or African American
Place of birth - Born in other state (%) - Asian
Place of birth - Born in other state (%) - Hispanic or Latino
Place of birth - Born in other state (%) - American Indian and Alaska Native
Place of birth - Born in other state (%) - Multirace
Place of birth - Born in other state (%) - Other Race
Place of birth - Native, outside of US (%)
Place of birth - Native, outside of US (%) - White
Place of birth - Native, outside of US (%) - Black or African American
Place of birth - Native, outside of US (%) - Asian
Place of birth - Native, outside of US (%) - Hispanic or Latino
Place of birth - Native, outside of US (%) - American Indian and Alaska Native
Place of birth - Native, outside of US (%) - Multirace
Place of birth - Native, outside of US (%) - Other Race
Place of birth - Foreign born (%)
Place of birth - Foreign born (%) - White
Place of birth - Foreign born (%) - Black or African American
Place of birth - Foreign born (%) - Asian
Place of birth - Foreign born (%) - Hispanic or Latino
Place of birth - Foreign born (%) - American Indian and Alaska Native
Place of birth - Foreign born (%) - Multirace
Place of birth - Foreign born (%) - Other Race
Residents speaking English at home (%)
Residents speaking English at home - Born in the United States (%)
Residents speaking English at home - Native, born elsewhere (%)
Residents speaking English at home - Foreign born (%)
Residents speaking Spanish at home (%)
Residents speaking Spanish at home - Born in the United States (%)
Residents speaking Spanish at home - Native, born elsewhere (%)
Residents speaking Spanish at home - Foreign born (%)
Residents speaking other language at home (%)
Residents speaking other language at home - Born in the United States (%)
Residents speaking other language at home - Native, born elsewhere (%)
Residents speaking other language at home - Foreign born (%)
Marital status - Never married (%)
Marital status - Now married (%)
Marital status - Separated (%)
Marital status - Widowed (%)
Marital status - Divorced (%)
Ancestries Reported - Arab (%)
Ancestries Reported - Czech (%)
Ancestries Reported - Danish (%)
Ancestries Reported - Dutch (%)
Ancestries Reported - English (%)
Ancestries Reported - French (%)
Ancestries Reported - French Canadian (%)
Ancestries Reported - German (%)
Ancestries Reported - Greek (%)
Ancestries Reported - Hungarian (%)
Ancestries Reported - Irish (%)
Ancestries Reported - Italian (%)
Ancestries Reported - Lithuanian (%)
Ancestries Reported - Norwegian (%)
Ancestries Reported - Polish (%)
Ancestries Reported - Portuguese (%)
Ancestries Reported - Russian (%)
Ancestries Reported - Scotch-Irish (%)
Ancestries Reported - Scottish (%)
Ancestries Reported - Slovak (%)
Ancestries Reported - Subsaharan African (%)
Ancestries Reported - Swedish (%)
Ancestries Reported - Swiss (%)
Ancestries Reported - Ukrainian (%)
Ancestries Reported - United States (%)
Ancestries Reported - Welsh (%)
Ancestries Reported - West Indian (%)
Ancestries Reported - Other (%)
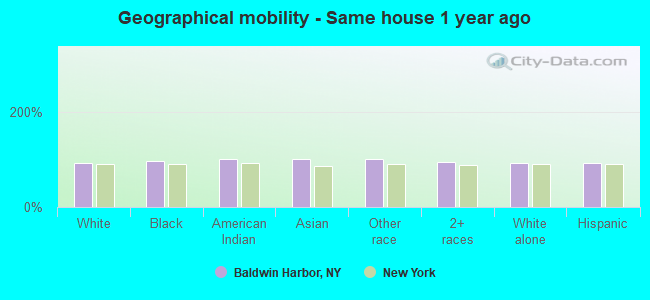
Geographical mobility - Same house 1 year ago (%)
Geographical mobility - Same house 1 year ago (%) - White
Geographical mobility - Same house 1 year ago (%) - Black or African American
Geographical mobility - Same house 1 year ago (%) - Asian
Geographical mobility - Same house 1 year ago (%) - Hispanic or Latino
Geographical mobility - Same house 1 year ago (%) - American Indian and Alaska Native
Geographical mobility - Same house 1 year ago (%) - Multirace
Geographical mobility - Same house 1 year ago (%) - Other Race
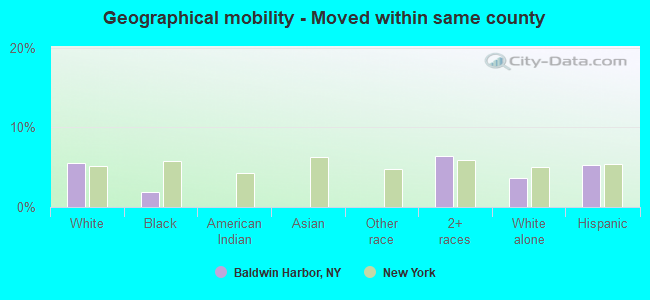
Geographical mobility - Moved within same county (%)
Geographical mobility - Moved within same county (%) - White
Geographical mobility - Moved within same county (%) - Black or African American
Geographical mobility - Moved within same county (%) - Asian
Geographical mobility - Moved within same county (%) - Hispanic or Latino
Geographical mobility - Moved within same county (%) - American Indian and Alaska Native
Geographical mobility - Moved within same county (%) - Multirace
Geographical mobility - Moved within same county (%) - Other Race
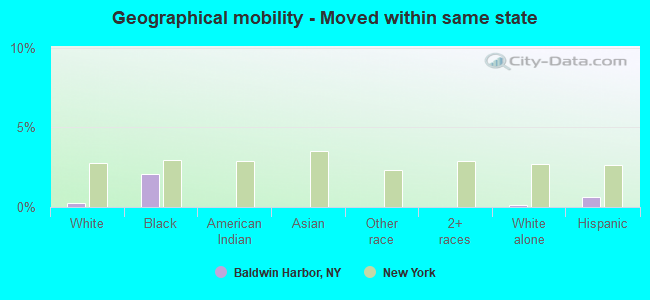
Geographical mobility - Moved from different county within same state (%)
Geographical mobility - Moved from different county within same state (%) - White
Geographical mobility - Moved from different county within same state (%) - Black or African American
Geographical mobility - Moved from different county within same state (%) - Asian
Geographical mobility - Moved from different county within same state (%) - Hispanic or Latino
Geographical mobility - Moved from different county within same state (%) - American Indian and Alaska Native
Geographical mobility - Moved from different county within same state (%) - Multirace
Geographical mobility - Moved from different county within same state (%) - Other Race
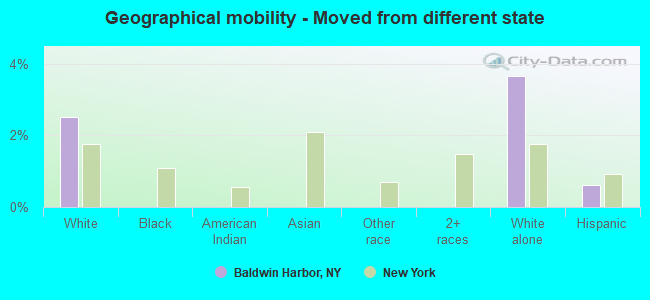
Geographical mobility - Moved from different state (%)
Geographical mobility - Moved from different state (%) - White
Geographical mobility - Moved from different state (%) - Black or African American
Geographical mobility - Moved from different state (%) - Asian
Geographical mobility - Moved from different state (%) - Hispanic or Latino
Geographical mobility - Moved from different state (%) - American Indian and Alaska Native
Geographical mobility - Moved from different state (%) - Multirace
Geographical mobility - Moved from different state (%) - Other Race
Geographical mobility - Moved from abroad (%)
Geographical mobility - Moved from abroad (%) - White
Geographical mobility - Moved from abroad (%) - Black or African American
Geographical mobility - Moved from abroad (%) - Asian
Geographical mobility - Moved from abroad (%) - Hispanic or Latino
Geographical mobility - Moved from abroad (%) - American Indian and Alaska Native
Geographical mobility - Moved from abroad (%) - Multirace
Geographical mobility - Moved from abroad (%) - Other Race
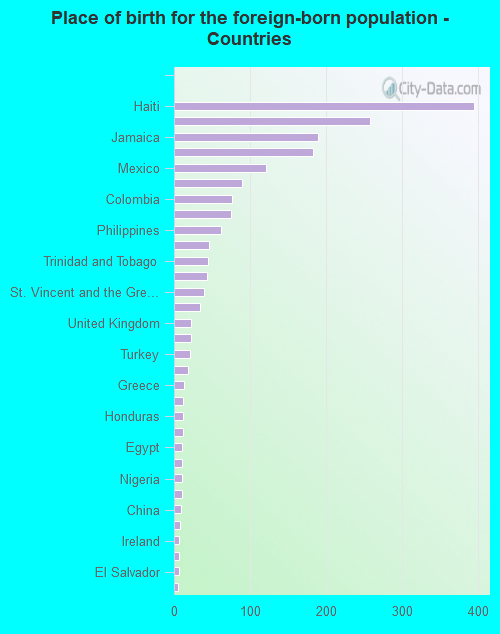
Place of birth for the foreign-born population - Ireland (%)
Place of birth for the foreign-born population - Denmark (%)
Place of birth for the foreign-born population - Norway (%)
Place of birth for the foreign-born population - Sweden (%)
Place of birth for the foreign-born population - United Kingdom (%)
Place of birth for the foreign-born population - England (%)
Place of birth for the foreign-born population - Scotland (%)
Place of birth for the foreign-born population - Other Northern Europe (%)
Place of birth for the foreign-born population - Austria (%)
Place of birth for the foreign-born population - Belgium (%)
Place of birth for the foreign-born population - France (%)
Place of birth for the foreign-born population - Germany (%)
Place of birth for the foreign-born population - Netherlands (%)
Place of birth for the foreign-born population - Switzerland (%)
Place of birth for the foreign-born population - Other Western Europe (%)
Place of birth for the foreign-born population - Greece (%)
Place of birth for the foreign-born population - Italy (%)
Place of birth for the foreign-born population - Portugal (%)
Place of birth for the foreign-born population - Spain (%)
Place of birth for the foreign-born population - Other Southern Europe (%)
Place of birth for the foreign-born population - Albania (%)
Place of birth for the foreign-born population - Belarus (%)
Place of birth for the foreign-born population - Bosnia and Herzegovina (%)
Place of birth for the foreign-born population - Bulgaria (%)
Place of birth for the foreign-born population - Croatia (%)
Place of birth for the foreign-born population - Czechoslovakia (%)
Place of birth for the foreign-born population - Hungary (%)
Place of birth for the foreign-born population - Latvia (%)
Place of birth for the foreign-born population - Lithuania (%)
Place of birth for the foreign-born population - North Macedonia (Macedonia) (%)
Place of birth for the foreign-born population - Moldova (%)
Place of birth for the foreign-born population - Poland (%)
Place of birth for the foreign-born population - Romania (%)
Place of birth for the foreign-born population - Russia (%)
Place of birth for the foreign-born population - Serbia (%)
Place of birth for the foreign-born population - Ukraine (%)
Place of birth for the foreign-born population - Other Eastern Europe (%)
Place of birth for the foreign-born population - China (%)
Place of birth for the foreign-born population - Hong Kong (%)
Place of birth for the foreign-born population - Taiwan (%)
Place of birth for the foreign-born population - Japan (%)
Place of birth for the foreign-born population - Korea (%)
Place of birth for the foreign-born population - Other Eastern Asia (%)
Place of birth for the foreign-born population - Afghanistan (%)
Place of birth for the foreign-born population - Bangladesh (%)
Place of birth for the foreign-born population - India (%)
Place of birth for the foreign-born population - Iran (%)
Place of birth for the foreign-born population - Kazakhstan (%)
Place of birth for the foreign-born population - Nepal (%)
Place of birth for the foreign-born population - Pakistan (%)
Place of birth for the foreign-born population - Sri Lanka (%)
Place of birth for the foreign-born population - Uzbekistan (%)
Place of birth for the foreign-born population - Other South Central Asia (%)
Place of birth for the foreign-born population - Burma (%)
Place of birth for the foreign-born population - Cambodia (%)
Place of birth for the foreign-born population - Indonesia (%)
Place of birth for the foreign-born population - Laos (%)
Place of birth for the foreign-born population - Malaysia (%)
Place of birth for the foreign-born population - Philippines (%)
Place of birth for the foreign-born population - Singapore (%)
Place of birth for the foreign-born population - Thailand (%)
Place of birth for the foreign-born population - Vietnam (%)
Place of birth for the foreign-born population - Other South Eastern Asia (%)
Place of birth for the foreign-born population - Armenia (%)
Place of birth for the foreign-born population - Iraq (%)
Place of birth for the foreign-born population - Israel (%)
Place of birth for the foreign-born population - Jordan (%)
Place of birth for the foreign-born population - Kuwait (%)
Place of birth for the foreign-born population - Lebanon (%)
Place of birth for the foreign-born population - Saudi Arabia (%)
Place of birth for the foreign-born population - Syria (%)
Place of birth for the foreign-born population - Turkey (%)
Place of birth for the foreign-born population - Yemen (%)
Place of birth for the foreign-born population - Other Western Asia (%)
Place of birth for the foreign-born population - Eritrea (%)
Place of birth for the foreign-born population - Ethiopia (%)
Place of birth for the foreign-born population - Kenya (%)
Place of birth for the foreign-born population - Somalia (%)
Place of birth for the foreign-born population - Uganda (%)
Place of birth for the foreign-born population - Zimbabwe (%)
Place of birth for the foreign-born population - Other Eastern Africa (%)
Place of birth for the foreign-born population - Cameroon (%)
Place of birth for the foreign-born population - Congo (%)
Place of birth for the foreign-born population - Democratic Republic of Congo (Zaire) (%)
Place of birth for the foreign-born population - Other Middle Africa (%)
Place of birth for the foreign-born population - Egypt (%)
Place of birth for the foreign-born population - Morocco (%)
Place of birth for the foreign-born population - Sudan (%)
Place of birth for the foreign-born population - Other Northern Africa (%)
Place of birth for the foreign-born population - South Africa (%)
Place of birth for the foreign-born population - Other Southern Africa (%)
Place of birth for the foreign-born population - Cabo Verde (%)
Place of birth for the foreign-born population - Ghana (%)
Place of birth for the foreign-born population - Liberia (%)
Place of birth for the foreign-born population - Nigeria (%)
Place of birth for the foreign-born population - Senegal (%)
Place of birth for the foreign-born population - Sierra Leone (%)
Place of birth for the foreign-born population - Other Western Africa (%)
Place of birth for the foreign-born population - Australia (%)
Place of birth for the foreign-born population - New Zealand (%)
Place of birth for the foreign-born population - Fiji (%)
Place of birth for the foreign-born population - Micronesia (%)
Place of birth for the foreign-born population - Bahamas (%)
Place of birth for the foreign-born population - Barbados (%)
Place of birth for the foreign-born population - Cuba (%)
Place of birth for the foreign-born population - Dominica (%)
Place of birth for the foreign-born population - Dominican Republic (%)
Place of birth for the foreign-born population - Grenada (%)
Place of birth for the foreign-born population - Haiti (%)
Place of birth for the foreign-born population - Jamaica (%)
Place of birth for the foreign-born population - St. Vincent and the Grenadines (%)
Place of birth for the foreign-born population - Trinidad and Tobago (%)
Place of birth for the foreign-born population - West Indies (%)
Place of birth for the foreign-born population - Other Caribbean (%)
Place of birth for the foreign-born population - Belize (%)
Place of birth for the foreign-born population - Costa Rica (%)
Place of birth for the foreign-born population - El Salvador (%)
Place of birth for the foreign-born population - Guatemala (%)
Place of birth for the foreign-born population - Honduras (%)
Place of birth for the foreign-born population - Mexico (%)
Place of birth for the foreign-born population - Nicaragua (%)
Place of birth for the foreign-born population - Panama (%)
Place of birth for the foreign-born population - Other Central America (%)
Place of birth for the foreign-born population - Argentina (%)
Place of birth for the foreign-born population - Bolivia (%)
Place of birth for the foreign-born population - Brazil (%)
Place of birth for the foreign-born population - Chile (%)
Place of birth for the foreign-born population - Colombia (%)
Place of birth for the foreign-born population - Ecuador (%)
Place of birth for the foreign-born population - Guyana (%)
Place of birth for the foreign-born population - Peru (%)
Place of birth for the foreign-born population - Uruguay (%)
Place of birth for the foreign-born population - Venezuela (%)
Place of birth for the foreign-born population - Other South America (%)
Place of birth for the foreign-born population - Canada (%)
Place of birth for the foreign-born population - Other Northern America (%)
Place of birth for the foreign-born population - Other (%)
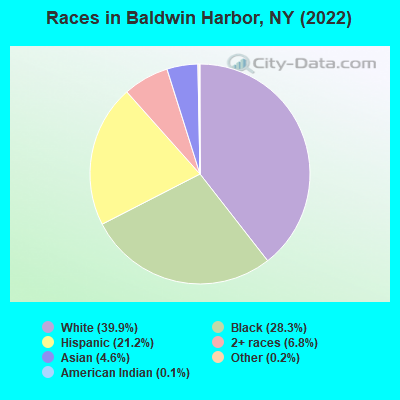
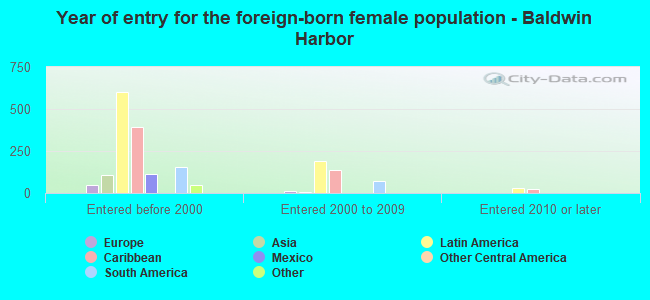
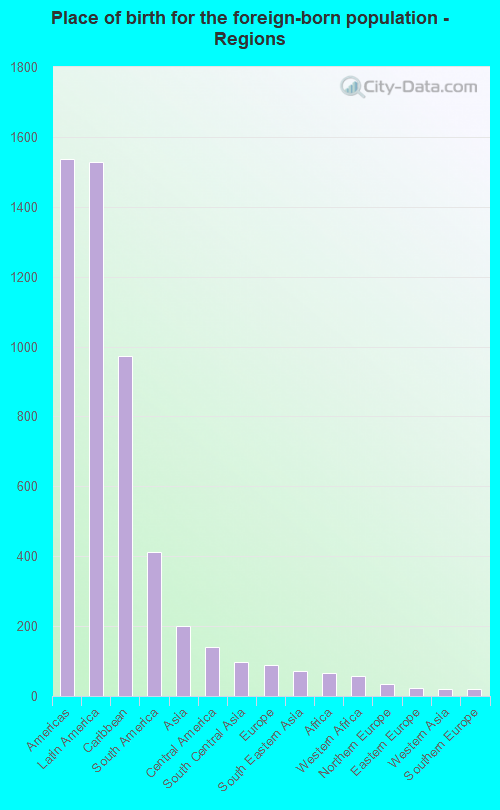
According to 2022 data, the most numerous races in Baldwin Harbor, NY are White alone (3,088 residents), Hispanic (1,642 residents), and Black alone (2,191 residents). 78.7% of Baldwin Harbor residents speak English at home. 24.3% of Baldwin Harbor, NY residents are foreign-born (19.4% born in Latin America, 2.5% born in Asia), which is 9.6% greater than the foreign-born rate of 22.0% across the entire state of New York.
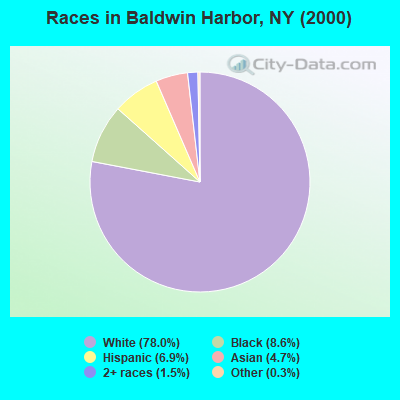
Race distribution in Baldwin Harbor
2000 2022
11,760,981 62.0% White alone 2,867,583 15.1% Hispanic 2,812,623 14.8% Black alone 1,035,926 5.5% Asian alone 366,116 1.9% Two or more races 75,499 0.4% Other race alone 52,499 0.3% American Indian alone 5,230 0.03% Native Hawaiian and Other
10,408,933 52.9% White alone 3,867,299 19.7% Hispanic 2,633,840 13.4% Black alone 1,776,286 9.0% Asian alone 732,670 3.7% Two or more races 216,110 1.1% Other race alone 35,082 0.2% American Indian alone 6,931 0.04% Native Hawaiian and Other
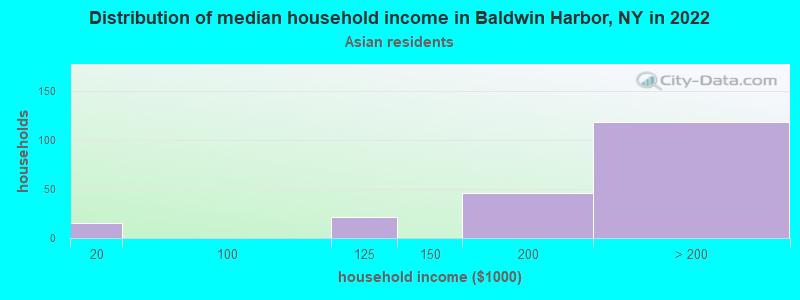
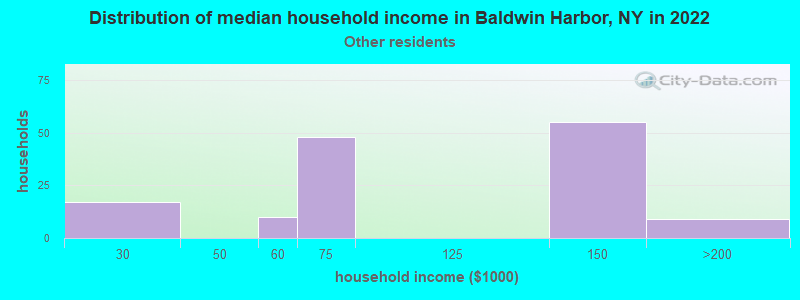
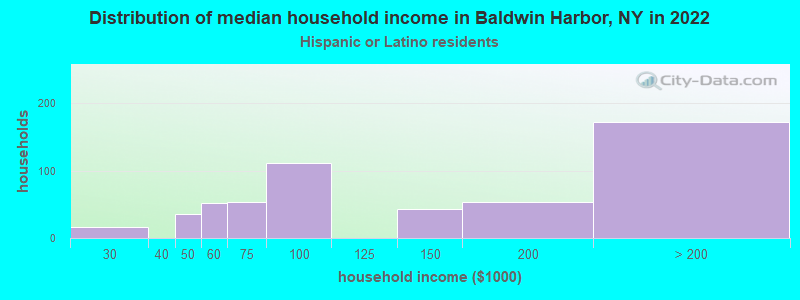
Income and house value in Baldwin Harbor Median household income in 2022 $135,097 White non-Hispanic householders$191,795 Black householdersover $200,000 Asian householders$93,040 Some other race householdersover $200,000 Two or more races householders$112,834 Hispanic or Latino race householdersMedian 2022 house value $619,989 White Non-Hispanic householders$773,965 Black or African American householders $684,577 Asian householders$579,111 Some other race householders$803,942 Two or more races householders$695,205 Hispanic or Latino householders
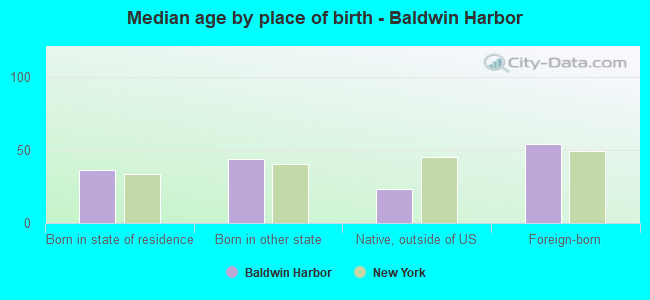
Median age by race in Baldwin Harbor
51.0 Median age for White residents47.8 53.2 38.7 Median age for Black or African American residents36.6 43.0 87.1 Median age for American Indian / Alaska Native residents49.9 Median age for Asian residents50.2 48.9 41.4 Median age for Other race residents43.6 23.2 43.5 Median age for Two or more races residents42.4 61.7 54.7 Median age for White alone residents52.1 56.3 37.5 Median age for Hispanic or Latino residents37.9 38.2
Owner/renter occupied households by race in Baldwin Harbor
House owners and renters - White residents 1,339 92.2% Owner occupied113 7.8% Renter occupiedHouse owners and renters - Black or African American residents 703 95.8% Owner occupied31 4.2% Renter occupiedHouse owners and renters - American Indian / Alaska Native residents 15 100.0% Owner occupiedHouse owners and renters - Asian residents 176 100.0% Owner occupiedHouse owners and renters - Other race residents 146 100.0% Owner occupiedHouse owners and renters - Two or more races residents 358 100.0% Owner occupiedHouse owners and renters - White alone residents 1,144 93.2% Owner occupied84 6.8% Renter occupiedHouse owners and renters - Hispanic or Latino residents 440 93.3% Owner occupied32 6.7% Renter occupied
Language usage in Baldwin Harbor
English speakers - Total 78.7% of residents of Baldwin Harbor speak English at home.
10.9% of residents speak Spanish at home 518 64.9% Speak English very well280 35.1% Speak English less than very well10.4% of residents speak other language at home 508 66.5% Speak English very well256 33.5% Speak English less than very well
English speakers - Born in the United States 98.2% of residents of Baldwin Harbor speak English at home.
1.2% of residents speak Spanish at home 6 100.0% Speak English very well
English speakers - Native, born elsewhere 82.7% of residents of Baldwin Harbor speak English at home.
22.8% of residents speak Spanish at home 28 96.6% Speak English very well1 3.4% Speak English less than very well
English speakers - Foreign-born 51.2% of residents of Baldwin Harbor speak English at home.
24.0% of residents speak Spanish at home 255 55.6% Speak English very well204 44.4% Speak English less than very well25.5% of residents speak other language at home 241 49.3% Speak English very well248 50.7% Speak English less than very well
White (Caucasian) - Speak only English Native:
91.1% (2,917)Foreign-born:
29.5% (155)
White (Caucasian) - Speak another language Native:
9.0% (288)Foreign-born:
71.1% (375)
Black or African American - Speak only English Native:
86.0% (1,177)Foreign-born:
75.9% (567)
Black or African American - Speak another language Native:
14.7% (201)Foreign-born:
24.6% (184)
Asian - Speak only English Native:
53.0% (51)Foreign-born:
37.2% (121)
Asian - Speak another language Native:
47.9% (46)Foreign-born:
53.7% (175)
Other race - Speak only English Native:
83.0% (143)Foreign-born:
44.8% (82)
Other race - Speak another language Native:
31.8% (55)Foreign-born:
66.4% (122)
Two or more races - Speak only English Native:
92.1% (640)Foreign-born:
35.7% (43)
White alone - Speak only English Native:
96.7% (2,705)Foreign-born:
34.2% (64)
White alone - Speak another language Native:
3.0% (83)Foreign-born:
65.8% (124)
Hispanic or Latino - Speak only English Native:
64.2% (518)Foreign-born:
29.3% (192)
Hispanic or Latino - Speak another language Native:
40.2% (324)Foreign-born:
71.9% (470)
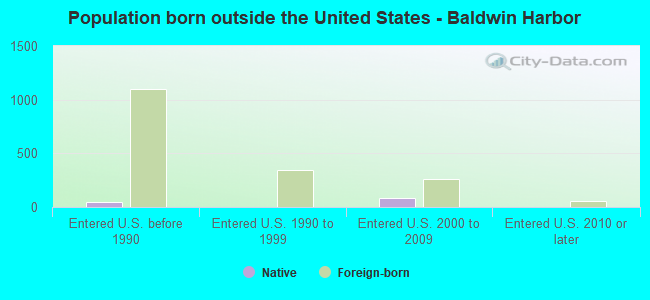
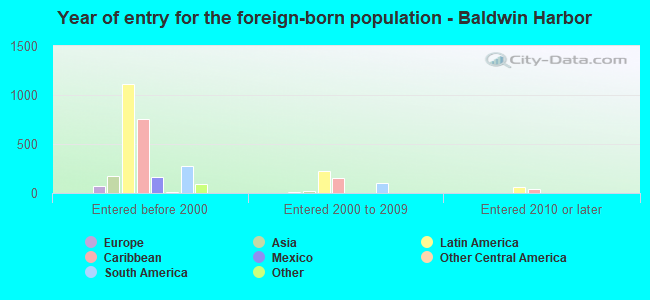
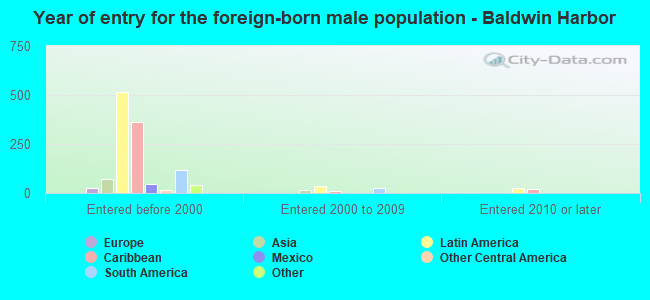
Foreign-born residents in Baldwin Harbor 1,895 residents are foreign born (19.4% Latin America , 2.5% Asia ).
This city:
24.3%New York:
100.0%
Marital status for residents in Baldwin Harbor Marital status - White (Caucasian) population 15 years and over
Males 32.7% Never married48.6% Now married5.4% Separated4.1% Widowed9.2% DivorcedFemales 26.5% Never married49.2% Now married2.9% Separated12.5% Widowed8.8% DivorcedWomen who gave birth in the past 12 months Now married:
100.0% (5)Unmarried:
0.0% (0)
Women who did not give birth in the past 12 months Now married:
36.7% (253)Unmarried:
63.3% (437)
Marital status - Black or African American population 15 years and over
Males 39.9% Never married54.2% Now married0.0% Separated0.0% Widowed5.9% DivorcedFemales 41.4% Never married48.5% Now married2.6% Separated1.3% Widowed6.2% DivorcedWomen who gave birth in the past 12 months Now married:
100.0% (96)Unmarried:
0.0% (0)
Women who did not give birth in the past 12 months Now married:
29.8% (142)Unmarried:
70.2% (334)
Marital status - Asian population 15 years and over
Males 22.1% Never married77.9% Now married0.0% Separated0.0% Widowed0.0% DivorcedFemales 20.4% Never married70.1% Now married0.0% Separated5.0% Widowed4.5% DivorcedWomen who did not give birth in the past 12 months Now married:
71.4% (111)Unmarried:
28.6% (45)
Marital status - Other race population 15 years and over
Males 0.0% Never married73.5% Now married26.5% Separated0.0% Widowed0.0% DivorcedFemales 34.1% Never married54.1% Now married0.0% Separated0.0% Widowed11.8% DivorcedWomen who did not give birth in the past 12 months Now married:
40.2% (37)Unmarried:
59.8% (55)
Marital status - Two or more races population 15 years and over
Males 59.9% Never married19.2% Now married0.0% Separated0.0% Widowed20.9% DivorcedFemales 25.5% Never married46.1% Now married0.0% Separated0.0% Widowed28.4% DivorcedWomen who gave birth in the past 12 months Now married:
100.0% (31)Unmarried:
0.0% (0)
Women who did not give birth in the past 12 months Now married:
45.8% (52)Unmarried:
54.2% (61)
Marital status - White alone, not Hispanic / Latino population 15 years and over
Males 33.2% Never married48.4% Now married4.8% Separated5.1% Widowed8.5% DivorcedFemales 24.0% Never married49.2% Now married1.2% Separated15.7% Widowed9.9% DivorcedWomen who did not give birth in the past 12 months Now married:
30.0% (137)Unmarried:
70.0% (320)
Marital status - Hispanic or Latino population 15 years and over
Males 23.1% Never married57.2% Now married11.0% Separated0.0% Widowed8.6% DivorcedFemales 34.5% Never married52.6% Now married6.0% Separated0.6% Widowed6.3% DivorcedWomen who gave birth in the past 12 months Now married:
100.0% (27)Unmarried:
0.0% (0)
Women who did not give birth in the past 12 months Now married:
48.3% (190)Unmarried:
51.7% (204)
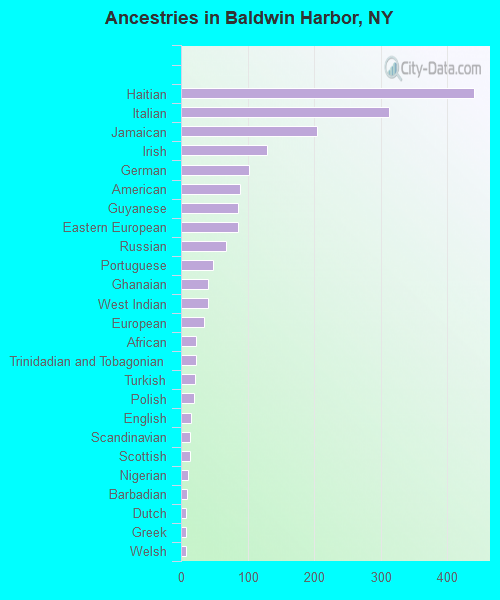
Ancestries in Baldwin Harbor
441 11.1% Haitian313 7.9% Italian205 5.2% Jamaican130 3.3% Irish102 2.6% German89 2.2% American86 2.2% Guyanese85 2.1% Eastern European68 1.7% Russian48 1.2% Portuguese41 1.0% Ghanaian41 1.0% West Indian34 0.9% European23 0.6% African22 0.6% Trinidadian and Tobagonian21 0.5% Turkish19 0.5% Polish15 0.4% English13 0.3% Scandinavian13 0.3% Scottish10 0.3% Nigerian9 0.2% Barbadian8 0.2% Dutch8 0.2% Greek8 0.2% Welsh7 0.2% French Canadian7 0.2% Iranian
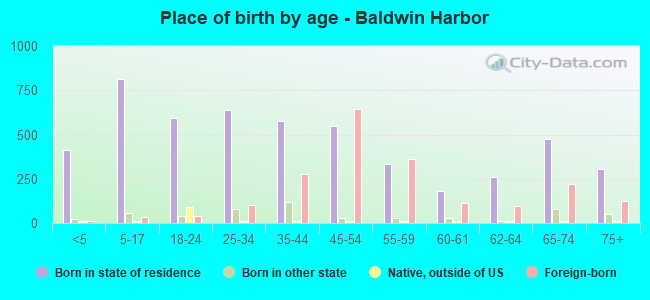
Children Nativity (place of birth) in Baldwin Harbor
Children under 6 years - Living with two parents Both parents native 155 100.0% NativeBoth parents foreign-born 69 100.0% NativeOne native, one foreign-born parent 119 100.0% NativeChildren under 6 years - Living with one parent Native parent 35 100.0% NativeForeign-born parent 74 100.0% NativeChildren 6 to 17 years - Living with two parents Both parents native 212 100.0% NativeBoth parents foreign-born 167 87.4% Native24 12.6% Foreign-bornOne native, one foreign-born parent 208 100.0% NativeChildren 6 to 17 years - Living with one parent Native parent 105 100.0% NativeForeign-born parent 114 52.7% Native103 47.3% Foreign-born
Grandparents responsible for own grandchildren in Baldwin Harbor
Grandparents (30 to 59 years) White / Caucasian 29 100.0% Responsible for grandchildrenWhite alone, not Hispanic / Latino 8 100.0% Responsible for grandchildrenHispanic or Latino 81 100.0% Responsible for grandchildrenGrandparents (60 years and over) White / Caucasian 8 9.6% Responsible for grandchildren73 90.4% Not responsible for grandchildrenWhite alone, not Hispanic / Latino 7 9.4% Responsible for grandchildren71 90.6% Not responsible for grandchildrenHispanic or Latino 40 100.0% Not responsible for grandchildren