Races in Bisbee, Arizona (AZ) Detailed Stats
Data:
Races - White alone (%)
Races - White alone (% change since 2000)
Races - Black alone (%)
Races - Black alone (% change since 2000)
Races - American Indian alone (%)
Races - American Indian alone (% change since 2000)
Races - Asian alone (%)
Races - Asian alone (% change since 2000)
Races - Hispanic (%)
Races - Hispanic (% change since 2000)
Races - Native Hawaiian and Other Pacific Islander alone (%)
Races - Native Hawaiian and Other Pacific Islander alone (% change since 2000)
Races - Two or more races(%)
Races - Two or more races(% change since 2000)
Races - Other race alone (%)
Races - Other race alone (% change since 2000)
Racial diversity
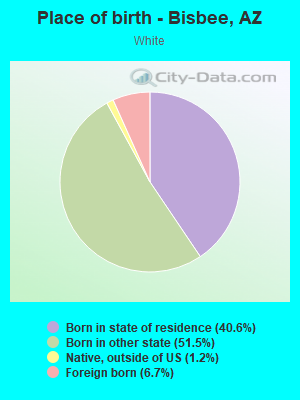
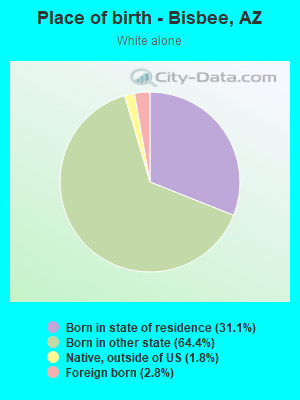
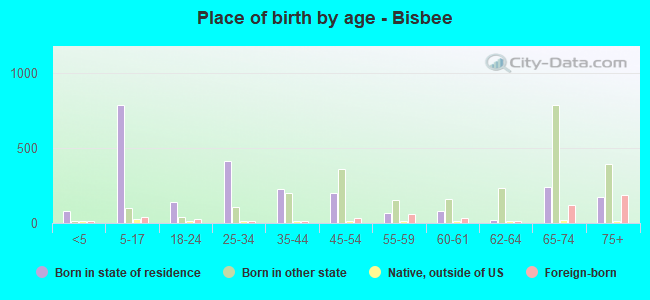
Place of birth - Born in state of residence (%)
Place of birth - Born in state of residence (%) - White
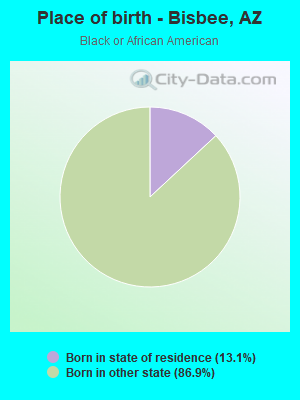
Place of birth - Born in state of residence (%) - Black or African American
Place of birth - Born in state of residence (%) - Asian
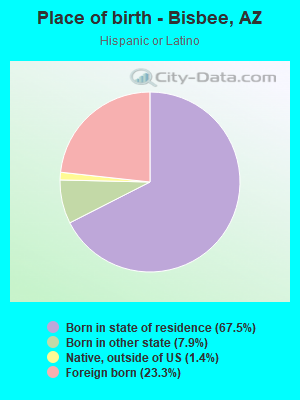
Place of birth - Born in state of residence (%) - Hispanic or Latino
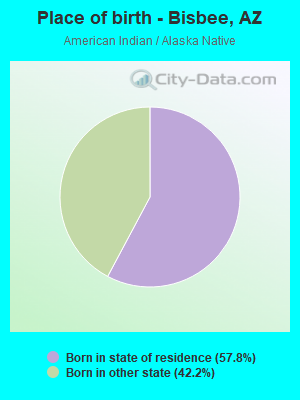
Place of birth - Born in state of residence (%) - American Indian and Alaska Native
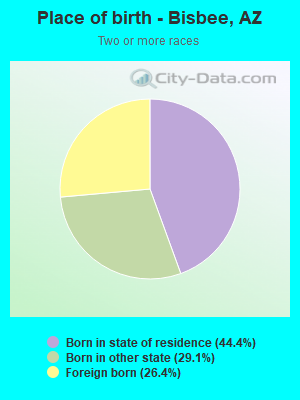
Place of birth - Born in state of residence (%) - Multirace
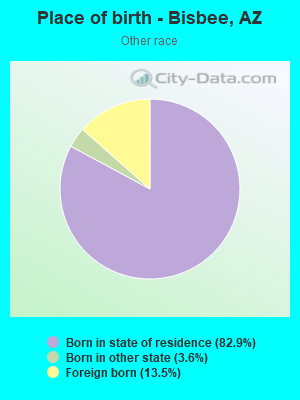
Place of birth - Born in state of residence (%) - Other Race
Place of birth - Born in other state (%)
Place of birth - Born in other state (%) - White
Place of birth - Born in other state (%) - Black or African American
Place of birth - Born in other state (%) - Asian
Place of birth - Born in other state (%) - Hispanic or Latino
Place of birth - Born in other state (%) - American Indian and Alaska Native
Place of birth - Born in other state (%) - Multirace
Place of birth - Born in other state (%) - Other Race
Place of birth - Native, outside of US (%)
Place of birth - Native, outside of US (%) - White
Place of birth - Native, outside of US (%) - Black or African American
Place of birth - Native, outside of US (%) - Asian
Place of birth - Native, outside of US (%) - Hispanic or Latino
Place of birth - Native, outside of US (%) - American Indian and Alaska Native
Place of birth - Native, outside of US (%) - Multirace
Place of birth - Native, outside of US (%) - Other Race
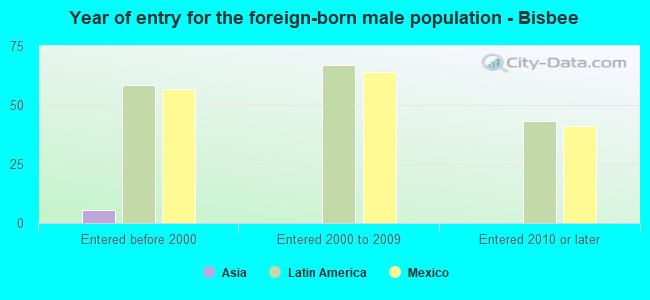
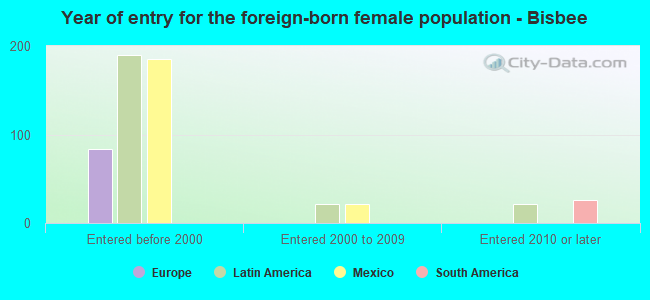
Place of birth - Foreign born (%)
Place of birth - Foreign born (%) - White
Place of birth - Foreign born (%) - Black or African American
Place of birth - Foreign born (%) - Asian
Place of birth - Foreign born (%) - Hispanic or Latino
Place of birth - Foreign born (%) - American Indian and Alaska Native
Place of birth - Foreign born (%) - Multirace
Place of birth - Foreign born (%) - Other Race
Residents speaking English at home (%)
Residents speaking English at home - Born in the United States (%)
Residents speaking English at home - Native, born elsewhere (%)
Residents speaking English at home - Foreign born (%)
Residents speaking Spanish at home (%)
Residents speaking Spanish at home - Born in the United States (%)
Residents speaking Spanish at home - Native, born elsewhere (%)
Residents speaking Spanish at home - Foreign born (%)
Residents speaking other language at home (%)
Residents speaking other language at home - Born in the United States (%)
Residents speaking other language at home - Native, born elsewhere (%)
Residents speaking other language at home - Foreign born (%)
Marital status - Never married (%)
Marital status - Now married (%)
Marital status - Separated (%)
Marital status - Widowed (%)
Marital status - Divorced (%)
Ancestries Reported - Arab (%)
Ancestries Reported - Czech (%)
Ancestries Reported - Danish (%)
Ancestries Reported - Dutch (%)
Ancestries Reported - English (%)
Ancestries Reported - French (%)
Ancestries Reported - French Canadian (%)
Ancestries Reported - German (%)
Ancestries Reported - Greek (%)
Ancestries Reported - Hungarian (%)
Ancestries Reported - Irish (%)
Ancestries Reported - Italian (%)
Ancestries Reported - Lithuanian (%)
Ancestries Reported - Norwegian (%)
Ancestries Reported - Polish (%)
Ancestries Reported - Portuguese (%)
Ancestries Reported - Russian (%)
Ancestries Reported - Scotch-Irish (%)
Ancestries Reported - Scottish (%)
Ancestries Reported - Slovak (%)
Ancestries Reported - Subsaharan African (%)
Ancestries Reported - Swedish (%)
Ancestries Reported - Swiss (%)
Ancestries Reported - Ukrainian (%)
Ancestries Reported - United States (%)
Ancestries Reported - Welsh (%)
Ancestries Reported - West Indian (%)
Ancestries Reported - Other (%)
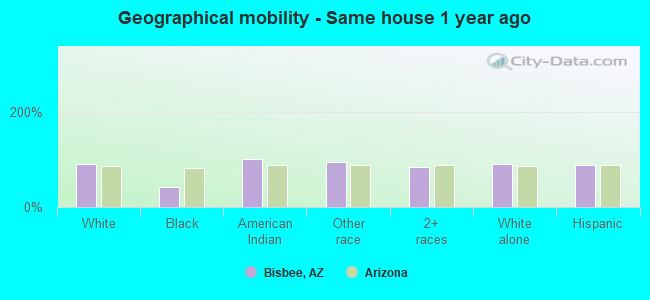
Geographical mobility - Same house 1 year ago (%)
Geographical mobility - Same house 1 year ago (%) - White
Geographical mobility - Same house 1 year ago (%) - Black or African American
Geographical mobility - Same house 1 year ago (%) - Asian
Geographical mobility - Same house 1 year ago (%) - Hispanic or Latino
Geographical mobility - Same house 1 year ago (%) - American Indian and Alaska Native
Geographical mobility - Same house 1 year ago (%) - Multirace
Geographical mobility - Same house 1 year ago (%) - Other Race
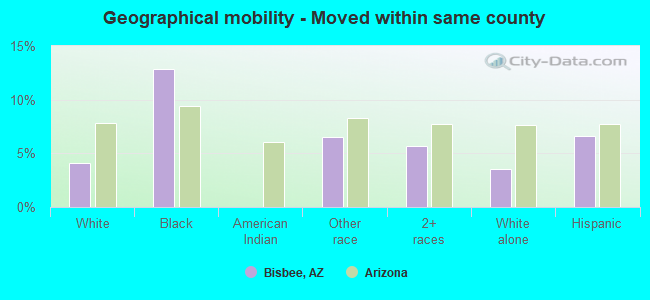
Geographical mobility - Moved within same county (%)
Geographical mobility - Moved within same county (%) - White
Geographical mobility - Moved within same county (%) - Black or African American
Geographical mobility - Moved within same county (%) - Asian
Geographical mobility - Moved within same county (%) - Hispanic or Latino
Geographical mobility - Moved within same county (%) - American Indian and Alaska Native
Geographical mobility - Moved within same county (%) - Multirace
Geographical mobility - Moved within same county (%) - Other Race
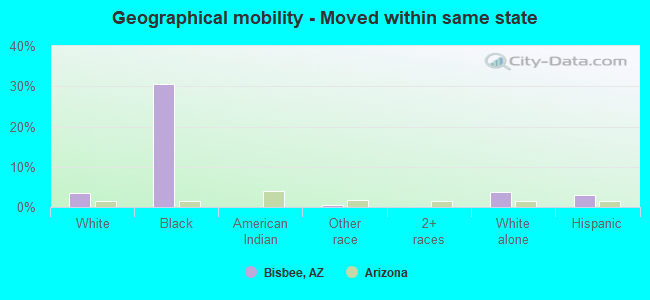
Geographical mobility - Moved from different county within same state (%)
Geographical mobility - Moved from different county within same state (%) - White
Geographical mobility - Moved from different county within same state (%) - Black or African American
Geographical mobility - Moved from different county within same state (%) - Asian
Geographical mobility - Moved from different county within same state (%) - Hispanic or Latino
Geographical mobility - Moved from different county within same state (%) - American Indian and Alaska Native
Geographical mobility - Moved from different county within same state (%) - Multirace
Geographical mobility - Moved from different county within same state (%) - Other Race
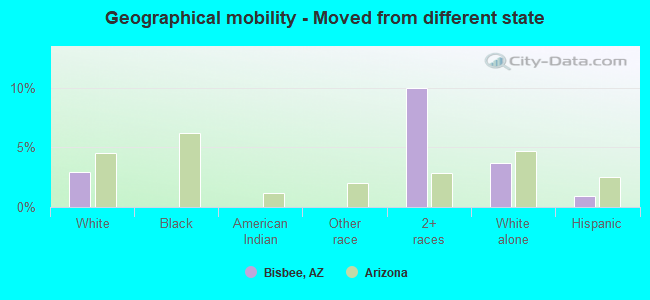
Geographical mobility - Moved from different state (%)
Geographical mobility - Moved from different state (%) - White
Geographical mobility - Moved from different state (%) - Black or African American
Geographical mobility - Moved from different state (%) - Asian
Geographical mobility - Moved from different state (%) - Hispanic or Latino
Geographical mobility - Moved from different state (%) - American Indian and Alaska Native
Geographical mobility - Moved from different state (%) - Multirace
Geographical mobility - Moved from different state (%) - Other Race
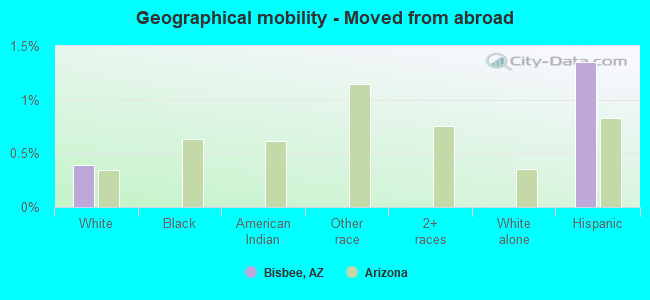
Geographical mobility - Moved from abroad (%)
Geographical mobility - Moved from abroad (%) - White
Geographical mobility - Moved from abroad (%) - Black or African American
Geographical mobility - Moved from abroad (%) - Asian
Geographical mobility - Moved from abroad (%) - Hispanic or Latino
Geographical mobility - Moved from abroad (%) - American Indian and Alaska Native
Geographical mobility - Moved from abroad (%) - Multirace
Geographical mobility - Moved from abroad (%) - Other Race
Place of birth for the foreign-born population - Ireland (%)
Place of birth for the foreign-born population - Denmark (%)
Place of birth for the foreign-born population - Norway (%)
Place of birth for the foreign-born population - Sweden (%)
Place of birth for the foreign-born population - United Kingdom (%)
Place of birth for the foreign-born population - England (%)
Place of birth for the foreign-born population - Scotland (%)
Place of birth for the foreign-born population - Other Northern Europe (%)
Place of birth for the foreign-born population - Austria (%)
Place of birth for the foreign-born population - Belgium (%)
Place of birth for the foreign-born population - France (%)
Place of birth for the foreign-born population - Germany (%)
Place of birth for the foreign-born population - Netherlands (%)
Place of birth for the foreign-born population - Switzerland (%)
Place of birth for the foreign-born population - Other Western Europe (%)
Place of birth for the foreign-born population - Greece (%)
Place of birth for the foreign-born population - Italy (%)
Place of birth for the foreign-born population - Portugal (%)
Place of birth for the foreign-born population - Spain (%)
Place of birth for the foreign-born population - Other Southern Europe (%)
Place of birth for the foreign-born population - Albania (%)
Place of birth for the foreign-born population - Belarus (%)
Place of birth for the foreign-born population - Bosnia and Herzegovina (%)
Place of birth for the foreign-born population - Bulgaria (%)
Place of birth for the foreign-born population - Croatia (%)
Place of birth for the foreign-born population - Czechoslovakia (%)
Place of birth for the foreign-born population - Hungary (%)
Place of birth for the foreign-born population - Latvia (%)
Place of birth for the foreign-born population - Lithuania (%)
Place of birth for the foreign-born population - North Macedonia (Macedonia) (%)
Place of birth for the foreign-born population - Moldova (%)
Place of birth for the foreign-born population - Poland (%)
Place of birth for the foreign-born population - Romania (%)
Place of birth for the foreign-born population - Russia (%)
Place of birth for the foreign-born population - Serbia (%)
Place of birth for the foreign-born population - Ukraine (%)
Place of birth for the foreign-born population - Other Eastern Europe (%)
Place of birth for the foreign-born population - China (%)
Place of birth for the foreign-born population - Hong Kong (%)
Place of birth for the foreign-born population - Taiwan (%)
Place of birth for the foreign-born population - Japan (%)
Place of birth for the foreign-born population - Korea (%)
Place of birth for the foreign-born population - Other Eastern Asia (%)
Place of birth for the foreign-born population - Afghanistan (%)
Place of birth for the foreign-born population - Bangladesh (%)
Place of birth for the foreign-born population - India (%)
Place of birth for the foreign-born population - Iran (%)
Place of birth for the foreign-born population - Kazakhstan (%)
Place of birth for the foreign-born population - Nepal (%)
Place of birth for the foreign-born population - Pakistan (%)
Place of birth for the foreign-born population - Sri Lanka (%)
Place of birth for the foreign-born population - Uzbekistan (%)
Place of birth for the foreign-born population - Other South Central Asia (%)
Place of birth for the foreign-born population - Burma (%)
Place of birth for the foreign-born population - Cambodia (%)
Place of birth for the foreign-born population - Indonesia (%)
Place of birth for the foreign-born population - Laos (%)
Place of birth for the foreign-born population - Malaysia (%)
Place of birth for the foreign-born population - Philippines (%)
Place of birth for the foreign-born population - Singapore (%)
Place of birth for the foreign-born population - Thailand (%)
Place of birth for the foreign-born population - Vietnam (%)
Place of birth for the foreign-born population - Other South Eastern Asia (%)
Place of birth for the foreign-born population - Armenia (%)
Place of birth for the foreign-born population - Iraq (%)
Place of birth for the foreign-born population - Israel (%)
Place of birth for the foreign-born population - Jordan (%)
Place of birth for the foreign-born population - Kuwait (%)
Place of birth for the foreign-born population - Lebanon (%)
Place of birth for the foreign-born population - Saudi Arabia (%)
Place of birth for the foreign-born population - Syria (%)
Place of birth for the foreign-born population - Turkey (%)
Place of birth for the foreign-born population - Yemen (%)
Place of birth for the foreign-born population - Other Western Asia (%)
Place of birth for the foreign-born population - Eritrea (%)
Place of birth for the foreign-born population - Ethiopia (%)
Place of birth for the foreign-born population - Kenya (%)
Place of birth for the foreign-born population - Somalia (%)
Place of birth for the foreign-born population - Uganda (%)
Place of birth for the foreign-born population - Zimbabwe (%)
Place of birth for the foreign-born population - Other Eastern Africa (%)
Place of birth for the foreign-born population - Cameroon (%)
Place of birth for the foreign-born population - Congo (%)
Place of birth for the foreign-born population - Democratic Republic of Congo (Zaire) (%)
Place of birth for the foreign-born population - Other Middle Africa (%)
Place of birth for the foreign-born population - Egypt (%)
Place of birth for the foreign-born population - Morocco (%)
Place of birth for the foreign-born population - Sudan (%)
Place of birth for the foreign-born population - Other Northern Africa (%)
Place of birth for the foreign-born population - South Africa (%)
Place of birth for the foreign-born population - Other Southern Africa (%)
Place of birth for the foreign-born population - Cabo Verde (%)
Place of birth for the foreign-born population - Ghana (%)
Place of birth for the foreign-born population - Liberia (%)
Place of birth for the foreign-born population - Nigeria (%)
Place of birth for the foreign-born population - Senegal (%)
Place of birth for the foreign-born population - Sierra Leone (%)
Place of birth for the foreign-born population - Other Western Africa (%)
Place of birth for the foreign-born population - Australia (%)
Place of birth for the foreign-born population - New Zealand (%)
Place of birth for the foreign-born population - Fiji (%)
Place of birth for the foreign-born population - Micronesia (%)
Place of birth for the foreign-born population - Bahamas (%)
Place of birth for the foreign-born population - Barbados (%)
Place of birth for the foreign-born population - Cuba (%)
Place of birth for the foreign-born population - Dominica (%)
Place of birth for the foreign-born population - Dominican Republic (%)
Place of birth for the foreign-born population - Grenada (%)
Place of birth for the foreign-born population - Haiti (%)
Place of birth for the foreign-born population - Jamaica (%)
Place of birth for the foreign-born population - St. Vincent and the Grenadines (%)
Place of birth for the foreign-born population - Trinidad and Tobago (%)
Place of birth for the foreign-born population - West Indies (%)
Place of birth for the foreign-born population - Other Caribbean (%)
Place of birth for the foreign-born population - Belize (%)
Place of birth for the foreign-born population - Costa Rica (%)
Place of birth for the foreign-born population - El Salvador (%)
Place of birth for the foreign-born population - Guatemala (%)
Place of birth for the foreign-born population - Honduras (%)
Place of birth for the foreign-born population - Mexico (%)
Place of birth for the foreign-born population - Nicaragua (%)
Place of birth for the foreign-born population - Panama (%)
Place of birth for the foreign-born population - Other Central America (%)
Place of birth for the foreign-born population - Argentina (%)
Place of birth for the foreign-born population - Bolivia (%)
Place of birth for the foreign-born population - Brazil (%)
Place of birth for the foreign-born population - Chile (%)
Place of birth for the foreign-born population - Colombia (%)
Place of birth for the foreign-born population - Ecuador (%)
Place of birth for the foreign-born population - Guyana (%)
Place of birth for the foreign-born population - Peru (%)
Place of birth for the foreign-born population - Uruguay (%)
Place of birth for the foreign-born population - Venezuela (%)
Place of birth for the foreign-born population - Other South America (%)
Place of birth for the foreign-born population - Canada (%)
Place of birth for the foreign-born population - Other Northern America (%)
Place of birth for the foreign-born population - Other (%)
Latest news about races in Bisbee, AZ collected exclusively by city-data.com from local newspapers, TV, and radio stations
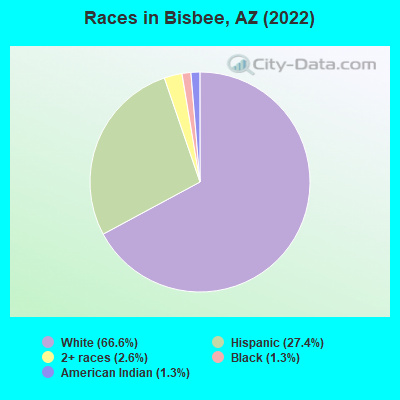
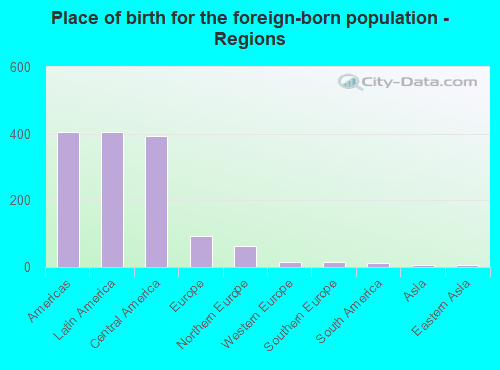
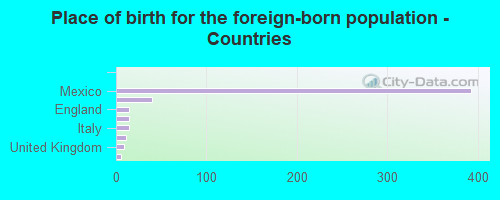
According to 2022 data, the most numerous races in Bisbee, AZ are White alone (3,363 residents), Hispanic (1,777 residents), and Black alone (41 residents). 77.1% of Bisbee residents speak English at home. 9.5% of Bisbee, AZ residents are foreign-born (7.6% born in Latin America, 1.7% born in Europe), which is 36.8% less than the foreign-born rate of 13.0% across the entire state of Arizona.
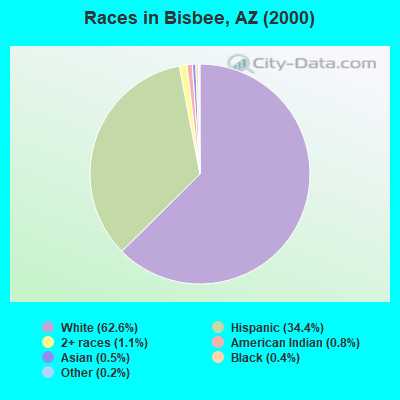
Race distribution in Bisbee
2000 2022
3,274,258 63.8% White alone 1,295,617 25.3% Hispanic 233,370 4.5% American Indian alone 149,941 2.9% Black alone 89,315 1.7% Asian alone 76,372 1.5% Two or more races 6,120 0.1% Other race alone 5,639 0.1% Native Hawaiian and Other
3,814,587 51.8% White alone 2,388,520 32.5% Hispanic 322,459 4.4% Black alone 284,994 3.9% Two or more races 257,020 3.5% Asian alone 241,688 3.3% American Indian alone 36,042 0.5% Other race alone 13,887 0.2% Native Hawaiian and Other
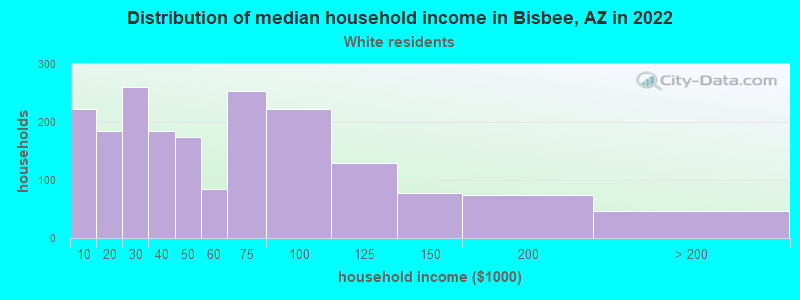
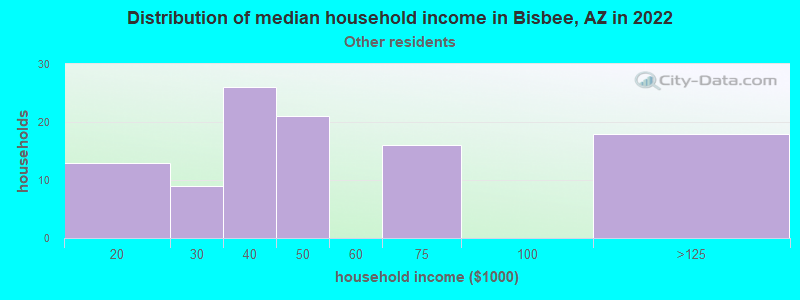
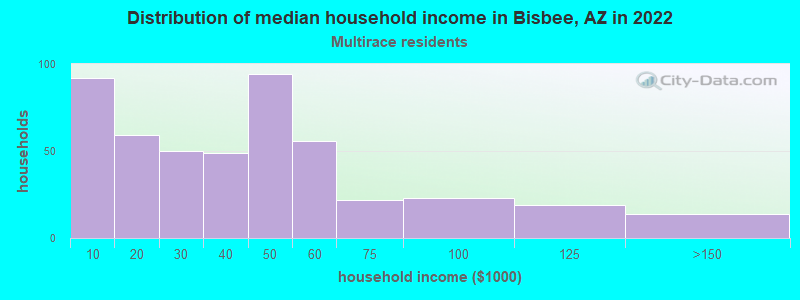
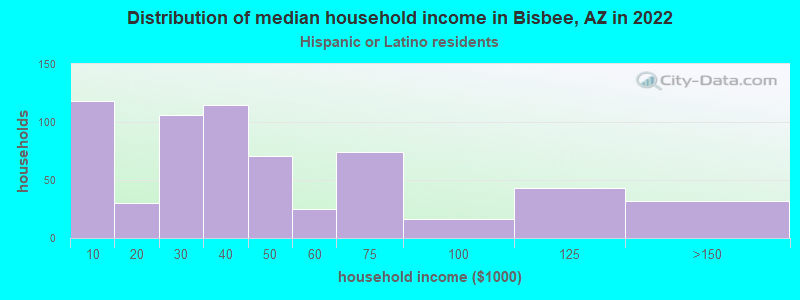
Income and house value in Bisbee Median household income in 2022 $46,977 White non-Hispanic householders$155,125 Black householders$113,819 American Indian and Alaska Native householders$88,259 Asian householders$69,027 Native Hawaiian and other Pacific Islander householders$28,984 Some other race householders$12,960 Two or more races householders$36,561 Hispanic or Latino race householdersMedian 2022 house value $263,624 White Non-Hispanic householders$178,940 American Indian or Alaska Native householders $165,685 Asian householders$188,881 Some other race householders$263,992 Two or more races householders$220,177 Hispanic or Latino householders
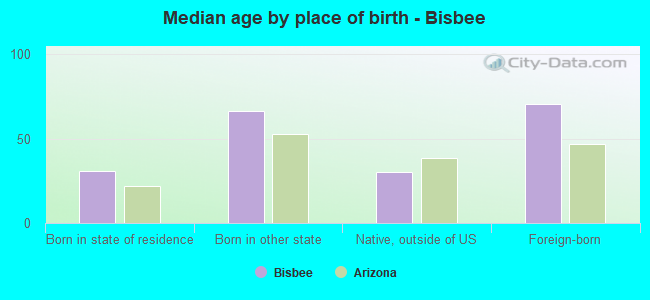
Median age by race in Bisbee
59.5 Median age for White residents55.8 61.4 19.4 Median age for Black or African American residents22.6 Median age for American Indian / Alaska Native residents10.1 43.4 62.2 Median age for Asian residents44.9 Median age for Other race residents20.5 46.1 73.5 Median age for Two or more races residents79.6 70.5 61.9 Median age for White alone residents57.6 62.4 43.6 Median age for Hispanic or Latino residents43.5 44.7
Owner/renter occupied households by race in Bisbee
House owners and renters - White residents 1,683 74.8% Owner occupied566 25.2% Renter occupiedHouse owners and renters - Other race residents 13 24.1% Owner occupied40 75.9% Renter occupiedHouse owners and renters - Two or more races residents 297 69.6% Owner occupied130 30.4% Renter occupiedHouse owners and renters - White alone residents 1,334 73.4% Owner occupied483 26.6% Renter occupiedHouse owners and renters - Hispanic or Latino residents 563 71.5% Owner occupied225 28.5% Renter occupied
Language usage in Bisbee
English speakers - Total 77.1% of residents of Bisbee speak English at home.
21.1% of residents speak Spanish at home 759 68.8% Speak English very well345 31.3% Speak English less than very well1.9% of residents speak other language at home 101 100.0% Speak English very well
English speakers - Born in the United States 92.0% of residents of Bisbee speak English at home.
6.4% of residents speak Spanish at home 116 73.9% Speak English very well41 26.1% Speak English less than very well1.5% of residents speak other language at home 36 100.0% Speak English very well
English speakers - Native, born elsewhere 62.5% of residents of Bisbee speak English at home.
11.4% of residents speak Spanish at home 10 100.0% Speak English very well22.7% of residents speak other language at home 20 100.0% Speak English very well
English speakers - Foreign-born 17.4% of residents of Bisbee speak English at home.
76.4% of residents speak Spanish at home 131 35.1% Speak English very well242 64.9% Speak English less than very well5.9% of residents speak other language at home 29 100.0% Speak English very well
White (Caucasian) - Speak only English Native:
87.0% (3,265)Foreign-born:
28.1% (76)
White (Caucasian) - Speak another language Native:
11.3% (425)Foreign-born:
73.5% (199)
Other race - Speak another language Native:
63.1% (200)Foreign-born:
95.2% (36)
White alone - Speak only English Native:
95.9% (3,057)Foreign-born:
60.1% (56)
White alone - Speak another language Native:
3.7% (118)Foreign-born:
32.2% (30)
Hispanic or Latino - Speak only English Native:
41.9% (555)Foreign-born:
8.0% (29)
Hispanic or Latino - Speak another language Native:
55.9% (740)Foreign-born:
91.9% (333)
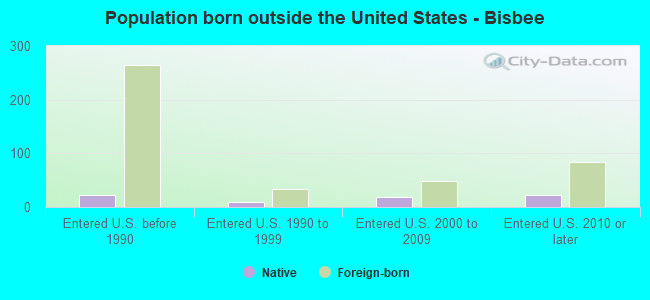
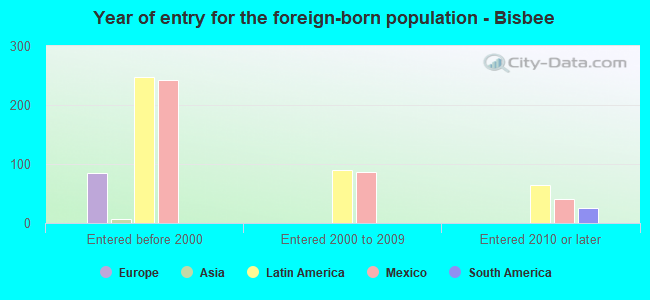
Foreign-born residents in Bisbee 503 residents are foreign born (7.6% Latin America , 1.7% Europe ).
This city:
9.5%Arizona:
100.0%
Marital status for residents in Bisbee Marital status - White (Caucasian) population 15 years and over
Males 24.0% Never married39.8% Now married1.3% Separated6.8% Widowed28.0% DivorcedFemales 25.3% Never married38.2% Now married1.1% Separated13.6% Widowed21.7% DivorcedWomen who gave birth in the past 12 months Now married:
0.0% (0)Unmarried:
100.0% (9)
Women who did not give birth in the past 12 months Now married:
41.7% (227)Unmarried:
58.3% (318)
Marital status - Black or African American population 15 years and over
Males 62.2% Never married13.5% Now married0.0% Separated2.7% Widowed21.6% DivorcedFemales 100.0% Never married0.0% Now married0.0% Separated0.0% Widowed0.0% DivorcedWomen who did not give birth in the past 12 months Now married:
0.0% (0)Unmarried:
100.0% (18)
Marital status - American Indian / Alaska Native population 15 years and over
Males 100.0% Never married0.0% Now married0.0% Separated0.0% Widowed0.0% DivorcedFemales 2.2% Never married97.8% Now married0.0% Separated0.0% Widowed0.0% DivorcedWomen who did not give birth in the past 12 months Now married:
96.6% (27)Unmarried:
3.4% (1)
Marital status - Other race population 15 years and over
Males 83.3% Never married16.7% Now married0.0% Separated0.0% Widowed0.0% DivorcedFemales 47.7% Never married19.9% Now married0.0% Separated25.2% Widowed7.3% DivorcedWomen who did not give birth in the past 12 months Now married:
21.7% (19)Unmarried:
78.3% (67)
Marital status - Two or more races population 15 years and over
Males 28.8% Never married50.8% Now married0.0% Separated0.0% Widowed20.3% DivorcedFemales 55.2% Never married23.9% Now married0.0% Separated0.0% Widowed20.9% DivorcedWomen who did not give birth in the past 12 months Now married:
0.0% (0)Unmarried:
100.0% (161)
Marital status - White alone, not Hispanic / Latino population 15 years and over
Males 20.0% Never married42.9% Now married0.9% Separated6.6% Widowed29.6% DivorcedFemales 20.5% Never married37.2% Now married1.4% Separated13.9% Widowed26.9% DivorcedWomen who gave birth in the past 12 months Now married:
0.0% (0)Unmarried:
100.0% (10)
Women who did not give birth in the past 12 months Now married:
47.0% (201)Unmarried:
53.0% (227)
Marital status - Hispanic or Latino population 15 years and over
Males 41.8% Never married30.0% Now married2.0% Separated6.3% Widowed19.9% DivorcedFemales 44.4% Never married33.5% Now married0.0% Separated14.6% Widowed7.5% DivorcedWomen who did not give birth in the past 12 months Now married:
23.5% (80)Unmarried:
76.5% (261)
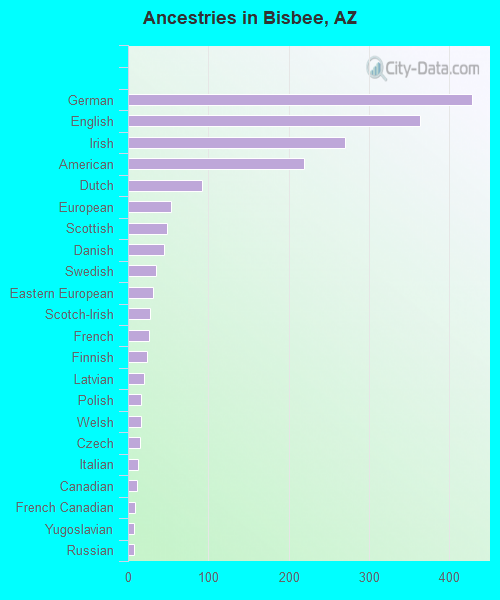
Ancestries in Bisbee
348 11.8% English316 10.7% German239 8.1% Irish138 4.7% American107 3.6% Scottish46 1.6% European46 1.6% French35 1.2% Eastern European32 1.1% Croatian32 1.1% Danish30 1.0% Scotch-Irish27 0.9% Finnish24 0.8% Dutch15 0.5% French Canadian15 0.5% Scandinavian15 0.5% Welsh12 0.4% Greek10 0.3% Canadian10 0.3% Norwegian9 0.3% Czech8 0.3% Yugoslavian7 0.2% Italian7 0.2% Polish7 0.2% Russian6 0.2% Swedish
Children Nativity (place of birth) in Bisbee
Children under 6 years - Living with two parents Both parents native 64 100.0% NativeChildren under 6 years - Living with one parent Native parent 81 100.0% NativeForeign-born parent 14 100.0% NativeChildren 6 to 17 years - Living with two parents Both parents native 281 100.0% NativeOne native, one foreign-born parent 35 100.0% NativeChildren 6 to 17 years - Living with one parent Native parent 444 100.0% NativeForeign-born parent 9 50.3% Native8 49.7% Foreign-born
Grandparents responsible for own grandchildren in Bisbee
Grandparents (30 to 59 years) White / Caucasian 49 56.7% Responsible for grandchildren37 43.3% Not responsible for grandchildrenOther race 3 100.0% Responsible for grandchildrenWhite alone, not Hispanic / Latino 10 25.0% Responsible for grandchildren31 75.0% Not responsible for grandchildrenHispanic or Latino 44 100.0% Responsible for grandchildrenGrandparents (60 years and over) White / Caucasian 71 59.0% Responsible for grandchildren49 41.0% Not responsible for grandchildrenOther race 14 19.6% Responsible for grandchildren59 80.4% Not responsible for grandchildrenWhite alone, not Hispanic / Latino 52 90.2% Responsible for grandchildren6 9.8% Not responsible for grandchildrenHispanic or Latino 27 28.2% Responsible for grandchildren69 71.8% Not responsible for grandchildren