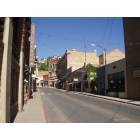
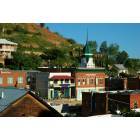
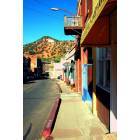
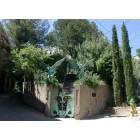
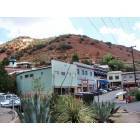
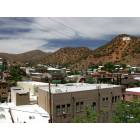
Bisbee, Arizona Submit your own pictures of this city and show them to the world
OSM Map
General Map
Google Map
MSN Map
OSM Map
General Map
Google Map
MSN Map
OSM Map
General Map
Google Map
MSN Map
OSM Map
General Map
Google Map
MSN Map
Please wait while loading the map...
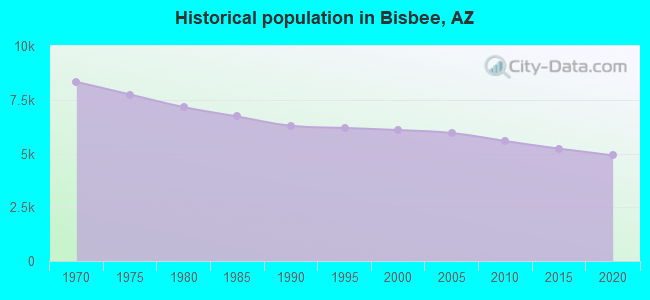
Population in 2022: 5,008 (95% urban, 5% rural). Population change since 2000: -17.8%Males: 2,477 Females: 2,531
March 2022 cost of living index in Bisbee: 88.2 (less than average, U.S. average is 100) Percentage of residents living in poverty in 2022: 20.2%for White Non-Hispanic residents , 27.2% for Hispanic or Latino residents , 9.1% for American Indian residents , 11.8% for other race residents , 27.0% for two or more races residents )Business Search - 14 Million verified businesses
Data:
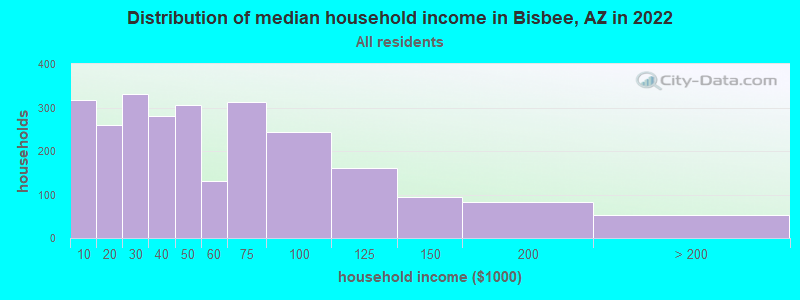
Median household income ($)
Median household income (% change since 2000)
Household income diversity
Ratio of average income to average house value (%)
Ratio of average income to average rent
Median household income ($) - White
Median household income ($) - Black or African American
Median household income ($) - Asian
Median household income ($) - Hispanic or Latino
Median household income ($) - American Indian and Alaska Native
Median household income ($) - Multirace
Median household income ($) - Other Race
Median household income for houses/condos with a mortgage ($)
Median household income for apartments without a mortgage ($)
Races - White alone (%)
Races - White alone (% change since 2000)
Races - Black alone (%)
Races - Black alone (% change since 2000)
Races - American Indian alone (%)
Races - American Indian alone (% change since 2000)
Races - Asian alone (%)
Races - Asian alone (% change since 2000)
Races - Hispanic (%)
Races - Hispanic (% change since 2000)
Races - Native Hawaiian and Other Pacific Islander alone (%)
Races - Native Hawaiian and Other Pacific Islander alone (% change since 2000)
Races - Two or more races (%)
Races - Two or more races (% change since 2000)
Races - Other race alone (%)
Races - Other race alone (% change since 2000)
Racial diversity
Unemployment (%)
Unemployment (% change since 2000)
Unemployment (%) - White
Unemployment (%) - Black or African American
Unemployment (%) - Asian
Unemployment (%) - Hispanic or Latino
Unemployment (%) - American Indian and Alaska Native
Unemployment (%) - Multirace
Unemployment (%) - Other Race
Population density (people per square mile)
Population - Males (%)
Population - Females (%)
Population - Males (%) - White
Population - Males (%) - Black or African American
Population - Males (%) - Asian
Population - Males (%) - Hispanic or Latino
Population - Males (%) - American Indian and Alaska Native
Population - Males (%) - Multirace
Population - Males (%) - Other Race
Population - Females (%) - White
Population - Females (%) - Black or African American
Population - Females (%) - Asian
Population - Females (%) - Hispanic or Latino
Population - Females (%) - American Indian and Alaska Native
Population - Females (%) - Multirace
Population - Females (%) - Other Race
Coronavirus confirmed cases (Apr 27, 2024)
Deaths caused by coronavirus (Apr 27, 2024)
Coronavirus confirmed cases (per 100k population) (Apr 27, 2024)
Deaths caused by coronavirus (per 100k population) (Apr 27, 2024)
Daily increase in number of cases (Apr 27, 2024)
Weekly increase in number of cases (Apr 27, 2024)
Cases doubled (in days) (Apr 27, 2024)
Hospitalized patients (Apr 18, 2022)
Negative test results (Apr 18, 2022)
Total test results (Apr 18, 2022)
COVID Vaccine doses distributed (per 100k population) (Sep 19, 2023)
COVID Vaccine doses administered (per 100k population) (Sep 19, 2023)
COVID Vaccine doses distributed (Sep 19, 2023)
COVID Vaccine doses administered (Sep 19, 2023)
Likely homosexual households (%)
Likely homosexual households (% change since 2000)
Likely homosexual households - Lesbian couples (%)
Likely homosexual households - Lesbian couples (% change since 2000)
Likely homosexual households - Gay men (%)
Likely homosexual households - Gay men (% change since 2000)
Cost of living index
Median gross rent ($)
Median contract rent ($)
Median monthly housing costs ($)
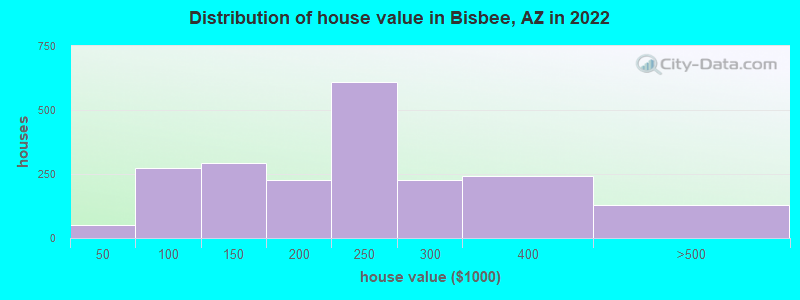
Median house or condo value ($)
Median house or condo value ($ change since 2000)
Mean house or condo value by units in structure - 1, detached ($)
Mean house or condo value by units in structure - 1, attached ($)
Mean house or condo value by units in structure - 2 ($)
Mean house or condo value by units in structure by units in structure - 3 or 4 ($)
Mean house or condo value by units in structure - 5 or more ($)
Mean house or condo value by units in structure - Boat, RV, van, etc. ($)
Mean house or condo value by units in structure - Mobile home ($)
Median house or condo value ($) - White
Median house or condo value ($) - Black or African American
Median house or condo value ($) - Asian
Median house or condo value ($) - Hispanic or Latino
Median house or condo value ($) - American Indian and Alaska Native
Median house or condo value ($) - Multirace
Median house or condo value ($) - Other Race
Median resident age
Resident age diversity
Median resident age - Males
Median resident age - Females
Median resident age - White
Median resident age - Black or African American
Median resident age - Asian
Median resident age - Hispanic or Latino
Median resident age - American Indian and Alaska Native
Median resident age - Multirace
Median resident age - Other Race
Median resident age - Males - White
Median resident age - Males - Black or African American
Median resident age - Males - Asian
Median resident age - Males - Hispanic or Latino
Median resident age - Males - American Indian and Alaska Native
Median resident age - Males - Multirace
Median resident age - Males - Other Race
Median resident age - Females - White
Median resident age - Females - Black or African American
Median resident age - Females - Asian
Median resident age - Females - Hispanic or Latino
Median resident age - Females - American Indian and Alaska Native
Median resident age - Females - Multirace
Median resident age - Females - Other Race
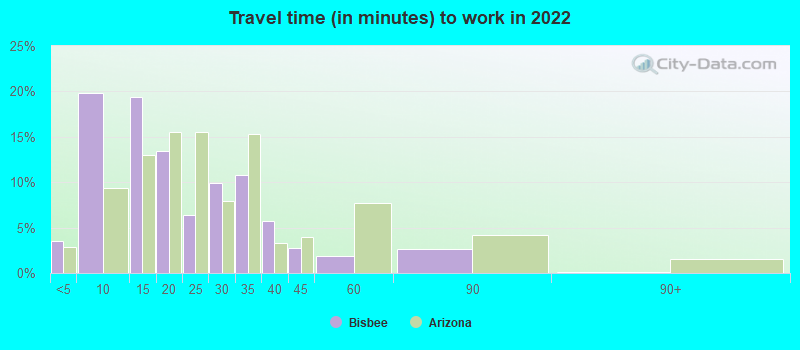
Commute - mean travel time to work (minutes)
Travel time to work - Less than 5 minutes (%)
Travel time to work - Less than 5 minutes (% change since 2000)
Travel time to work - 5 to 9 minutes (%)
Travel time to work - 5 to 9 minutes (% change since 2000)
Travel time to work - 10 to 19 minutes (%)
Travel time to work - 10 to 19 minutes (% change since 2000)
Travel time to work - 20 to 29 minutes (%)
Travel time to work - 20 to 29 minutes (% change since 2000)
Travel time to work - 30 to 39 minutes (%)
Travel time to work - 30 to 39 minutes (% change since 2000)
Travel time to work - 40 to 59 minutes (%)
Travel time to work - 40 to 59 minutes (% change since 2000)
Travel time to work - 60 to 89 minutes (%)
Travel time to work - 60 to 89 minutes (% change since 2000)
Travel time to work - 90 or more minutes (%)
Travel time to work - 90 or more minutes (% change since 2000)
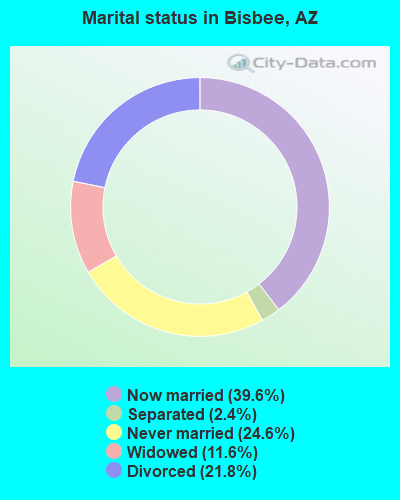
Marital status - Never married (%)
Marital status - Now married (%)
Marital status - Separated (%)
Marital status - Widowed (%)
Marital status - Divorced (%)
Median family income ($)
Median family income (% change since 2000)
Median non-family income ($)
Median non-family income (% change since 2000)
Median per capita income ($)
Median per capita income (% change since 2000)
Median family income ($) - White
Median family income ($) - Black or African American
Median family income ($) - Asian
Median family income ($) - Hispanic or Latino
Median family income ($) - American Indian and Alaska Native
Median family income ($) - Multirace
Median family income ($) - Other Race
Median year house/condo built
Median year apartment built
Year house built - Built 2005 or later (%)
Year house built - Built 2000 to 2004 (%)
Year house built - Built 1990 to 1999 (%)
Year house built - Built 1980 to 1989 (%)
Year house built - Built 1970 to 1979 (%)
Year house built - Built 1960 to 1969 (%)
Year house built - Built 1950 to 1959 (%)
Year house built - Built 1940 to 1949 (%)
Year house built - Built 1939 or earlier (%)
Average household size
Household density (households per square mile)
Average household size - White
Average household size - Black or African American
Average household size - Asian
Average household size - Hispanic or Latino
Average household size - American Indian and Alaska Native
Average household size - Multirace
Average household size - Other Race
Occupied housing units (%)
Vacant housing units (%)
Owner occupied housing units (%)
Renter occupied housing units (%)
Vacancy status - For rent (%)
Vacancy status - For sale only (%)
Vacancy status - Rented or sold, not occupied (%)
Vacancy status - For seasonal, recreational, or occasional use (%)
Vacancy status - For migrant workers (%)
Vacancy status - Other vacant (%)
Residents with income below the poverty level (%)
Residents with income below 50% of the poverty level (%)
Children below poverty level (%)
Poor families by family type - Married-couple family (%)
Poor families by family type - Male, no wife present (%)
Poor families by family type - Female, no husband present (%)
Poverty status for native-born residents (%)
Poverty status for foreign-born residents (%)
Poverty among high school graduates not in families (%)
Poverty among people who did not graduate high school not in families (%)
Residents with income below the poverty level (%) - White
Residents with income below the poverty level (%) - Black or African American
Residents with income below the poverty level (%) - Asian
Residents with income below the poverty level (%) - Hispanic or Latino
Residents with income below the poverty level (%) - American Indian and Alaska Native
Residents with income below the poverty level (%) - Multirace
Residents with income below the poverty level (%) - Other Race
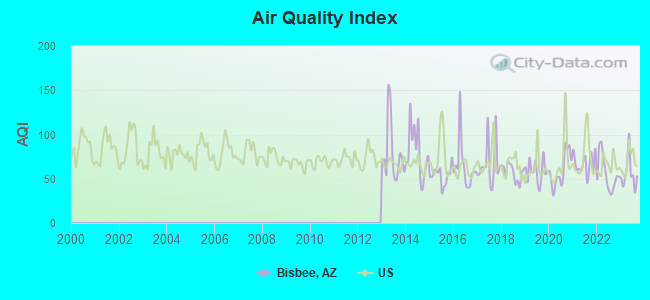
Air pollution - Air Quality Index (AQI)
Air pollution - CO
Air pollution - NO2
Air pollution - SO2
Air pollution - Ozone
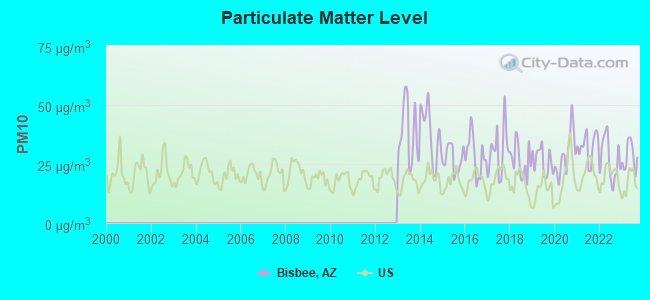
Air pollution - PM10
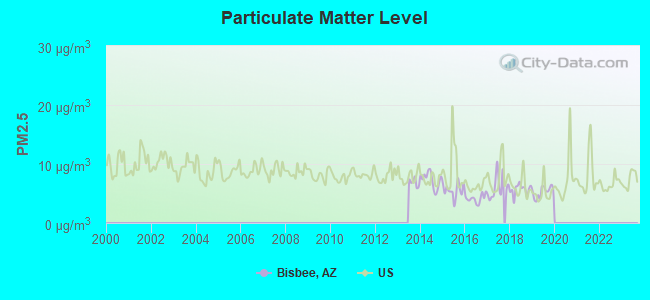
Air pollution - PM25
Air pollution - Pb
Crime - Murders per 100,000 population
Crime - Rapes per 100,000 population
Crime - Robberies per 100,000 population
Crime - Assaults per 100,000 population
Crime - Burglaries per 100,000 population
Crime - Thefts per 100,000 population
Crime - Auto thefts per 100,000 population
Crime - Arson per 100,000 population
Crime - City-data.com crime index
Crime - Violent crime index
Crime - Property crime index
Crime - Murders per 100,000 population (5 year average)
Crime - Rapes per 100,000 population (5 year average)
Crime - Robberies per 100,000 population (5 year average)
Crime - Assaults per 100,000 population (5 year average)
Crime - Burglaries per 100,000 population (5 year average)
Crime - Thefts per 100,000 population (5 year average)
Crime - Auto thefts per 100,000 population (5 year average)
Crime - Arson per 100,000 population (5 year average)
Crime - City-data.com crime index (5 year average)
Crime - Violent crime index (5 year average)
Crime - Property crime index (5 year average)
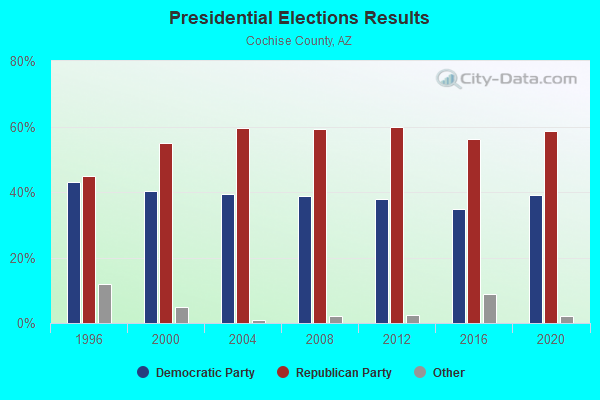
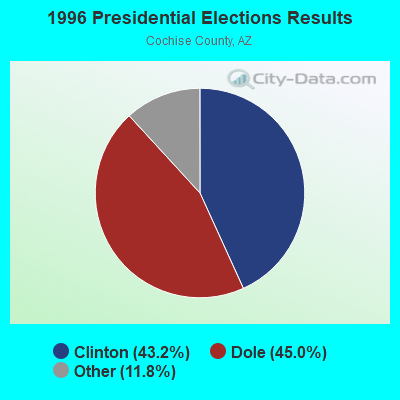
1996 Presidential Elections Results (%) - Democratic Party (Clinton)
1996 Presidential Elections Results (%) - Republican Party (Dole)
1996 Presidential Elections Results (%) - Other
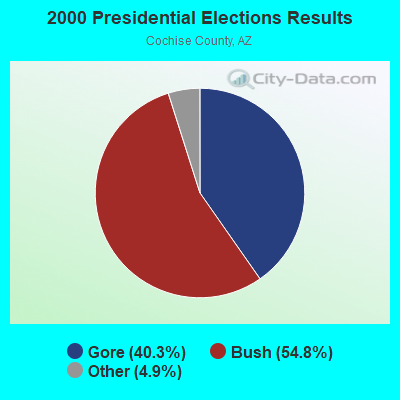
2000 Presidential Elections Results (%) - Democratic Party (Gore)
2000 Presidential Elections Results (%) - Republican Party (Bush)
2000 Presidential Elections Results (%) - Other
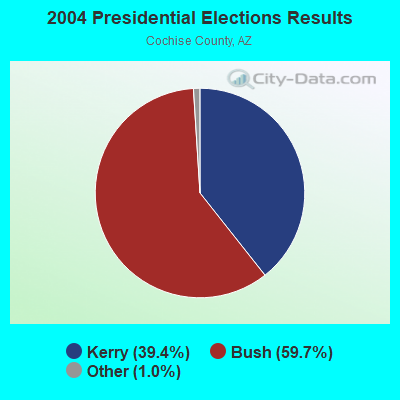
2004 Presidential Elections Results (%) - Democratic Party (Kerry)
2004 Presidential Elections Results (%) - Republican Party (Bush)
2004 Presidential Elections Results (%) - Other
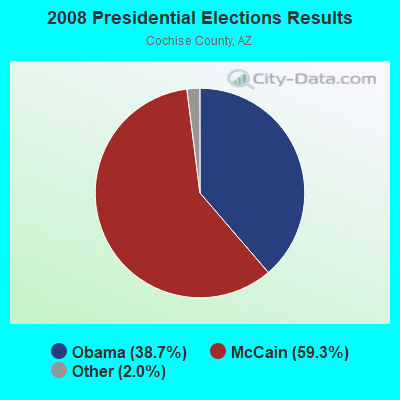
2008 Presidential Elections Results (%) - Democratic Party (Obama)
2008 Presidential Elections Results (%) - Republican Party (McCain)
2008 Presidential Elections Results (%) - Other
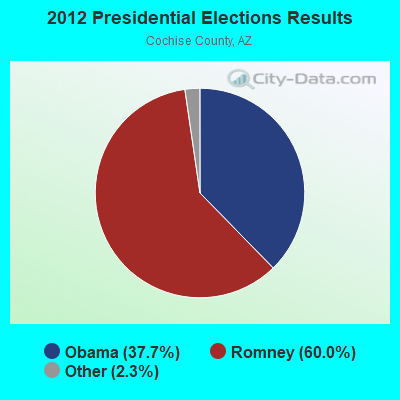
2012 Presidential Elections Results (%) - Democratic Party (Obama)
2012 Presidential Elections Results (%) - Republican Party (Romney)
2012 Presidential Elections Results (%) - Other
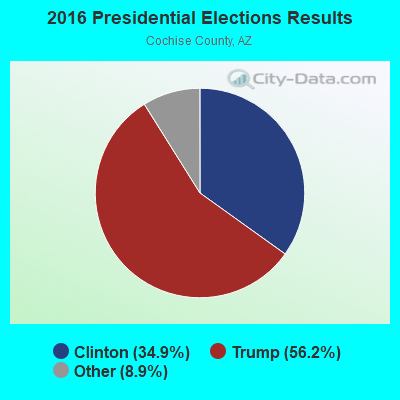
2016 Presidential Elections Results (%) - Democratic Party (Clinton)
2016 Presidential Elections Results (%) - Republican Party (Trump)
2016 Presidential Elections Results (%) - Other
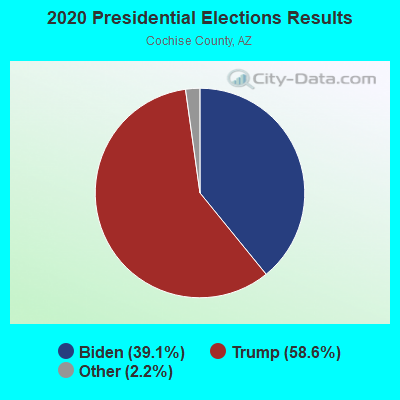
2020 Presidential Elections Results (%) - Democratic Party (Biden)
2020 Presidential Elections Results (%) - Republican Party (Trump)
2020 Presidential Elections Results (%) - Other
Ancestries Reported - Arab (%)
Ancestries Reported - Czech (%)
Ancestries Reported - Danish (%)
Ancestries Reported - Dutch (%)
Ancestries Reported - English (%)
Ancestries Reported - French (%)
Ancestries Reported - French Canadian (%)
Ancestries Reported - German (%)
Ancestries Reported - Greek (%)
Ancestries Reported - Hungarian (%)
Ancestries Reported - Irish (%)
Ancestries Reported - Italian (%)
Ancestries Reported - Lithuanian (%)
Ancestries Reported - Norwegian (%)
Ancestries Reported - Polish (%)
Ancestries Reported - Portuguese (%)
Ancestries Reported - Russian (%)
Ancestries Reported - Scotch-Irish (%)
Ancestries Reported - Scottish (%)
Ancestries Reported - Slovak (%)
Ancestries Reported - Subsaharan African (%)
Ancestries Reported - Swedish (%)
Ancestries Reported - Swiss (%)
Ancestries Reported - Ukrainian (%)
Ancestries Reported - United States (%)
Ancestries Reported - Welsh (%)
Ancestries Reported - West Indian (%)
Ancestries Reported - Other (%)
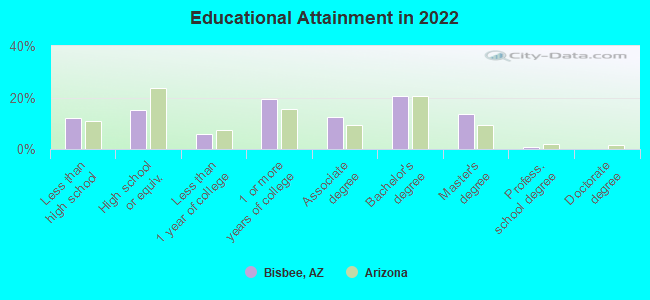
Educational Attainment - No schooling completed (%)
Educational Attainment - Less than high school (%)
Educational Attainment - High school or equivalent (%)
Educational Attainment - Less than 1 year of college (%)
Educational Attainment - 1 or more years of college (%)
Educational Attainment - Associate degree (%)
Educational Attainment - Bachelor's degree (%)
Educational Attainment - Master's degree (%)
Educational Attainment - Professional school degree (%)
Educational Attainment - Doctorate degree (%)
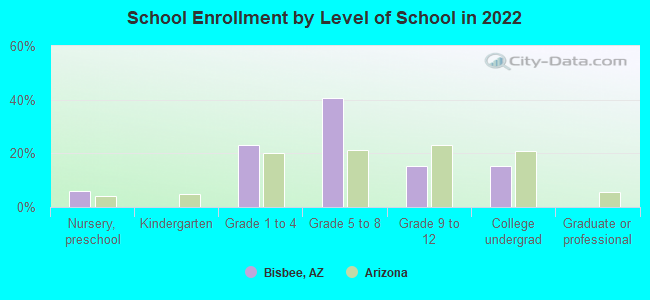
School Enrollment - Nursery, preschool (%)
School Enrollment - Kindergarten (%)
School Enrollment - Grade 1 to 4 (%)
School Enrollment - Grade 5 to 8 (%)
School Enrollment - Grade 9 to 12 (%)
School Enrollment - College undergrad (%)
School Enrollment - Graduate or professional (%)
School Enrollment - Not enrolled in school (%)
School enrollment - Public schools (%)
School enrollment - Private schools (%)
School enrollment - Not enrolled (%)
Median number of rooms in houses and condos
Median number of rooms in apartments
Housing units lacking complete plumbing facilities (%)
Housing units lacking complete kitchen facilities (%)
Density of houses
Urban houses (%)
Rural houses (%)
Households with people 60 years and over (%)
Households with people 65 years and over (%)
Households with people 75 years and over (%)
Households with one or more nonrelatives (%)
Households with no nonrelatives (%)
Population in households (%)
Family households (%)
Nonfamily households (%)
Population in families (%)
Family households with own children (%)
Median number of bedrooms in owner occupied houses
Mean number of bedrooms in owner occupied houses
Median number of bedrooms in renter occupied houses
Mean number of bedrooms in renter occupied houses
Median number of vehichles in owner occupied houses
Mean number of vehichles in owner occupied houses
Median number of vehichles in renter occupied houses
Mean number of vehichles in renter occupied houses
Mortgage status - with mortgage (%)
Mortgage status - with second mortgage (%)
Mortgage status - with home equity loan (%)
Mortgage status - with both second mortgage and home equity loan (%)
Mortgage status - without a mortgage (%)
Average family size
Average family size - White
Average family size - Black or African American
Average family size - Asian
Average family size - Hispanic or Latino
Average family size - American Indian and Alaska Native
Average family size - Multirace
Average family size - Other Race
Geographical mobility - Same house 1 year ago (%)
Geographical mobility - Moved within same county (%)
Geographical mobility - Moved from different county within same state (%)
Geographical mobility - Moved from different state (%)
Geographical mobility - Moved from abroad (%)
Place of birth - Born in state of residence (%)
Place of birth - Born in other state (%)
Place of birth - Native, outside of US (%)
Place of birth - Foreign born (%)
Housing units in structures - 1, detached (%)
Housing units in structures - 1, attached (%)
Housing units in structures - 2 (%)
Housing units in structures - 3 or 4 (%)
Housing units in structures - 5 to 9 (%)
Housing units in structures - 10 to 19 (%)
Housing units in structures - 20 to 49 (%)
Housing units in structures - 50 or more (%)
Housing units in structures - Mobile home (%)
Housing units in structures - Boat, RV, van, etc. (%)
House/condo owner moved in on average (years ago)
Renter moved in on average (years ago)
Year householder moved into unit - Moved in 1999 to March 2000 (%)
Year householder moved into unit - Moved in 1995 to 1998 (%)
Year householder moved into unit - Moved in 1990 to 1994 (%)
Year householder moved into unit - Moved in 1980 to 1989 (%)
Year householder moved into unit - Moved in 1970 to 1979 (%)
Year householder moved into unit - Moved in 1969 or earlier (%)
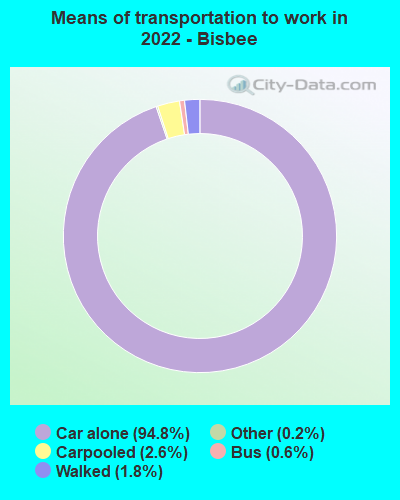
Means of transportation to work - Drove car alone (%)
Means of transportation to work - Carpooled (%)
Means of transportation to work - Public transportation (%)
Means of transportation to work - Bus or trolley bus (%)
Means of transportation to work - Streetcar or trolley car (%)
Means of transportation to work - Subway or elevated (%)
Means of transportation to work - Railroad (%)
Means of transportation to work - Ferryboat (%)
Means of transportation to work - Taxicab (%)
Means of transportation to work - Motorcycle (%)
Means of transportation to work - Bicycle (%)
Means of transportation to work - Walked (%)
Means of transportation to work - Other means (%)
Working at home (%)
Industry diversity
Most Common Industries - Agriculture, forestry, fishing and hunting, and mining (%)
Most Common Industries - Agriculture, forestry, fishing and hunting (%)
Most Common Industries - Mining, quarrying, and oil and gas extraction (%)
Most Common Industries - Construction (%)
Most Common Industries - Manufacturing (%)
Most Common Industries - Wholesale trade (%)
Most Common Industries - Retail trade (%)
Most Common Industries - Transportation and warehousing, and utilities (%)
Most Common Industries - Transportation and warehousing (%)
Most Common Industries - Utilities (%)
Most Common Industries - Information (%)
Most Common Industries - Finance and insurance, and real estate and rental and leasing (%)
Most Common Industries - Finance and insurance (%)
Most Common Industries - Real estate and rental and leasing (%)
Most Common Industries - Professional, scientific, and management, and administrative and waste management services (%)
Most Common Industries - Professional, scientific, and technical services (%)
Most Common Industries - Management of companies and enterprises (%)
Most Common Industries - Administrative and support and waste management services (%)
Most Common Industries - Educational services, and health care and social assistance (%)
Most Common Industries - Educational services (%)
Most Common Industries - Health care and social assistance (%)
Most Common Industries - Arts, entertainment, and recreation, and accommodation and food services (%)
Most Common Industries - Arts, entertainment, and recreation (%)
Most Common Industries - Accommodation and food services (%)
Most Common Industries - Other services, except public administration (%)
Most Common Industries - Public administration (%)
Occupation diversity
Most Common Occupations - Management, business, science, and arts occupations (%)
Most Common Occupations - Management, business, and financial occupations (%)
Most Common Occupations - Management occupations (%)
Most Common Occupations - Business and financial operations occupations (%)
Most Common Occupations - Computer, engineering, and science occupations (%)
Most Common Occupations - Computer and mathematical occupations (%)
Most Common Occupations - Architecture and engineering occupations (%)
Most Common Occupations - Life, physical, and social science occupations (%)
Most Common Occupations - Education, legal, community service, arts, and media occupations (%)
Most Common Occupations - Community and social service occupations (%)
Most Common Occupations - Legal occupations (%)
Most Common Occupations - Education, training, and library occupations (%)
Most Common Occupations - Arts, design, entertainment, sports, and media occupations (%)
Most Common Occupations - Healthcare practitioners and technical occupations (%)
Most Common Occupations - Health diagnosing and treating practitioners and other technical occupations (%)
Most Common Occupations - Health technologists and technicians (%)
Most Common Occupations - Service occupations (%)
Most Common Occupations - Healthcare support occupations (%)
Most Common Occupations - Protective service occupations (%)
Most Common Occupations - Fire fighting and prevention, and other protective service workers including supervisors (%)
Most Common Occupations - Law enforcement workers including supervisors (%)
Most Common Occupations - Food preparation and serving related occupations (%)
Most Common Occupations - Building and grounds cleaning and maintenance occupations (%)
Most Common Occupations - Personal care and service occupations (%)
Most Common Occupations - Sales and office occupations (%)
Most Common Occupations - Sales and related occupations (%)
Most Common Occupations - Office and administrative support occupations (%)
Most Common Occupations - Natural resources, construction, and maintenance occupations (%)
Most Common Occupations - Farming, fishing, and forestry occupations (%)
Most Common Occupations - Construction and extraction occupations (%)
Most Common Occupations - Installation, maintenance, and repair occupations (%)
Most Common Occupations - Production, transportation, and material moving occupations (%)
Most Common Occupations - Production occupations (%)
Most Common Occupations - Transportation occupations (%)
Most Common Occupations - Material moving occupations (%)
People in Group quarters - Institutionalized population (%)
People in Group quarters - Correctional institutions (%)
People in Group quarters - Federal prisons and detention centers (%)
People in Group quarters - Halfway houses (%)
People in Group quarters - Local jails and other confinement facilities (including police lockups) (%)
People in Group quarters - Military disciplinary barracks (%)
People in Group quarters - State prisons (%)
People in Group quarters - Other types of correctional institutions (%)
People in Group quarters - Nursing homes (%)
People in Group quarters - Hospitals/wards, hospices, and schools for the handicapped (%)
People in Group quarters - Hospitals/wards and hospices for chronically ill (%)
People in Group quarters - Hospices or homes for chronically ill (%)
People in Group quarters - Military hospitals or wards for chronically ill (%)
People in Group quarters - Other hospitals or wards for chronically ill (%)
People in Group quarters - Hospitals or wards for drug/alcohol abuse (%)
People in Group quarters - Mental (Psychiatric) hospitals or wards (%)
People in Group quarters - Schools, hospitals, or wards for the mentally retarded (%)
People in Group quarters - Schools, hospitals, or wards for the physically handicapped (%)
People in Group quarters - Institutions for the deaf (%)
People in Group quarters - Institutions for the blind (%)
People in Group quarters - Orthopedic wards and institutions for the physically handicapped (%)
People in Group quarters - Wards in general hospitals for patients who have no usual home elsewhere (%)
People in Group quarters - Wards in military hospitals for patients who have no usual home elsewhere (%)
People in Group quarters - Juvenile institutions (%)
People in Group quarters - Long-term care (%)
People in Group quarters - Homes for abused, dependent, and neglected children (%)
People in Group quarters - Residential treatment centers for emotionally disturbed children (%)
People in Group quarters - Training schools for juvenile delinquents (%)
People in Group quarters - Short-term care, detention or diagnostic centers for delinquent children (%)
People in Group quarters - Type of juvenile institution unknown (%)
People in Group quarters - Noninstitutionalized population (%)
People in Group quarters - College dormitories (includes college quarters off campus) (%)
People in Group quarters - Military quarters (%)
People in Group quarters - On base (%)
People in Group quarters - Barracks, unaccompanied personnel housing (UPH), (Enlisted/Officer), ;and similar group living quarters for military personnel (%)
People in Group quarters - Transient quarters for temporary residents (%)
People in Group quarters - Military ships (%)
People in Group quarters - Group homes (%)
People in Group quarters - Homes or halfway houses for drug/alcohol abuse (%)
People in Group quarters - Homes for the mentally ill (%)
People in Group quarters - Homes for the mentally retarded (%)
People in Group quarters - Homes for the physically handicapped (%)
People in Group quarters - Other group homes (%)
People in Group quarters - Religious group quarters (%)
People in Group quarters - Dormitories (%)
People in Group quarters - Agriculture workers' dormitories on farms (%)
People in Group quarters - Job Corps and vocational training facilities (%)
People in Group quarters - Other workers' dormitories (%)
People in Group quarters - Crews of maritime vessels (%)
People in Group quarters - Other nonhousehold living situations (%)
People in Group quarters - Other noninstitutional group quarters (%)
Residents speaking English at home (%)
Residents speaking English at home - Born in the United States (%)
Residents speaking English at home - Native, born elsewhere (%)
Residents speaking English at home - Foreign born (%)
Residents speaking Spanish at home (%)
Residents speaking Spanish at home - Born in the United States (%)
Residents speaking Spanish at home - Native, born elsewhere (%)
Residents speaking Spanish at home - Foreign born (%)
Residents speaking other language at home (%)
Residents speaking other language at home - Born in the United States (%)
Residents speaking other language at home - Native, born elsewhere (%)
Residents speaking other language at home - Foreign born (%)
Class of Workers - Employee of private company (%)
Class of Workers - Self-employed in own incorporated business (%)
Class of Workers - Private not-for-profit wage and salary workers (%)
Class of Workers - Local government workers (%)
Class of Workers - State government workers (%)
Class of Workers - Federal government workers (%)
Class of Workers - Self-employed workers in own not incorporated business and Unpaid family workers (%)
House heating fuel used in houses and condos - Utility gas (%)
House heating fuel used in houses and condos - Bottled, tank, or LP gas (%)
House heating fuel used in houses and condos - Electricity (%)
House heating fuel used in houses and condos - Fuel oil, kerosene, etc. (%)
House heating fuel used in houses and condos - Coal or coke (%)
House heating fuel used in houses and condos - Wood (%)
House heating fuel used in houses and condos - Solar energy (%)
House heating fuel used in houses and condos - Other fuel (%)
House heating fuel used in houses and condos - No fuel used (%)
House heating fuel used in apartments - Utility gas (%)
House heating fuel used in apartments - Bottled, tank, or LP gas (%)
House heating fuel used in apartments - Electricity (%)
House heating fuel used in apartments - Fuel oil, kerosene, etc. (%)
House heating fuel used in apartments - Coal or coke (%)
House heating fuel used in apartments - Wood (%)
House heating fuel used in apartments - Solar energy (%)
House heating fuel used in apartments - Other fuel (%)
House heating fuel used in apartments - No fuel used (%)
Armed forces status - In Armed Forces (%)
Armed forces status - Civilian (%)
Armed forces status - Civilian - Veteran (%)
Armed forces status - Civilian - Nonveteran (%)
Fatal accidents locations in years 2005-2021
Fatal accidents locations in 2005
Fatal accidents locations in 2006
Fatal accidents locations in 2007
Fatal accidents locations in 2008
Fatal accidents locations in 2009
Fatal accidents locations in 2010
Fatal accidents locations in 2011
Fatal accidents locations in 2012
Fatal accidents locations in 2013
Fatal accidents locations in 2014
Fatal accidents locations in 2015
Fatal accidents locations in 2016
Fatal accidents locations in 2017
Fatal accidents locations in 2018
Fatal accidents locations in 2019
Fatal accidents locations in 2020
Fatal accidents locations in 2021
Alcohol use - People drinking some alcohol every month (%)
Alcohol use - People not drinking at all (%)
Alcohol use - Average days/month drinking alcohol
Alcohol use - Average drinks/week
Alcohol use - Average days/year people drink much
Audiometry - Average condition of hearing (%)
Audiometry - People that can hear a whisper from across a quiet room (%)
Audiometry - People that can hear normal voice from across a quiet room (%)
Audiometry - Ears ringing, roaring, buzzing (%)
Audiometry - Had a job exposure to loud noise (%)
Audiometry - Had off-work exposure to loud noise (%)
Blood Pressure & Cholesterol - Has high blood pressure (%)
Blood Pressure & Cholesterol - Checking blood pressure at home (%)
Blood Pressure & Cholesterol - Frequently checking blood cholesterol (%)
Blood Pressure & Cholesterol - Has high cholesterol level (%)
Consumer Behavior - Money monthly spent on food at supermarket/grocery store
Consumer Behavior - Money monthly spent on food at other stores
Consumer Behavior - Money monthly spent on eating out
Consumer Behavior - Money monthly spent on carryout/delivered foods
Consumer Behavior - Income spent on food at supermarket/grocery store (%)
Consumer Behavior - Income spent on food at other stores (%)
Consumer Behavior - Income spent on eating out (%)
Consumer Behavior - Income spent on carryout/delivered foods (%)
Current Health Status - General health condition (%)
Current Health Status - Blood donors (%)
Current Health Status - Has blood ever tested for HIV virus (%)
Current Health Status - Left-handed people (%)
Dermatology - People using sunscreen (%)
Diabetes - Diabetics (%)
Diabetes - Had a blood test for high blood sugar (%)
Diabetes - People taking insulin (%)
Diet Behavior & Nutrition - Diet health (%)
Diet Behavior & Nutrition - Milk product consumption (# of products/month)
Diet Behavior & Nutrition - Meals not home prepared (#/week)
Diet Behavior & Nutrition - Meals from fast food or pizza place (#/week)
Diet Behavior & Nutrition - Ready-to-eat foods (#/month)
Diet Behavior & Nutrition - Frozen meals/pizza (#/month)
Drug Use - People that ever used marijuana or hashish (%)
Drug Use - Ever used hard drugs (%)
Drug Use - Ever used any form of cocaine (%)
Drug Use - Ever used heroin (%)
Drug Use - Ever used methamphetamine (%)
Health Insurance - People covered by health insurance (%)
Kidney Conditions-Urology - Avg. # of times urinating at night
Medical Conditions - People with asthma (%)
Medical Conditions - People with anemia (%)
Medical Conditions - People with psoriasis (%)
Medical Conditions - People with overweight (%)
Medical Conditions - Elderly people having difficulties in thinking or remembering (%)
Medical Conditions - People who ever received blood transfusion (%)
Medical Conditions - People having trouble seeing even with glass/contacts (%)
Medical Conditions - People with arthritis (%)
Medical Conditions - People with gout (%)
Medical Conditions - People with congestive heart failure (%)
Medical Conditions - People with coronary heart disease (%)
Medical Conditions - People with angina pectoris (%)
Medical Conditions - People who ever had heart attack (%)
Medical Conditions - People who ever had stroke (%)
Medical Conditions - People with emphysema (%)
Medical Conditions - People with thyroid problem (%)
Medical Conditions - People with chronic bronchitis (%)
Medical Conditions - People with any liver condition (%)
Medical Conditions - People who ever had cancer or malignancy (%)
Mental Health - People who have little interest in doing things (%)
Mental Health - People feeling down, depressed, or hopeless (%)
Mental Health - People who have trouble sleeping or sleeping too much (%)
Mental Health - People feeling tired or having little energy (%)
Mental Health - People with poor appetite or overeating (%)
Mental Health - People feeling bad about themself (%)
Mental Health - People who have trouble concentrating on things (%)
Mental Health - People moving or speaking slowly or too fast (%)
Mental Health - People having thoughts they would be better off dead (%)
Oral Health - Average years since last visit a dentist
Oral Health - People embarrassed because of mouth (%)
Oral Health - People with gum disease (%)
Oral Health - General health of teeth and gums (%)
Oral Health - Average days a week using dental floss/device
Oral Health - Average days a week using mouthwash for dental problem
Oral Health - Average number of teeth
Pesticide Use - Households using pesticides to control insects (%)
Pesticide Use - Households using pesticides to kill weeds (%)
Physical Activity - People doing vigorous-intensity work activities (%)
Physical Activity - People doing moderate-intensity work activities (%)
Physical Activity - People walking or bicycling (%)
Physical Activity - People doing vigorous-intensity recreational activities (%)
Physical Activity - People doing moderate-intensity recreational activities (%)
Physical Activity - Average hours a day doing sedentary activities
Physical Activity - Average hours a day watching TV or videos
Physical Activity - Average hours a day using computer
Physical Functioning - People having limitations keeping them from working (%)
Physical Functioning - People limited in amount of work they can do (%)
Physical Functioning - People that need special equipment to walk (%)
Physical Functioning - People experiencing confusion/memory problems (%)
Physical Functioning - People requiring special healthcare equipment (%)
Prescription Medications - Average number of prescription medicines taking
Preventive Aspirin Use - Adults 40+ taking low-dose aspirin (%)
Reproductive Health - Vaginal deliveries (%)
Reproductive Health - Cesarean deliveries (%)
Reproductive Health - Deliveries resulted in a live birth (%)
Reproductive Health - Pregnancies resulted in a delivery (%)
Reproductive Health - Women breastfeeding newborns (%)
Reproductive Health - Women that had a hysterectomy (%)
Reproductive Health - Women that had both ovaries removed (%)
Reproductive Health - Women that have ever taken birth control pills (%)
Reproductive Health - Women taking birth control pills (%)
Reproductive Health - Women that have ever used Depo-Provera or injectables (%)
Reproductive Health - Women that have ever used female hormones (%)
Sexual Behavior - People 18+ that ever had sex (vaginal, anal, or oral) (%)
Sexual Behavior - Males 18+ that ever had vaginal sex with a woman (%)
Sexual Behavior - Males 18+ that ever performed oral sex on a woman (%)
Sexual Behavior - Males 18+ that ever had anal sex with a woman (%)
Sexual Behavior - Males 18+ that ever had any sex with a man (%)
Sexual Behavior - Females 18+ that ever had vaginal sex with a man (%)
Sexual Behavior - Females 18+ that ever performed oral sex on a man (%)
Sexual Behavior - Females 18+ that ever had anal sex with a man (%)
Sexual Behavior - Females 18+ that ever had any kind of sex with a woman (%)
Sexual Behavior - Average age people first had sex
Sexual Behavior - Average number of female sex partners in lifetime (males 18+)
Sexual Behavior - Average number of female vaginal sex partners in lifetime (males 18+)
Sexual Behavior - Average age people first performed oral sex on a woman (18+)
Sexual Behavior - Average number of woman performed oral sex on in lifetime (18+)
Sexual Behavior - Average number of male sex partners in lifetime (males 18+)
Sexual Behavior - Average number of male anal sex partners in lifetime (males 18+)
Sexual Behavior - Average age people first performed oral sex on a man (18+)
Sexual Behavior - Average number of male oral sex partners in lifetime (18+)
Sexual Behavior - People using protection when performing oral sex (%)
Sexual Behavior - Average number of times people have vaginal or anal sex a year
Sexual Behavior - People having sex without condom (%)
Sexual Behavior - Average number of male sex partners in lifetime (females 18+)
Sexual Behavior - Average number of male vaginal sex partners in lifetime (females 18+)
Sexual Behavior - Average number of female sex partners in lifetime (females 18+)
Sexual Behavior - Circumcised males 18+ (%)
Sleep Disorders - Average hours sleeping at night
Sleep Disorders - People that has trouble sleeping (%)
Smoking-Cigarette Use - People smoking cigarettes (%)
Taste & Smell - People 40+ having problems with smell (%)
Taste & Smell - People 40+ having problems with taste (%)
Taste & Smell - People 40+ that ever had wisdom teeth removed (%)
Taste & Smell - People 40+ that ever had tonsils teeth removed (%)
Taste & Smell - People 40+ that ever had a loss of consciousness because of a head injury (%)
Taste & Smell - People 40+ that ever had a broken nose or other serious injury to face or skull (%)
Taste & Smell - People 40+ that ever had two or more sinus infections (%)
Weight - Average height (inches)
Weight - Average weight (pounds)
Weight - Average BMI
Weight - People that are obese (%)
Weight - People that ever were obese (%)
Weight - People trying to lose weight (%)
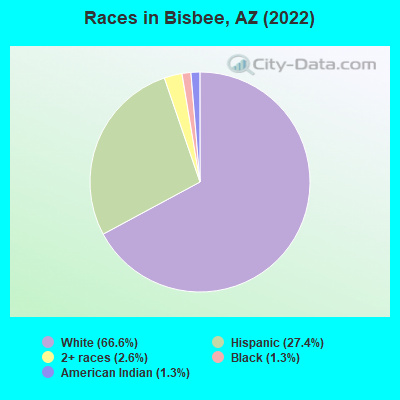
3,313 66.6% White alone 1,363 27.4% Hispanic 127 2.6% Two or more races 66 1.3% Black alone 63 1.3% American Indian alone
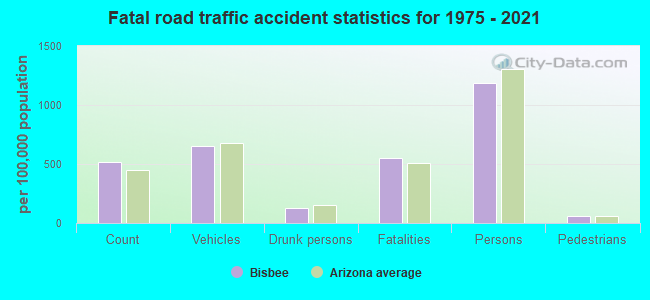
Officers per 1,000 residents here:
1.96Arizona average:
1.75
Latest news from Bisbee, AZ collected exclusively by city-data.com from local newspapers, TV, and radio stations
Ancestries: German (15.0%), English (10.7%), Irish (8.7%), American (6.4%), Dutch (3.6%), European (2.1%).
Current Local Time:
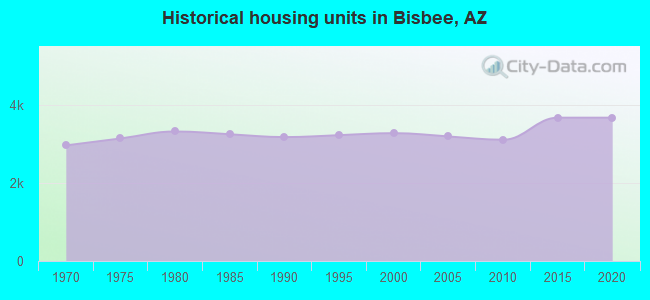
Land area: 4.81 square miles.
Population density: 1,041 people per square mile (low).
353 residents are foreign born (4.9% Latin America , 1.8% Europe ).
This city:
7.1%Arizona:
13.0%
Median real estate property taxes paid for housing units with mortgages in 2022: $1,211 (0.6%)Median real estate property taxes paid for housing units with no mortgage in 2022: $1,178 (0.5%)
Nearest city with pop. 50,000+: Arivaca, AZ
Nearest city with pop. 200,000+: Tucson, AZ
Nearest city with pop. 1,000,000+: Phoenix, AZ
Nearest cities:
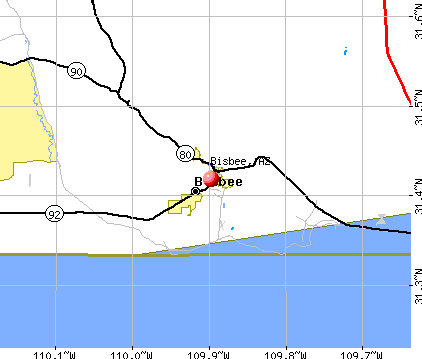
Latitude: 31.42 N, Longitude: 109.90 W
Daytime population change due to commuting: +1,147 (+23.0%)Workers who live and work in this city: 1,160 (71.6%)
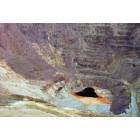
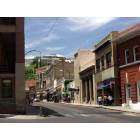
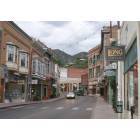
Bisbee tourist attractions:
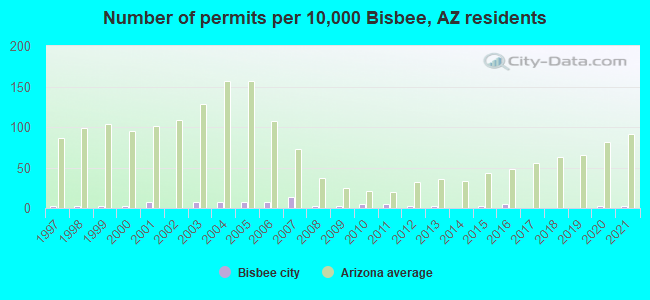
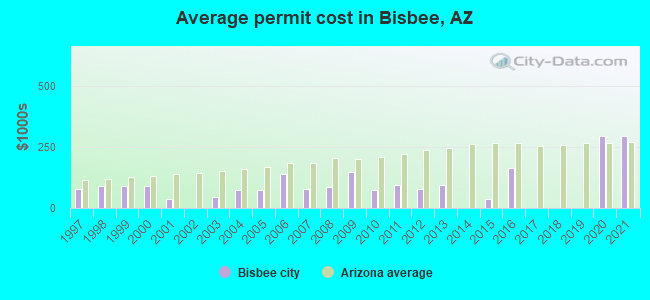
Single-family new house construction building permits:
2021: 2 buildings , average cost: $296,8002020: 2 buildings , average cost: $296,8002016: 3 buildings , average cost: $163,2002015: 1 building , cost: $39,1002013: 2 buildings , average cost: $94,7002012: 2 buildings , average cost: $77,4002011: 3 buildings , average cost: $93,4002010: 3 buildings , average cost: $76,3002009: 1 building , cost: $147,9002008: 2 buildings , average cost: $85,6002007: 8 buildings , average cost: $77,2002006: 5 buildings , average cost: $140,8002005: 5 buildings , average cost: $74,8002004: 4 buildings , average cost: $74,8002003: 4 buildings , average cost: $46,2002001: 4 buildings , average cost: $38,6002000: 1 building , cost: $90,0001999: 1 building , cost: $90,0001998: 1 building , cost: $90,0001997: 2 buildings , average cost: $80,000Unemployment in December 2023:
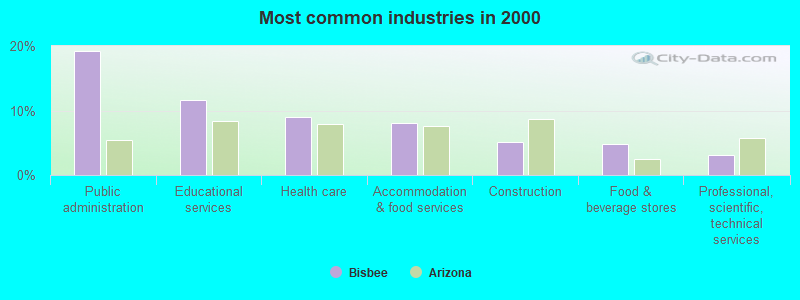
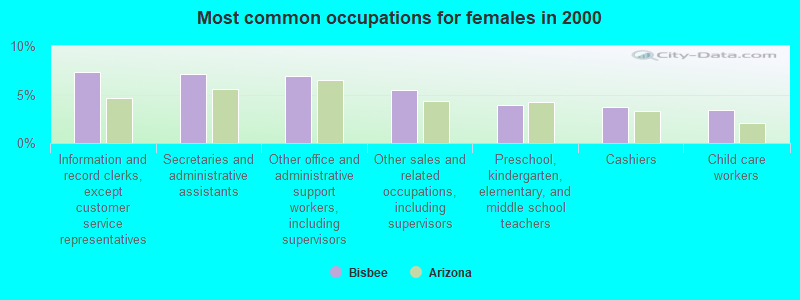
Most common occupations in Bisbee, AZ (%)
Both Males Females
Law enforcement workers, including supervisors (7.6%)
Other management occupations, except farmers and farm managers (4.9%)
Building and grounds cleaning and maintenance occupations (4.7%)
Information and record clerks, except customer service representatives (4.6%)
Other sales and related occupations, including supervisors (4.5%)
Other office and administrative support workers, including supervisors (4.3%)
Secretaries and administrative assistants (3.6%)
Law enforcement workers, including supervisors (14.2%)
Other management occupations, except farmers and farm managers (7.6%)
Building and grounds cleaning and maintenance occupations (6.5%)
Laborers and material movers, hand (3.9%)
Material recording, scheduling, dispatching, and distributing workers (3.8%)
Other sales and related occupations, including supervisors (3.5%)
Other production occupations, including supervisors (3.1%)
Information and record clerks, except customer service representatives (7.3%)
Secretaries and administrative assistants (7.1%)
Other office and administrative support workers, including supervisors (7.0%)
Other sales and related occupations, including supervisors (5.4%)
Preschool, kindergarten, elementary, and middle school teachers (3.9%)
Cashiers (3.7%)
Child care workers (3.4%)
Air pollution and air quality trends(lower is better)
AQI PM10 PM2.5
Earthquake activity:
Bisbee-area historical earthquake activity is significantly above Arizona state average. It is 950% greater than the overall U.S. average. On 6/28/1992 at 11:57:34, a magnitude 7.6 (6.2 MB, 7.6 MS, 7.3 MW, Depth: 0.7 mi, Class: Major, Intensity: VIII - XII) earthquake occurred 430.4 miles away from Bisbee center, causing 3 deaths ( 1 shaking deaths, 2 other deaths) and 400 injuries, causing $100,000,000 total damage and $40,000,000 insured lossesOn 5/19/1940 at 04:36:40, a magnitude 7.2 (7.2 UK) earthquake occurred 361.1 miles away from Bisbee center, causing $33,000,000 total damage On 12/31/1934 at 18:45:56, a magnitude 7.1 (7.1 UK) earthquake occurred 354.7 miles away from the city center On 1/4/2006 at 08:32:32, a magnitude 6.6 (6.6 MW, Depth: 8.7 mi, Class: Strong, Intensity: VII - IX) earthquake occurred 261.5 miles away from the city center On 10/15/1979 at 23:16:54, a magnitude 7.0 (5.7 MB, 6.9 MS, 7.0 ML, 6.4 MW) earthquake occurred 349.9 miles away from the city center On 10/16/1999 at 09:46:44, a magnitude 7.4 (6.3 MB, 7.4 MS, 7.2 MW, 7.3 ML) earthquake occurred 435.5 miles away from the city center Magnitude types: body-wave magnitude (MB), local magnitude (ML), surface-wave magnitude (MS), moment magnitude (MW) Natural disasters: The number of natural disasters in Cochise County (12) is smaller than the US average (15).Major Disasters (Presidential) Declared: 5Emergencies Declared: 2Fires: 4, Floods: 4, Storms: 4, Drought: 1, Flash Flood: 1, Heavy Rain: 1, Hurricane: 1, Tornado: 1, Wind: 1, Other: 1 (Note: some incidents may be assigned to more than one category). Hospitals and medical centers in Bisbee: COPPER QUEEN COMMUNITY HOSPITAL (Voluntary non-profit - Private, provides emergency services, 101 COLE AVENUE) COPPER VALLEY HOME HEALTH (101 COLE AVENUE)
Colleges/universities with over 2000 students nearest to Bisbee:
Cochise College (about 13 miles; Douglas, AZ ; Full-time enrollment: 8,597)
Pima Community College (about 81 miles; Tucson, AZ ; FT enrollment: 18,794)
Pima Medical Institute-Tucson (about 84 miles; Tucson, AZ ; FT enrollment: 2,357)
University of Arizona (about 84 miles; Tucson, AZ ; FT enrollment: 36,324)
Eastern Arizona College (about 99 miles; Thatcher, AZ ; FT enrollment: 3,810)
Western New Mexico University (about 134 miles; Silver City, NM ; FT enrollment: 2,456)
Central Arizona College (about 148 miles; Coolidge, AZ ; FT enrollment: 4,893)
Public schools in Bisbee:
See full list of schools located in Bisbee Libraries in Bisbee: COCHISE COUNTY LIBRARY DISTRICT Operating income: $1,233,138; Location: 100 CLAWSON STREET; 101,629 books ; 4,215 audio materials ; 4,638 video materials ; 3 local licensed databases ; 39 state licensed databases ; 70 print serial subscriptions )
COPPER QUEEN LIBRARY Operating income: $213,552; Location: 6 MAIN STREET; 33,445 books ; 1,296 audio materials ; 2,629 video materials ; 1 local licensed databases ; 36 state licensed databases ; 3 other licensed databases ; 112 print serial subscriptions )
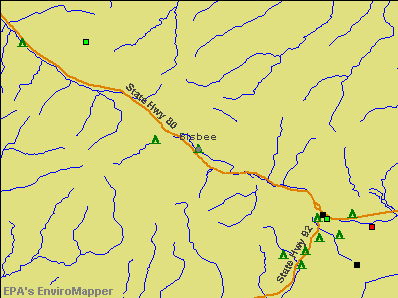
Notable locations in Bisbee: (A) , Bisbee Mining and Historical Museum (B) , Cooper Queen Community Hospital (C) , Bisbee Fire Station Number 2 (D) , Bisbee City Hall (E) , Bisbee Railroad Station (F) , Cochise County Courthouse (G) , Warren Railroad Station (H) , Phelps Dodge General Office Building (I) . Display/hide their locations on the map
Churches in Bisbee include: (A) , New Life Assembly of God Church (B) , First Assembly of God (C) , Bisbee Covenant Presbyterian Church (D) , Trinity United Methodist Church (E) , The Church of Jesus Christ of Latter Day Saints (F) , Saint Stephen Nemanja Church (G) , Saint Patrick Catholic Church (H) , Grace Lutheran Church (I) . Display/hide their locations on the map
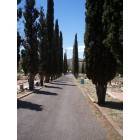
Cemetery: (1) . Display/hide its location on the map
Park in Bisbee: (1) . Display/hide its location on the map
Tourist attractions:
Hotels:
Courts:
Birthplace of: Lewis Williams Douglas - Politician and businessman, Gabe Lindstrom - 2005 NFL player (Chicago Bears, born : May 25, 1976), Miguel Méndez - Writer, Earl Hindman - Film actor, Mitch Hoopes - Football player.
Cochise County has a predicted average indoor radon screening level between 2 and 4 pCi/L (pico curies per liter) - Moderate Potential Drinking water stations with addresses in Bisbee and their reported violations in the past:
BISBEE DOUGLAS INTL AIRPORT (Address: 1415 W MELODY LN Population served: 2,300, Groundwater):
Past health violations:
MCL, Acute (TCR) - In AUG-2012, Contaminant: Coliform. Follow-up actions: St Compliance achieved (NOV-01-2012)
MCL, Monthly (TCR) - In AUG-2012, Contaminant: Coliform. Follow-up actions: St Violation/Reminder Notice (OCT-04-2012), St Compliance achieved (NOV-01-2012)
MCL, Monthly (TCR) - In JUL-2011, Contaminant: Coliform. Follow-up actions: St Violation/Reminder Notice (SEP-06-2011), St Compliance achieved (NOV-17-2011)
MCL, Monthly (TCR) - In AUG-2010, Contaminant: Coliform. Follow-up actions: St Violation/Reminder Notice (SEP-30-2010), St Compliance achieved (MAY-11-2011)
Past monitoring violations:
Monitoring and Reporting (DBP) - Between OCT-2012 and DEC-2012, Contaminant: Chlorine. Follow-up actions: St Violation/Reminder Notice (APR-02-2013), St Compliance achieved (JUN-26-2013)
Monitoring, Repeat Major (TCR) - In AUG-2012, Contaminant: Coliform (TCR). Follow-up actions: St Violation/Reminder Notice (OCT-04-2012), St Compliance achieved (NOV-01-2012)
Monitoring and Reporting (DBP) - Between APR-2012 and JUN-2012, Contaminant: Chlorine. Follow-up actions: St Compliance achieved (AUG-17-2012)
Monitoring and Reporting (DBP) - Between JAN-2012 and MAR-2012, Contaminant: Chlorine. Follow-up actions: St Compliance achieved (AUG-17-2012)
Monitoring, Repeat Major (TCR) - In JUL-2011, Contaminant: Coliform (TCR). Follow-up actions: St Violation/Reminder Notice (SEP-06-2011), St Compliance achieved (NOV-17-2011)
2 routine major monitoring violations
7 minor monitoring violations
18 other older monitoring violations
Average household size: This city:
2.0 peopleArizona:
2.6 people
Percentage of family households: This city:
47.6%Whole state:
66.2%
Percentage of households with unmarried partners: This city:
7.7%Whole state:
7.8%
Likely homosexual households (counted as self-reported same-sex unmarried-partner households)
Lesbian couples: 1.1% of all households Gay men: 0.7% of all households
People in group quarters in Bisbee in 2010:
206 people in local jails and other municipal confinement facilities
17 people in group homes intended for adults
8 people in residential treatment centers for adults
6 people in emergency and transitional shelters (with sleeping facilities) for people experiencing homelessness
5 people in other noninstitutional facilities
People in group quarters in Bisbee in 2000:
20 people in nursing homes
19 people in other nonhousehold living situations
15 people in other noninstitutional group quarters
7 people in homes for the mentally retarded
Banks with branches in Bisbee (2011 data):
Bank of America, National Association: Bisbee Branch at 10 Bisbee Road, branch established on 1956/12/17. Info updated 2009/11/18: Bank assets: $1,451,969.3 mil, Deposits: $1,077,176.8 mil, headquarters in Charlotte, NC, positive income , 5782 total offices , Holding Company: Bank Of America Corporation
National Bank of Arizona: Bisbee Branch at 101 Naco Highway, branch established on 1956/02/06. Info updated 2008/09/11: Bank assets: $4,485.6 mil, Deposits: $3,731.3 mil, headquarters in Tucson, AZ, positive income , Commercial Lending Specialization, 73 total offices , Holding Company: Zions Bancorporation
For population 15 years and over in Bisbee:
Never married: 24.6%Now married: 39.6%Separated: 2.4%Widowed: 11.6%Divorced: 21.8% For population 25 years and over in Bisbee:
High school or higher: 88.7%Bachelor's degree or higher: 33.7%Graduate or professional degree: 13.1%Unemployed: 8.1%Mean travel time to work (commute): 10.0 minutes
Education Gini index (Inequality in education) Here:
11.6Arizona average:
12.2
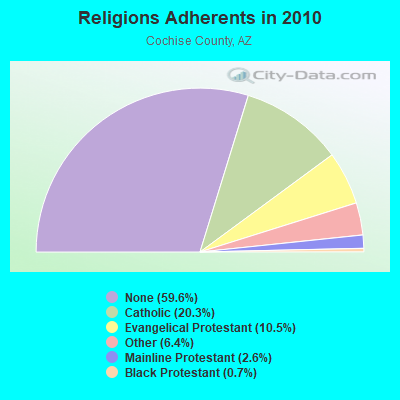
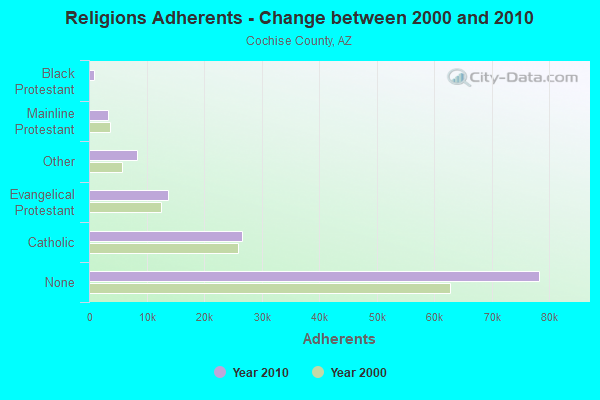
Religion statistics for Bisbee, AZ (based on Cochise County data)
Religion Adherents Congregations Catholic 26,615 16 Evangelical Protestant 13,773 131 Other 8,384 30 Mainline Protestant 3,386 26 Black Protestant 862 3 Orthodox 50 1 None 78,276 -
Source: Clifford Grammich, Kirk Hadaway, Richard Houseal, Dale E.Jones, Alexei Krindatch, Richie Stanley and Richard H.Taylor. 2012. 2010 U.S.Religion Census: Religious Congregations & Membership Study. Association of Statisticians of American Religious Bodies. Jones, Dale E., et al. 2002. Congregations and Membership in the United States 2000. Nashville, TN: Glenmary Research Center. Graphs represent county-level data
Food Environment Statistics: Number of grocery stores : 16This county :
1.25 / 10,000 pop.Arizona :
1.36 / 10,000 pop.
Number of convenience stores (no gas) : 8Cochise County :
0.63 / 10,000 pop.State :
0.55 / 10,000 pop.
Number of convenience stores (with gas) : 56This county :
4.38 / 10,000 pop.State :
2.47 / 10,000 pop.
Number of full-service restaurants : 100This county :
7.82 / 10,000 pop.Arizona :
6.21 / 10,000 pop.
Adult diabetes rate : Cochise County :
8.4%State :
8.0%
Adult obesity rate : Cochise County :
22.4%Arizona :
22.8%
Low-income preschool obesity rate : This county :
9.0%Arizona :
14.2%
Health and Nutrition:
Average overall health of teeth and gums : Average BMI : This city:
28.6Arizona:
28.5
People feeling badly about themselves : Bisbee:
23.3%Arizona:
20.8%
People not drinking alcohol at all : Average hours sleeping at night : Overweight people : This city:
36.2%Arizona:
33.5%
General health condition : This city:
53.3%Arizona:
56.1%
Average condition of hearing : More about Health and Nutrition of Bisbee, AZ Residents
Local government employment and payroll (March 2022)
Function
Full-time employees
Monthly full-time payroll
Average yearly full-time wage
Part-time employees
Monthly part-time payroll
Police Protection - Officers
16 $91,099 $68,324 0 $0 Firefighters
16 $93,938 $70,454 0 $0 Other and Unallocable
11 $35,087 $38,277 12 $19,601 Other Government Administration
9 $45,578 $60,771 12 $4,121 Solid Waste Management
7 $28,466 $48,799 0 $0 Sewerage
6 $35,006 $70,012 0 $0 Financial Administration
4 $24,157 $72,471 1 $906 Police - Other
2 $15,379 $92,274 12 $16,662 Streets and Highways
2 $7,644 $45,864 0 $0 Local Libraries
2 $9,192 $55,152 1 $2,001 Parks and Recreation
2 $6,826 $40,956 0 $0
Totals for Government
77 $392,372 $61,149 38 $43,291
Bisbee government finances - Expenditure in 2017 (per resident):
Construction - Transit Utilities: $121,000 ($24.16)
Current Operations - Local Fire Protection: $2,486,000 ($496.41)
Police Protection: $1,692,000 ($337.86)Regular Highways: $1,530,000 ($305.51)General - Other: $921,000 ($183.91)Solid Waste Management: $733,000 ($146.37)Sewerage: $718,000 ($143.37)Central Staff Services: $511,000 ($102.04)Financial Administration: $363,000 ($72.48)Parks and Recreation: $272,000 ($54.31)Transit Utilities: $264,000 ($52.72)Libraries: $130,000 ($25.96)Housing and Community Development: $123,000 ($24.56)Judicial and Legal Services: $105,000 ($20.97)Protective Inspection and Regulation - Other: $66,000 ($13.18)General Public Buildings: $28,000 ($5.59)Air Transportation: $25,000 ($4.99)Miscellaneous Commercial Activities - Other: $6,000 ($1.20)General - Interest on Debt: $341,000 ($68.09)
Other Capital Outlay - General - Other: $54,000 ($10.78)
Sewerage: $52,000 ($10.38)Regular Highways: $36,000 ($7.19)Solid Waste Management: $10,000 ($2.00)
Bisbee government finances - Revenue in 2017 (per resident):
Charges - Other: $2,410,000 ($481.23)
Sewerage: $2,390,000 ($477.24)Solid Waste Management: $849,000 ($169.53)Air Transportation: $14,000 ($2.80)Regular Highways: $12,000 ($2.40)Miscellaneous - Donations From Private Sources: $129,000 ($25.76)
General Revenue - Other: $108,000 ($21.57)Rents: $54,000 ($10.78)Interest Earnings: $6,000 ($1.20)Fines and Forfeits: $1,000 ($0.20)Revenue - Transit Utilities: $15,000 ($3.00)
State Intergovernmental - General Local Government Support: $1,406,000 ($280.75)
Highways: $417,000 ($83.27)Transit Utilities: $338,000 ($67.49)Other: $21,000 ($4.19)Sewerage: $17,000 ($3.39)Tax - General Sales and Gross Receipts: $2,431,000 ($485.42)
Property: $975,000 ($194.69)Other Selective Sales: $148,000 ($29.55)Other License: $97,000 ($19.37)
Bisbee government finances - Debt in 2017 (per resident):
Long Term Debt - Beginning Outstanding - Public Debt for Private Purpose: $16,657,000 ($3326.08)
Outstanding Nonguaranteed - Industrial Revenue: $16,622,000 ($3319.09)Beginning Outstanding - Unspecified Public Purpose: $11,913,000 ($2378.79)Outstanding Unspecified Public Purpose: $11,086,000 ($2213.66)Retired Unspecified Public Purpose: $827,000 ($165.14)Retired Nonguaranteed - Public Debt for Private Purpose: $35,000 ($6.99)
Bisbee government finances - Cash and Securities in 2017 (per resident):
Other Funds - Cash and Securities: $4,837,000 ($965.85)
Sinking Funds - Cash and Securities: $16,622,000 ($3319.09)
9.42% of this county's 2021 resident taxpayers lived in other counties in 2020 ($51,360 average adjusted gross income )
Here:
9.42%Arizona average:
6.85%
0.25% of residents moved from foreign countries ($1,783 average AGI )Cochise County:
0.25%Arizona average:
0.03%
Top counties from which taxpayers relocated into this county between 2020 and 2021:
8.17% of this county's 2020 resident taxpayers moved to other counties in 2021 ($52,501 average adjusted gross income )
Here:
8.17%Arizona average:
5.72%
0.20% of residents moved to foreign countries ($1,711 average AGI )Cochise County:
0.20%Arizona average:
0.03%
Top counties to which taxpayers relocated from this county between 2020 and 2021:
Businesses in Bisbee, AZ
Name Count Name Count
Ace Hardware 1 H&R Block 1 Alco Stores 1 Safeway 1 Burger King 1 Starbucks 1 Circle K 1 U-Haul 1 Dairy Queen 1 UPS 2 FedEx 2 Vons 1
Strongest AM radio stations in Bisbee:
KFLT (830 AM; 50 kW; TUCSON, AZ; Owner: FAMILY LIFE B/CING SYSTEM, INC.)
KAPR (930 AM; 2 kW; DOUGLAS, AZ)
KUAZ (1550 AM; daytime; 50 kW; TUCSON, AZ; Owner: ARIZONA BOARD OF REGENTS)
KNXN (1470 AM; 2 kW; SIERRA VISTA, AZ; Owner: GOOD MUSIC, INC.)
KTAN (1420 AM; 2 kW; SIERRA VISTA, AZ; Owner: COMMONWEALTH LICENSE SUBSIDIARY, LLC)
KDAP (1450 AM; 1 kW; DOUGLAS, AZ; Owner: KASA RADIO HOGAR, INC.)
KQTL (1210 AM; 10 kW; SAHUARITA, AZ; Owner: RADIO UNICA OF TUCSON LICENSE CORP.)
KMIA (710 AM; 50 kW; BLACK CANYON CITY, AZ; Owner: ENTRAVISION HOLDINGS, LLC)
KTKT (990 AM; 10 kW; TUCSON, AZ; Owner: ARIZONA LOTUS CORP.)
KHIL (1250 AM; 5 kW; WILLCOX, AZ; Owner: LAKESHORE MEDIA, LLC)
KEVT (1030 AM; 10 kW; CORTARO, AZ; Owner: ONE MART CORP.)
KFNX (1100 AM; 50 kW; CAVE CREEK, AZ; Owner: NORTH AMERICAN BROADCASTING CO., INC.)
KMIK (1580 AM; 50 kW; TEMPE, AZ; Owner: ABC, INC.)
Strongest FM radio stations in Bisbee:
KRMB (90.1 FM; BISBEE, AZ; Owner: WORLD RADIO NETWORK, INC.)
KCDQ (95.3 FM; DOUGLAS, AZ; Owner: COCHISE BROADCASTING, LLC (A WYOMING LLC))
KWCD (92.3 FM; BISBEE, AZ; Owner: COMMONWEALTH LICENSE SUBSIDIARY, LLC)
KWRB (90.9 FM; BISBEE, AZ; Owner: WORLD RADIO NETWORK, INC.)
KWCX-FM (104.9 FM; WILLCOX, AZ; Owner: LAKESHORE MEDIA, LLC)
KGMG (106.3 FM; ORACLE, AZ; Owner: JOURNAL BROADCAST CORPORATION)
KXKQ (94.1 FM; SAFFORD, AZ; Owner: MCMURRAY COMMUNICATIONS, INC.)
K255AC (98.9 FM; TUCSON, AZ; Owner: MARICOPA COUNTY COMMUN. COLLEGE DIST)
KXCI (91.3 FM; TUCSON, AZ; Owner: FOUNDATION FOR CREATIVE BROADCASTING, INC.)
KZLZ-FM2 (105.3 FM; TUCSON, AZ; Owner: ENTRAVISION HOLDINGS, LLC)
K263AA (100.5 FM; TUCSON, AZ; Owner: EDUCATIONAL MEDIA FOUNDATION)
KUAT-FM (90.5 FM; TUCSON, AZ; Owner: ARIZONA BOARD OF REGENTS)
KKYZ (101.7 FM; SIERRA VISTA, AZ; Owner: COCHISE BROADCASTING, LLC (A WYOMING LLC))
K205CG (88.9 FM; BISBEE-DOUGLAS, AZ; Owner: AZ. BD. OF REGENTS FOR UNIV. OF AZ.)
TV broadcast stations around Bisbee:
K33CG (Channel 33; SIERRA VISTA, AZ; Owner: RICHARD RICHARDS)
K28EY (Channel 28; DOUGLAS, AZ; Owner: NBC TELEMUNDO PHOENIX, INC.)
K20FO (Channel 20; SIERRA VISTA, AZ; Owner: KVOA COMMUNICATIONS, INC.)
National Bridge Inventory (NBI) Statistics 32 Number of bridges161ft / 48.8m Total length $8,000 Total costs253,570 Total average daily traffic24,627 Total average daily truck traffic
New bridges - historical statistics
1 1900-1909 1 1910-1919 2 1920-1929 8 1930-1939 6 1940-1949 2 1950-1959 8 1960-1969 1 1980-1989 1 1990-1999 2 2000-2009
See full National Bridge Inventory statistics for Bisbee, AZ
Fire-safe hotels and motels in Bisbee, Arizona:
The Bisbee Inn, 45 Ok St, Bisbee, Arizona 85603 Phone: (520) 432-5131
Eldorado Suites Hotel, 55 Ok St, Bisbee, Arizona 85603 Phone: (520) 432-6679
Americas Best Value Inn, 1372 Hwy 92, Bisbee, Arizona 85603 Phone: (520) 432-2293, Fax: (520) 432-7738
San Jose Lodge, 1002 Naco Hwy 1, Bisbee, Arizona 85603 Phone: (520) 432-5761, Fax: (520) 432-4302
All 4 fire-safe hotels and motels in Bisbee, Arizona
Most common first names in Bisbee, AZ among deceased individuals Name Count Lived (average)
John 81 75.5 years James 76 73.5 years Mary 69 78.0 years William 68 74.8 years Robert 65 70.0 years Charles 47 76.2 years George 46 73.2 years Frank 39 74.2 years Margaret 33 81.9 years Ruth 31 80.4 years
Most common last names in Bisbee, AZ among deceased individuals Last name Count Lived (average)
Smith 34 74.0 years Jones 19 74.8 years Williams 19 76.6 years Johnson 16 77.4 years Lopez 16 77.2 years Martinez 16 69.9 years Wright 16 80.4 years Chavez 15 77.6 years Romero 14 69.7 years Garcia 14 72.7 years
Bisbee compared to Arizona state average:
Median household income below state average. Median house value below state average. Unemployed percentage below state average. Black race population percentage significantly below state average. Median age significantly above state average. Foreign-born population percentage below state average. Length of stay since moving in significantly above state average. House age significantly above state average. Institutionalized population percentage above state average. Number of college students significantly below state average.
#2 on the list of "Top 101 cities with the largest percentage of divorced people (15+ years)(population 5,000+)"
#4 on the list of "Top 101 cities with the most users submitting photos to our site per 10,000 residents (population 5,000+)"
#33 on the list of "Top 101 cities with the highest number of assaults per 100,000 residents, excludes tourist destinations and others with a lot of outsiders visiting based on city industries data (population 5,000+)"
#36 on the list of "Top 101 cities with the largest percentage of likely lesbian couples (counted as self-reported female-female unmarried-partner households) (population 5,000+)"
#52 on the list of "Top 101 cities with the lowest number of burglaries per 100,000 residents (population 5,000+)"
#56 on the list of "Top 101 cities with the most residents born in Other South America (population 500+)"
#60 on the list of "Top 101 cities with the largest percentage of likely homosexual households (counted as self-reported same-sex unmarried-partner households) (population 5,000+)"
#99 on the list of "Top 101 cities with largest percentage of females in occupations: food preparation and serving related occupations (population 5,000+)"
#3 on the list of "Top 101 counties with the lowest percentage of residents that visited a dentist within the past year"
#11 on the list of "Top 101 counties with the highest Ozone (1-hour) air pollution readings in 2012 (ppm)"
#16 on the list of "Top 101 counties with the highest percentage of residents that smoked 100+ cigarettes in their lives"
#17 on the list of "Top 101 counties with the highest Particulate Matter (PM10 ) Annual air pollution readings in 2012 (µg/m3 )"
#19 on the list of "Top 101 counties with the highest percentage of residents relocating to foreign countries in 2011 (pop. 50,000+)"
Top Patent Applicants
Jose Santos Dominguez (3)
Nancy M. Pipkorn (1)
Randall E. Pipkorn (1)
Christopher Vaaler (1)
Michael Rissman (1)
Total of 7 patent applications in 2008-2024.


 Recent articles from our blog. Our writers, many of them Ph.D. graduates or candidates, create easy-to-read articles on a wide variety of topics.

 (80.6 miles