Races in Canyon Lake, Texas (TX) Detailed Stats
Data:
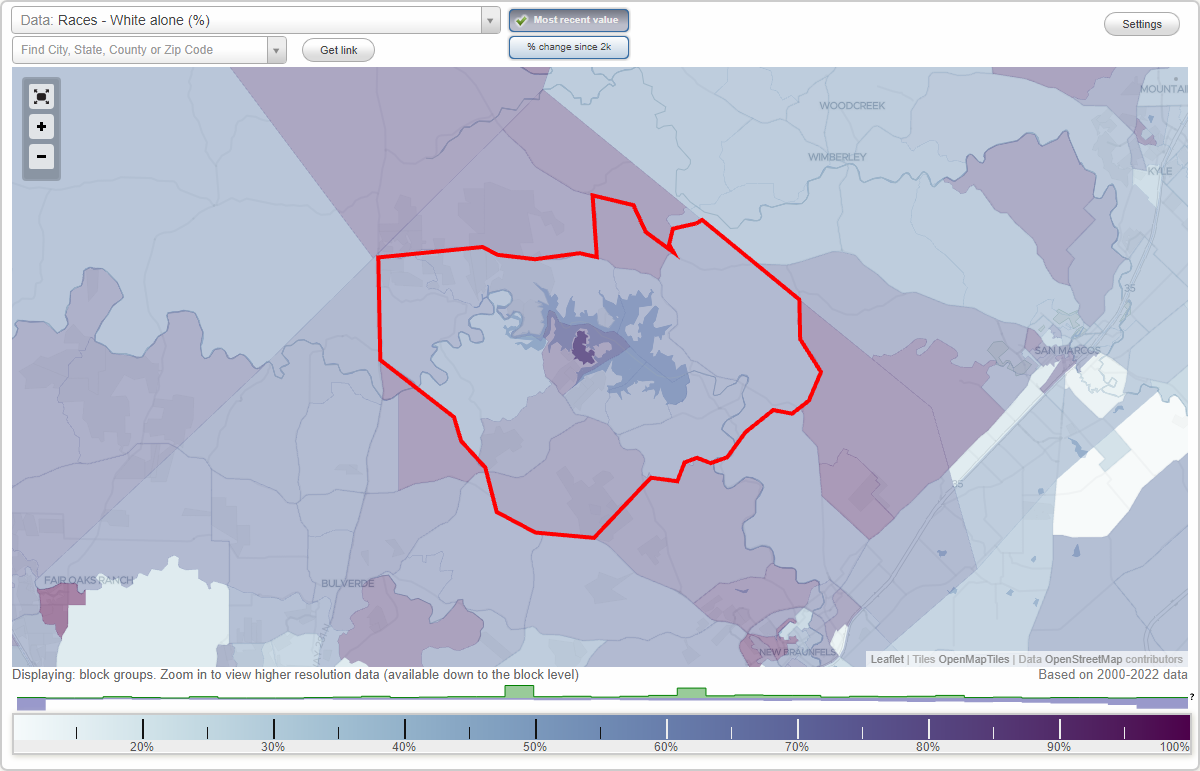
Races - White alone (%)
Races - White alone (% change since 2000)
Races - Black alone (%)
Races - Black alone (% change since 2000)
Races - American Indian alone (%)
Races - American Indian alone (% change since 2000)
Races - Asian alone (%)
Races - Asian alone (% change since 2000)
Races - Hispanic (%)
Races - Hispanic (% change since 2000)
Races - Native Hawaiian and Other Pacific Islander alone (%)
Races - Native Hawaiian and Other Pacific Islander alone (% change since 2000)
Races - Two or more races(%)
Races - Two or more races(% change since 2000)
Races - Other race alone (%)
Races - Other race alone (% change since 2000)
Racial diversity
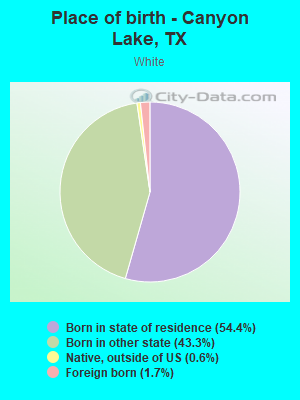
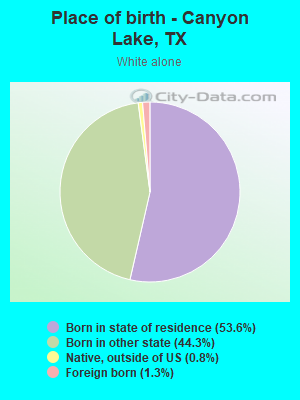
Place of birth - Born in state of residence (%)
Place of birth - Born in state of residence (%) - White
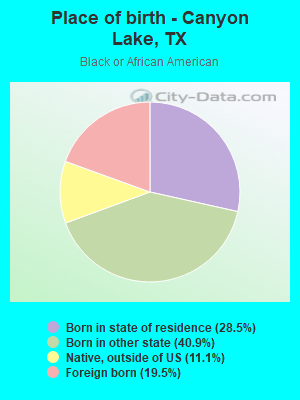
Place of birth - Born in state of residence (%) - Black or African American
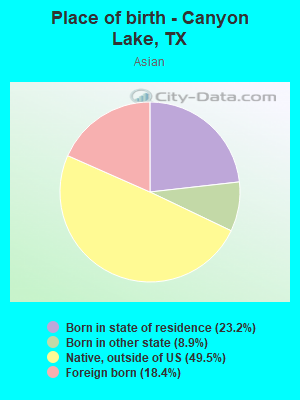
Place of birth - Born in state of residence (%) - Asian
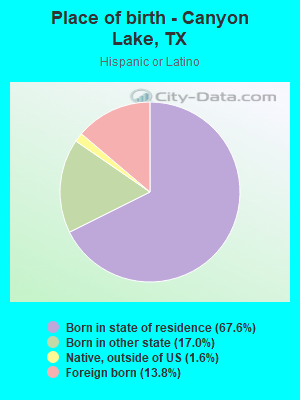
Place of birth - Born in state of residence (%) - Hispanic or Latino
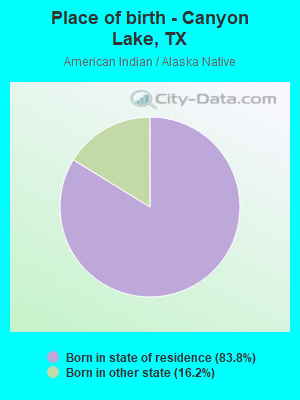
Place of birth - Born in state of residence (%) - American Indian and Alaska Native
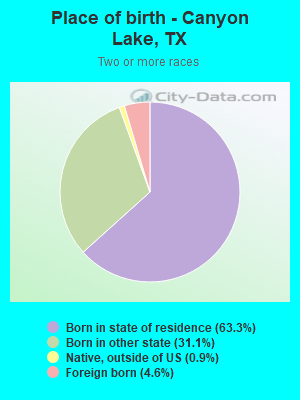
Place of birth - Born in state of residence (%) - Multirace
Place of birth - Born in state of residence (%) - Other Race
Place of birth - Born in other state (%)
Place of birth - Born in other state (%) - White
Place of birth - Born in other state (%) - Black or African American
Place of birth - Born in other state (%) - Asian
Place of birth - Born in other state (%) - Hispanic or Latino
Place of birth - Born in other state (%) - American Indian and Alaska Native
Place of birth - Born in other state (%) - Multirace
Place of birth - Born in other state (%) - Other Race
Place of birth - Native, outside of US (%)
Place of birth - Native, outside of US (%) - White
Place of birth - Native, outside of US (%) - Black or African American
Place of birth - Native, outside of US (%) - Asian
Place of birth - Native, outside of US (%) - Hispanic or Latino
Place of birth - Native, outside of US (%) - American Indian and Alaska Native
Place of birth - Native, outside of US (%) - Multirace
Place of birth - Native, outside of US (%) - Other Race
Place of birth - Foreign born (%)
Place of birth - Foreign born (%) - White
Place of birth - Foreign born (%) - Black or African American
Place of birth - Foreign born (%) - Asian
Place of birth - Foreign born (%) - Hispanic or Latino
Place of birth - Foreign born (%) - American Indian and Alaska Native
Place of birth - Foreign born (%) - Multirace
Place of birth - Foreign born (%) - Other Race
Residents speaking English at home (%)
Residents speaking English at home - Born in the United States (%)
Residents speaking English at home - Native, born elsewhere (%)
Residents speaking English at home - Foreign born (%)
Residents speaking Spanish at home (%)
Residents speaking Spanish at home - Born in the United States (%)
Residents speaking Spanish at home - Native, born elsewhere (%)
Residents speaking Spanish at home - Foreign born (%)
Residents speaking other language at home (%)
Residents speaking other language at home - Born in the United States (%)
Residents speaking other language at home - Native, born elsewhere (%)
Residents speaking other language at home - Foreign born (%)
Marital status - Never married (%)
Marital status - Now married (%)
Marital status - Separated (%)
Marital status - Widowed (%)
Marital status - Divorced (%)
Ancestries Reported - Arab (%)
Ancestries Reported - Czech (%)
Ancestries Reported - Danish (%)
Ancestries Reported - Dutch (%)
Ancestries Reported - English (%)
Ancestries Reported - French (%)
Ancestries Reported - French Canadian (%)
Ancestries Reported - German (%)
Ancestries Reported - Greek (%)
Ancestries Reported - Hungarian (%)
Ancestries Reported - Irish (%)
Ancestries Reported - Italian (%)
Ancestries Reported - Lithuanian (%)
Ancestries Reported - Norwegian (%)
Ancestries Reported - Polish (%)
Ancestries Reported - Portuguese (%)
Ancestries Reported - Russian (%)
Ancestries Reported - Scotch-Irish (%)
Ancestries Reported - Scottish (%)
Ancestries Reported - Slovak (%)
Ancestries Reported - Subsaharan African (%)
Ancestries Reported - Swedish (%)
Ancestries Reported - Swiss (%)
Ancestries Reported - Ukrainian (%)
Ancestries Reported - United States (%)
Ancestries Reported - Welsh (%)
Ancestries Reported - West Indian (%)
Ancestries Reported - Other (%)
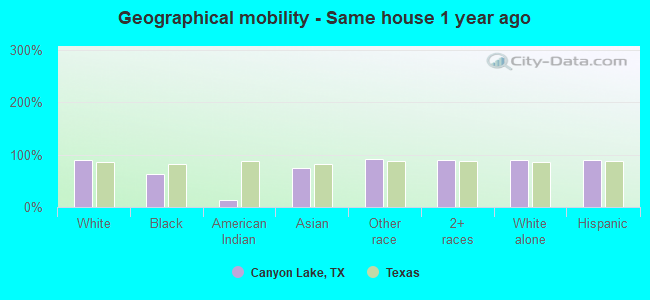
Geographical mobility - Same house 1 year ago (%)
Geographical mobility - Same house 1 year ago (%) - White
Geographical mobility - Same house 1 year ago (%) - Black or African American
Geographical mobility - Same house 1 year ago (%) - Asian
Geographical mobility - Same house 1 year ago (%) - Hispanic or Latino
Geographical mobility - Same house 1 year ago (%) - American Indian and Alaska Native
Geographical mobility - Same house 1 year ago (%) - Multirace
Geographical mobility - Same house 1 year ago (%) - Other Race
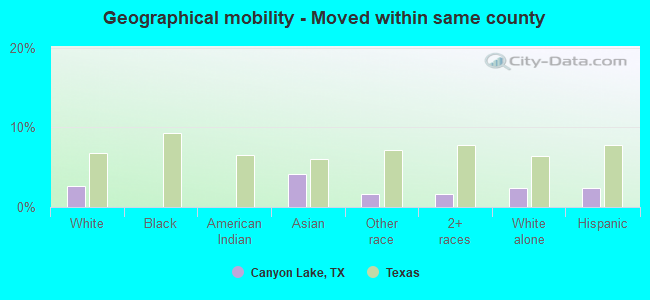
Geographical mobility - Moved within same county (%)
Geographical mobility - Moved within same county (%) - White
Geographical mobility - Moved within same county (%) - Black or African American
Geographical mobility - Moved within same county (%) - Asian
Geographical mobility - Moved within same county (%) - Hispanic or Latino
Geographical mobility - Moved within same county (%) - American Indian and Alaska Native
Geographical mobility - Moved within same county (%) - Multirace
Geographical mobility - Moved within same county (%) - Other Race
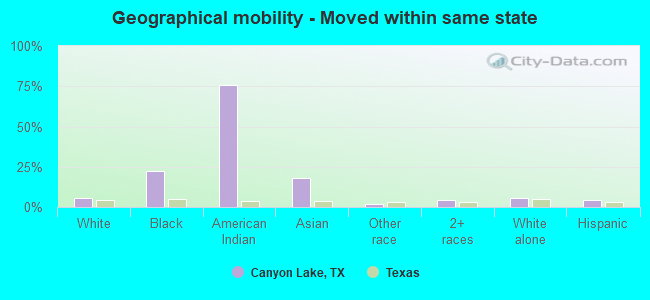
Geographical mobility - Moved from different county within same state (%)
Geographical mobility - Moved from different county within same state (%) - White
Geographical mobility - Moved from different county within same state (%) - Black or African American
Geographical mobility - Moved from different county within same state (%) - Asian
Geographical mobility - Moved from different county within same state (%) - Hispanic or Latino
Geographical mobility - Moved from different county within same state (%) - American Indian and Alaska Native
Geographical mobility - Moved from different county within same state (%) - Multirace
Geographical mobility - Moved from different county within same state (%) - Other Race
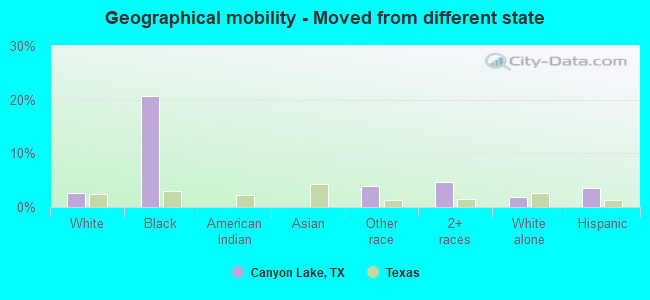
Geographical mobility - Moved from different state (%)
Geographical mobility - Moved from different state (%) - White
Geographical mobility - Moved from different state (%) - Black or African American
Geographical mobility - Moved from different state (%) - Asian
Geographical mobility - Moved from different state (%) - Hispanic or Latino
Geographical mobility - Moved from different state (%) - American Indian and Alaska Native
Geographical mobility - Moved from different state (%) - Multirace
Geographical mobility - Moved from different state (%) - Other Race
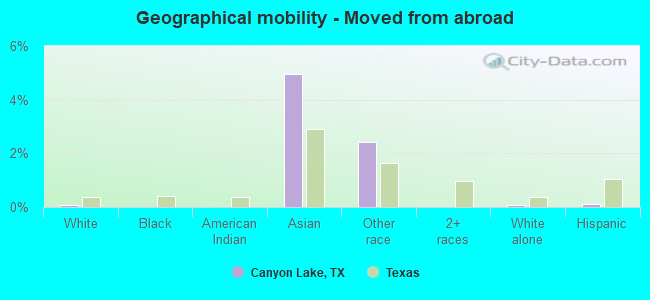
Geographical mobility - Moved from abroad (%)
Geographical mobility - Moved from abroad (%) - White
Geographical mobility - Moved from abroad (%) - Black or African American
Geographical mobility - Moved from abroad (%) - Asian
Geographical mobility - Moved from abroad (%) - Hispanic or Latino
Geographical mobility - Moved from abroad (%) - American Indian and Alaska Native
Geographical mobility - Moved from abroad (%) - Multirace
Geographical mobility - Moved from abroad (%) - Other Race
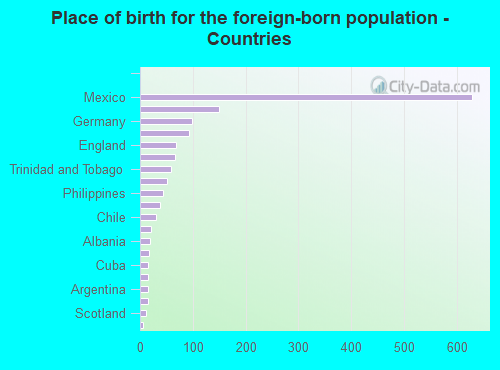
Place of birth for the foreign-born population - Ireland (%)
Place of birth for the foreign-born population - Denmark (%)
Place of birth for the foreign-born population - Norway (%)
Place of birth for the foreign-born population - Sweden (%)
Place of birth for the foreign-born population - United Kingdom (%)
Place of birth for the foreign-born population - England (%)
Place of birth for the foreign-born population - Scotland (%)
Place of birth for the foreign-born population - Other Northern Europe (%)
Place of birth for the foreign-born population - Austria (%)
Place of birth for the foreign-born population - Belgium (%)
Place of birth for the foreign-born population - France (%)
Place of birth for the foreign-born population - Germany (%)
Place of birth for the foreign-born population - Netherlands (%)
Place of birth for the foreign-born population - Switzerland (%)
Place of birth for the foreign-born population - Other Western Europe (%)
Place of birth for the foreign-born population - Greece (%)
Place of birth for the foreign-born population - Italy (%)
Place of birth for the foreign-born population - Portugal (%)
Place of birth for the foreign-born population - Spain (%)
Place of birth for the foreign-born population - Other Southern Europe (%)
Place of birth for the foreign-born population - Albania (%)
Place of birth for the foreign-born population - Belarus (%)
Place of birth for the foreign-born population - Bosnia and Herzegovina (%)
Place of birth for the foreign-born population - Bulgaria (%)
Place of birth for the foreign-born population - Croatia (%)
Place of birth for the foreign-born population - Czechoslovakia (%)
Place of birth for the foreign-born population - Hungary (%)
Place of birth for the foreign-born population - Latvia (%)
Place of birth for the foreign-born population - Lithuania (%)
Place of birth for the foreign-born population - North Macedonia (Macedonia) (%)
Place of birth for the foreign-born population - Moldova (%)
Place of birth for the foreign-born population - Poland (%)
Place of birth for the foreign-born population - Romania (%)
Place of birth for the foreign-born population - Russia (%)
Place of birth for the foreign-born population - Serbia (%)
Place of birth for the foreign-born population - Ukraine (%)
Place of birth for the foreign-born population - Other Eastern Europe (%)
Place of birth for the foreign-born population - China (%)
Place of birth for the foreign-born population - Hong Kong (%)
Place of birth for the foreign-born population - Taiwan (%)
Place of birth for the foreign-born population - Japan (%)
Place of birth for the foreign-born population - Korea (%)
Place of birth for the foreign-born population - Other Eastern Asia (%)
Place of birth for the foreign-born population - Afghanistan (%)
Place of birth for the foreign-born population - Bangladesh (%)
Place of birth for the foreign-born population - India (%)
Place of birth for the foreign-born population - Iran (%)
Place of birth for the foreign-born population - Kazakhstan (%)
Place of birth for the foreign-born population - Nepal (%)
Place of birth for the foreign-born population - Pakistan (%)
Place of birth for the foreign-born population - Sri Lanka (%)
Place of birth for the foreign-born population - Uzbekistan (%)
Place of birth for the foreign-born population - Other South Central Asia (%)
Place of birth for the foreign-born population - Burma (%)
Place of birth for the foreign-born population - Cambodia (%)
Place of birth for the foreign-born population - Indonesia (%)
Place of birth for the foreign-born population - Laos (%)
Place of birth for the foreign-born population - Malaysia (%)
Place of birth for the foreign-born population - Philippines (%)
Place of birth for the foreign-born population - Singapore (%)
Place of birth for the foreign-born population - Thailand (%)
Place of birth for the foreign-born population - Vietnam (%)
Place of birth for the foreign-born population - Other South Eastern Asia (%)
Place of birth for the foreign-born population - Armenia (%)
Place of birth for the foreign-born population - Iraq (%)
Place of birth for the foreign-born population - Israel (%)
Place of birth for the foreign-born population - Jordan (%)
Place of birth for the foreign-born population - Kuwait (%)
Place of birth for the foreign-born population - Lebanon (%)
Place of birth for the foreign-born population - Saudi Arabia (%)
Place of birth for the foreign-born population - Syria (%)
Place of birth for the foreign-born population - Turkey (%)
Place of birth for the foreign-born population - Yemen (%)
Place of birth for the foreign-born population - Other Western Asia (%)
Place of birth for the foreign-born population - Eritrea (%)
Place of birth for the foreign-born population - Ethiopia (%)
Place of birth for the foreign-born population - Kenya (%)
Place of birth for the foreign-born population - Somalia (%)
Place of birth for the foreign-born population - Uganda (%)
Place of birth for the foreign-born population - Zimbabwe (%)
Place of birth for the foreign-born population - Other Eastern Africa (%)
Place of birth for the foreign-born population - Cameroon (%)
Place of birth for the foreign-born population - Congo (%)
Place of birth for the foreign-born population - Democratic Republic of Congo (Zaire) (%)
Place of birth for the foreign-born population - Other Middle Africa (%)
Place of birth for the foreign-born population - Egypt (%)
Place of birth for the foreign-born population - Morocco (%)
Place of birth for the foreign-born population - Sudan (%)
Place of birth for the foreign-born population - Other Northern Africa (%)
Place of birth for the foreign-born population - South Africa (%)
Place of birth for the foreign-born population - Other Southern Africa (%)
Place of birth for the foreign-born population - Cabo Verde (%)
Place of birth for the foreign-born population - Ghana (%)
Place of birth for the foreign-born population - Liberia (%)
Place of birth for the foreign-born population - Nigeria (%)
Place of birth for the foreign-born population - Senegal (%)
Place of birth for the foreign-born population - Sierra Leone (%)
Place of birth for the foreign-born population - Other Western Africa (%)
Place of birth for the foreign-born population - Australia (%)
Place of birth for the foreign-born population - New Zealand (%)
Place of birth for the foreign-born population - Fiji (%)
Place of birth for the foreign-born population - Micronesia (%)
Place of birth for the foreign-born population - Bahamas (%)
Place of birth for the foreign-born population - Barbados (%)
Place of birth for the foreign-born population - Cuba (%)
Place of birth for the foreign-born population - Dominica (%)
Place of birth for the foreign-born population - Dominican Republic (%)
Place of birth for the foreign-born population - Grenada (%)
Place of birth for the foreign-born population - Haiti (%)
Place of birth for the foreign-born population - Jamaica (%)
Place of birth for the foreign-born population - St. Vincent and the Grenadines (%)
Place of birth for the foreign-born population - Trinidad and Tobago (%)
Place of birth for the foreign-born population - West Indies (%)
Place of birth for the foreign-born population - Other Caribbean (%)
Place of birth for the foreign-born population - Belize (%)
Place of birth for the foreign-born population - Costa Rica (%)
Place of birth for the foreign-born population - El Salvador (%)
Place of birth for the foreign-born population - Guatemala (%)
Place of birth for the foreign-born population - Honduras (%)
Place of birth for the foreign-born population - Mexico (%)
Place of birth for the foreign-born population - Nicaragua (%)
Place of birth for the foreign-born population - Panama (%)
Place of birth for the foreign-born population - Other Central America (%)
Place of birth for the foreign-born population - Argentina (%)
Place of birth for the foreign-born population - Bolivia (%)
Place of birth for the foreign-born population - Brazil (%)
Place of birth for the foreign-born population - Chile (%)
Place of birth for the foreign-born population - Colombia (%)
Place of birth for the foreign-born population - Ecuador (%)
Place of birth for the foreign-born population - Guyana (%)
Place of birth for the foreign-born population - Peru (%)
Place of birth for the foreign-born population - Uruguay (%)
Place of birth for the foreign-born population - Venezuela (%)
Place of birth for the foreign-born population - Other South America (%)
Place of birth for the foreign-born population - Canada (%)
Place of birth for the foreign-born population - Other Northern America (%)
Place of birth for the foreign-born population - Other (%)
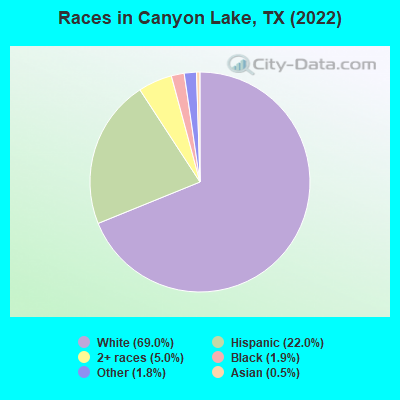
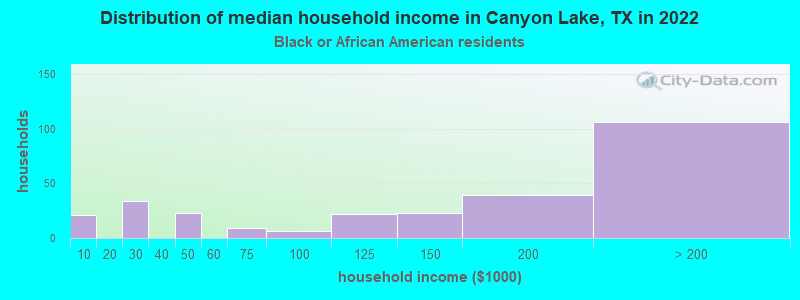
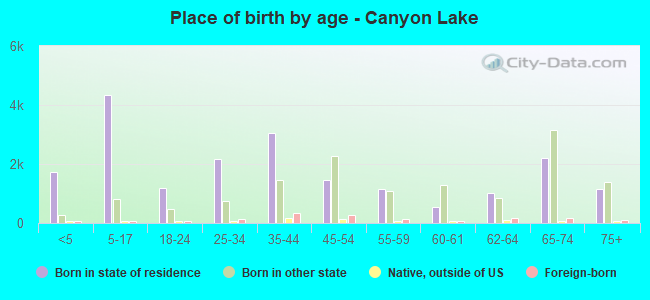
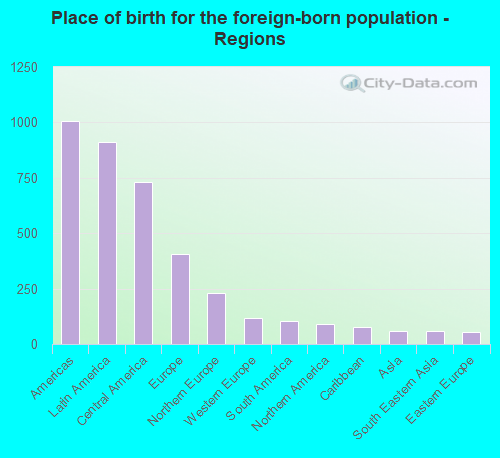
According to 2022 data, the most numerous races in Canyon Lake, TX are Hispanic (7,862 residents), White alone (24,721 residents), and Black alone (675 residents). 90.1% of Canyon Lake residents speak English at home. 4.1% of Canyon Lake, TX residents are foreign-born (2.7% born in Latin America, 1.2% born in Europe), which is 314.1% less than the foreign-born rate of 17.0% across the entire state of Texas.
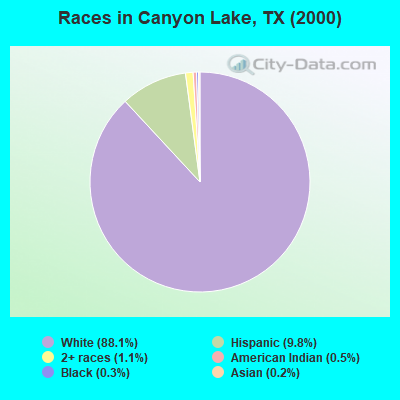
Race distribution in Canyon Lake
2000 2022
10,933,313 52.4% White alone 6,669,666 32.0% Hispanic 2,364,255 11.3% Black alone 554,445 2.7% Asian alone 230,567 1.1% Two or more races 68,859 0.3% American Indian alone 19,958 0.10% Other race alone 10,757 0.05% Native Hawaiian and Other
12,070,642 40.2% Hispanic 11,683,430 38.9% White alone 3,508,706 11.7% Black alone 1,608,173 5.4% Asian alone 956,560 3.2% Two or more races 125,763 0.4% Other race alone 47,023 0.2% American Indian alone 29,275 0.10% Native Hawaiian and Other
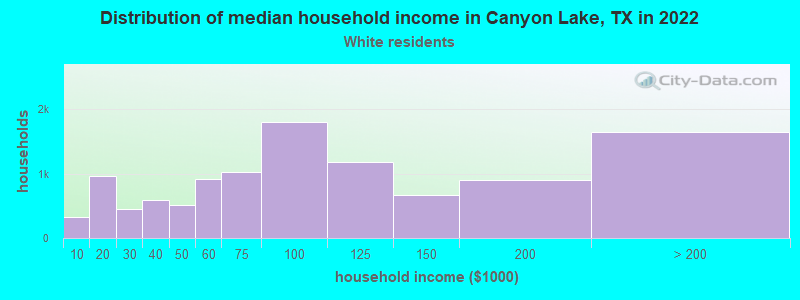
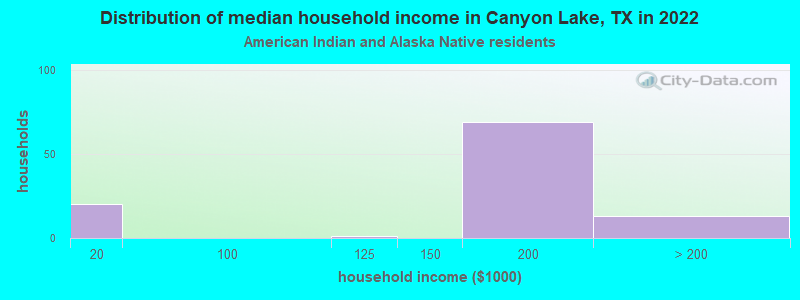
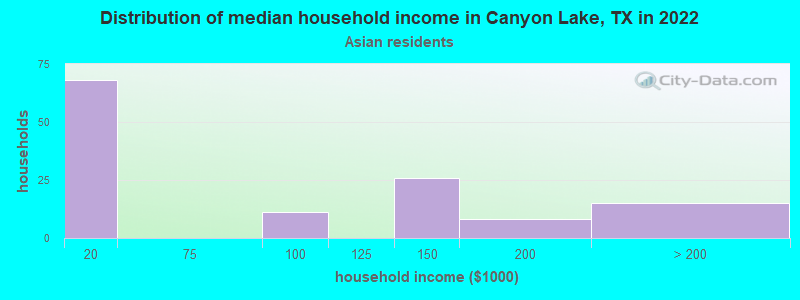
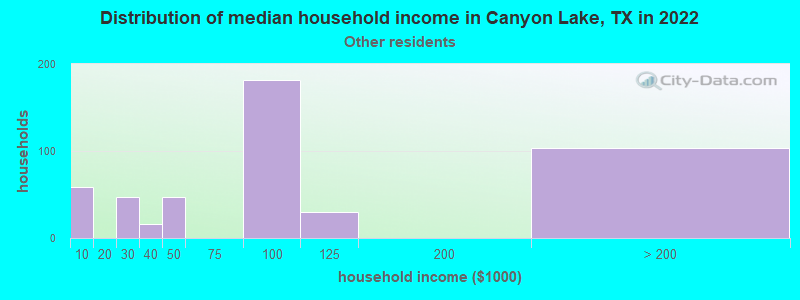
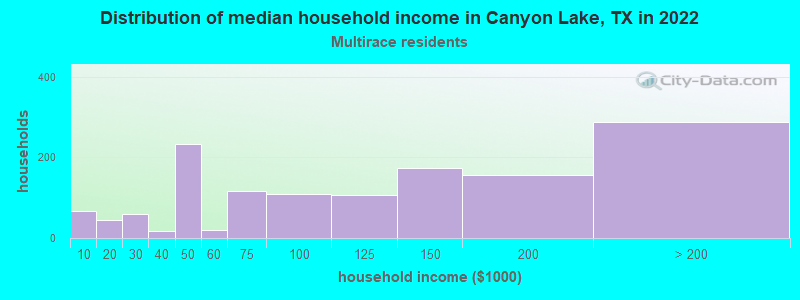
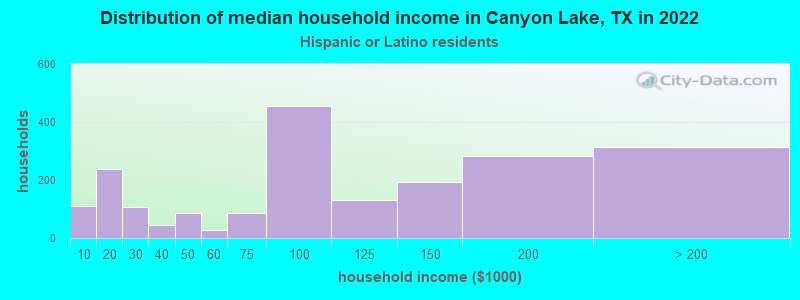
Income and house value in Canyon Lake Median household income in 2022 $85,676 White non-Hispanic householders$120,469 Black householders$160,822 American Indian and Alaska Native householders$72,775 Some other race householders$106,777 Two or more races householders$101,494 Hispanic or Latino race householdersMedian 2022 house value $392,418 White Non-Hispanic householders$742,466 Black or African American householders$457,755 American Indian or Alaska Native householders $556,750 Asian householders$336,584 Native Hawaiian and other Pacific Islander householders$517,944 Some other race householders$643,470 Two or more races householders$310,449 Hispanic or Latino householders
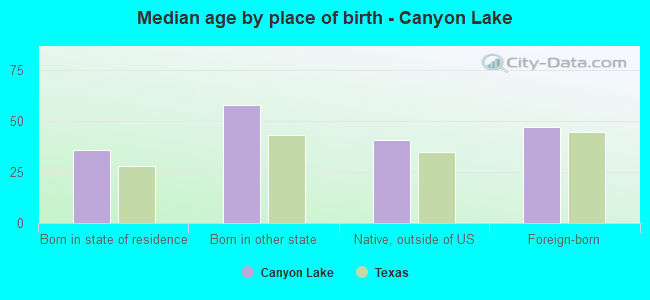
Median age by race in Canyon Lake
52.2 Median age for White residents52.4 52.2 37.6 Median age for Black or African American residents38.2 31.0 16.7 Median age for American Indian / Alaska Native residents-354,260,089.3 -412,408,758.7 37.0 Median age for Asian residents26.8 41.1 -666,666,666.0 Median age for Native Hawaiian / Pacific Islander residents-666,666,666.0 -666,666,666.0 39.5 Median age for Other race residents44.9 42.8 34.4 Median age for Two or more races residents45.0 25.4 53.1 Median age for White alone residents51.6 55.1 36.7 Median age for Hispanic or Latino residents36.2 36.7
Owner/renter occupied households by race in Canyon Lake
House owners and renters - White residents 9,796 88.1% Owner occupied1,326 11.9% Renter occupiedHouse owners and renters - Black or African American residents 107 46.6% Owner occupied123 53.4% Renter occupiedHouse owners and renters - American Indian / Alaska Native residents 34 32.0% Owner occupied72 68.0% Renter occupiedHouse owners and renters - Asian residents 60 53.3% Owner occupied53 46.7% Renter occupiedHouse owners and renters - Other race residents 501 86.5% Owner occupied78 13.5% Renter occupiedHouse owners and renters - Two or more races residents 1,723 97.8% Owner occupied39 2.2% Renter occupiedHouse owners and renters - White alone residents 9,618 88.0% Owner occupied1,307 12.0% Renter occupiedHouse owners and renters - Hispanic or Latino residents 1,833 86.3% Owner occupied290 13.7% Renter occupied
Language usage in Canyon Lake
English speakers - Total 90.1% of residents of Canyon Lake speak English at home.
8.2% of residents speak Spanish at home 2,088 75.7% Speak English very well672 24.3% Speak English less than very well1.5% of residents speak other language at home 424 83.3% Speak English very well85 16.7% Speak English less than very well
English speakers - Born in the United States 91.1% of residents of Canyon Lake speak English at home.
3.4% of residents speak Spanish at home 416 93.1% Speak English very well31 6.9% Speak English less than very well3.2% of residents speak other language at home 430 100.0% Speak English very well
English speakers - Native, born elsewhere 93.9% of residents of Canyon Lake speak English at home.
12.7% of residents speak Spanish at home 29 44.6% Speak English very well36 55.4% Speak English less than very well0.6% of residents speak other language at home 3 100.0% Speak English very well
English speakers - Foreign-born 37.5% of residents of Canyon Lake speak English at home.
51.9% of residents speak Spanish at home 443 51.3% Speak English very well421 48.7% Speak English less than very well10.3% of residents speak other language at home 83 48.5% Speak English very well88 51.5% Speak English less than very well
White (Caucasian) - Speak only English Native:
98.9% (23,798)Foreign-born:
52.8% (232)
White (Caucasian) - Speak another language Native:
2.8% (676)Foreign-born:
49.8% (218)
Black or African American - Speak only English Native:
95.0% (621)Foreign-born:
90.7% (52)
Asian - Speak only English Native:
76.6% (185)Foreign-born:
27.2% (17)
Asian - Speak another language Native:
24.0% (58)Foreign-born:
73.4% (45)
Other race - Speak another language Native:
34.8% (754)Foreign-born:
96.6% (375)
Two or more races - Speak only English Native:
82.4% (3,609)Foreign-born:
15.2% (36)
Two or more races - Speak another language Native:
17.9% (782)Foreign-born:
74.8% (177)
White alone - Speak only English Native:
97.4% (22,505)Foreign-born:
77.9% (252)
White alone - Speak another language Native:
2.5% (587)Foreign-born:
19.0% (61)
Hispanic or Latino - Speak another language Native:
23.9% (1,503)Foreign-born:
95.3% (925)
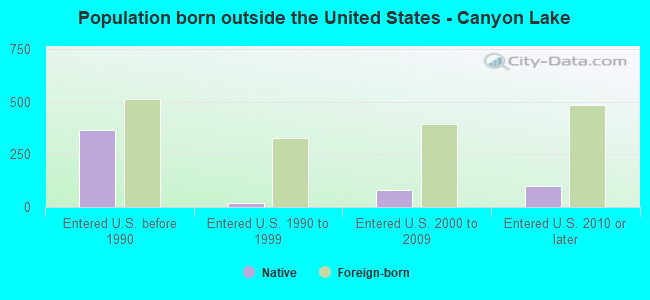
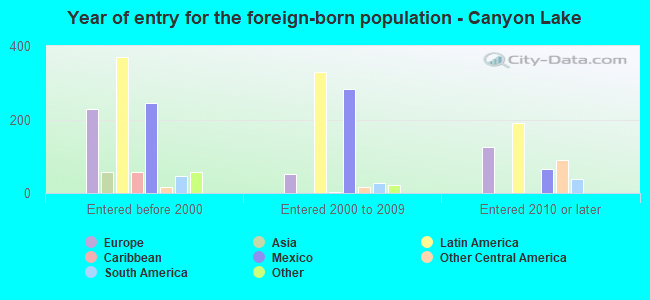
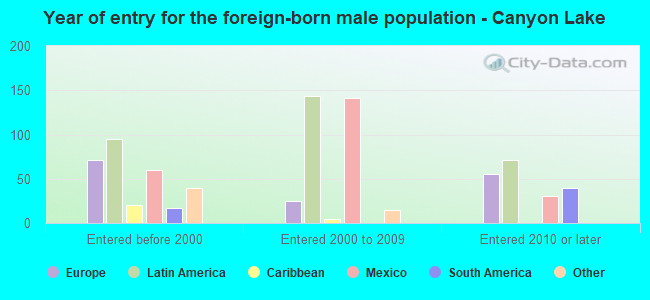
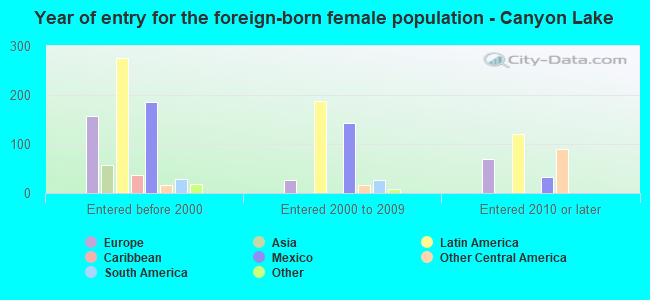
Foreign-born residents in Canyon Lake 1,470 residents are foreign born (2.7% Latin America , 1.2% Europe ).
This city:
4.1%Texas:
17.1%
Marital status for residents in Canyon Lake Marital status - White (Caucasian) population 15 years and over
Males 20.3% Never married66.1% Now married1.8% Separated3.2% Widowed8.6% DivorcedFemales 12.2% Never married70.2% Now married1.5% Separated7.2% Widowed8.9% DivorcedWomen who gave birth in the past 12 months Now married:
84.5% (471)Unmarried:
15.5% (86)
Women who did not give birth in the past 12 months Now married:
67.5% (2,589)Unmarried:
32.5% (1,246)
Marital status - Black or African American population 15 years and over
Males 24.5% Never married70.1% Now married0.0% Separated0.7% Widowed4.7% DivorcedFemales 15.1% Never married61.0% Now married0.0% Separated0.0% Widowed23.9% DivorcedWomen who gave birth in the past 12 months Now married:
100.0% (35)Unmarried:
0.0% (0)
Women who did not give birth in the past 12 months Now married:
40.6% (66)Unmarried:
59.4% (96)
Marital status - American Indian / Alaska Native population 15 years and over
Males 85.5% Never married14.5% Now married0.0% Separated0.0% Widowed0.0% DivorcedFemales 0.0% Never married7.1% Now married0.0% Separated0.0% Widowed92.9% DivorcedMarital status - Asian population 15 years and over
Males 0.0% Never married100.0% Now married0.0% Separated0.0% Widowed0.0% DivorcedFemales 0.8% Never married99.2% Now married0.0% Separated0.0% Widowed0.0% DivorcedWomen who did not give birth in the past 12 months Now married:
98.1% (56)Unmarried:
1.9% (1)
Marital status - Other race population 15 years and over
Males 28.5% Never married56.8% Now married4.4% Separated2.6% Widowed7.8% DivorcedFemales 11.3% Never married82.0% Now married3.0% Separated0.1% Widowed3.5% DivorcedWomen who did not give birth in the past 12 months Now married:
72.5% (315)Unmarried:
27.5% (119)
Marital status - Two or more races population 15 years and over
Males 46.4% Never married48.1% Now married0.0% Separated2.7% Widowed2.8% DivorcedFemales 29.5% Never married52.0% Now married0.0% Separated5.3% Widowed13.2% DivorcedWomen who did not give birth in the past 12 months Now married:
40.7% (449)Unmarried:
59.3% (654)
Marital status - White alone, not Hispanic / Latino population 15 years and over
Males 18.6% Never married67.7% Now married1.2% Separated3.5% Widowed9.0% DivorcedFemales 11.2% Never married70.7% Now married1.4% Separated7.0% Widowed9.7% DivorcedWomen who gave birth in the past 12 months Now married:
92.0% (484)Unmarried:
8.0% (42)
Women who did not give birth in the past 12 months Now married:
64.2% (2,027)Unmarried:
35.8% (1,129)
Marital status - Hispanic or Latino population 15 years and over
Males 39.5% Never married52.0% Now married3.3% Separated0.7% Widowed4.5% DivorcedFemales 20.0% Never married66.4% Now married1.0% Separated5.8% Widowed6.8% DivorcedWomen who gave birth in the past 12 months Now married:
52.3% (71)Unmarried:
47.7% (65)
Women who did not give birth in the past 12 months Now married:
68.4% (1,442)Unmarried:
31.6% (667)
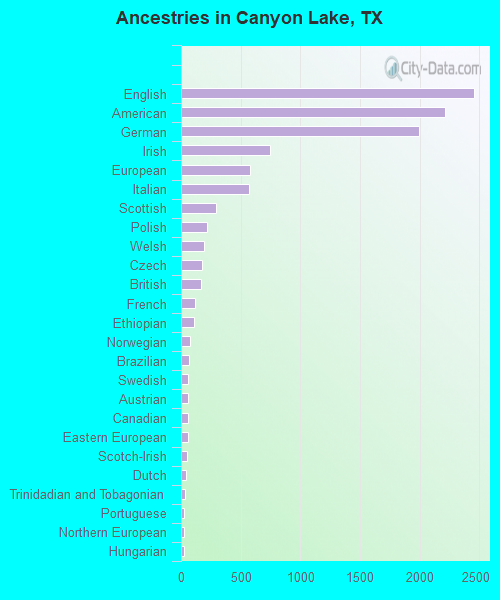
Ancestries in Canyon Lake
2,459 16.0% English2,211 14.4% American1,998 13.0% German747 4.9% Irish577 3.8% European572 3.7% Italian297 1.9% Scottish218 1.4% Polish190 1.2% Welsh179 1.2% Czech170 1.1% British119 0.8% French106 0.7% Ethiopian72 0.5% Norwegian64 0.4% Brazilian60 0.4% Swedish58 0.4% Austrian58 0.4% Canadian55 0.4% Eastern European54 0.4% Scotch-Irish38 0.2% Dutch31 0.2% Trinidadian and Tobagonian29 0.2% Portuguese27 0.2% Northern European26 0.2% Hungarian25 0.2% Albanian24 0.2% Syrian24 0.2% Lebanese23 0.1% Ukrainian22 0.1% Greek17 0.1% French Canadian14 0.09% Swiss11 0.07% Danish
Geographical mobility in Canyon Lake Same house 1 year ago 22,706 89.4% White (Caucasian)442 62.1% Black or African American15 13.5% American Indian / Alaska Native223 73.7% Asian1,970 91.1% Other race4,561 89.4% Two or more races21,967 90.2% White alone, not Hispanic / Latino6,732 89.4% Hispanic or LatinoMoved within same county 676 2.7% White / Caucasian12 4.1% Asian34 1.6% Other race81 1.6% Two or more races592 2.4% White alone, not Hispanic / Latino180 2.4% Hispanic or LatinoMoved within same state 1,354 5.3% White / Caucasian158 22.2% Black or African American84 75.8% American Indian / Alaska Native55 18.3% Asian45 2.1% Other race223 4.4% Two or more races1,376 5.6% White alone, not Hispanic / Latino309 4.1% Hispanic or LatinoMoved from different state 641 2.5% White / Caucasian147 20.6% Black or African American84 3.9% Other race238 4.7% Two or more races465 1.9% White alone, not Hispanic / Latino272 3.6% Hispanic or LatinoMoved from abroad 21 0.1% White15 4.9% Asian52 2.4% Other race21 0.1% White alone, not Hispanic / Latino9 0.1% Hispanic or Latino
Children Nativity (place of birth) in Canyon Lake
Children under 6 years - Living with two parents Both parents native 1,496 100.0% NativeBoth parents foreign-born 44 100.0% NativeOne native, one foreign-born parent 127 100.0% NativeChildren under 6 years - Living with one parent Native parent 359 100.0% NativeForeign-born parent 51 100.0% NativeChildren 6 to 17 years - Living with two parents Both parents native 3,081 100.0% Native0 0.0% Foreign-bornBoth parents foreign-born 107 66.5% Native54 33.5% Foreign-bornOne native, one foreign-born parent 126 100.0% NativeChildren 6 to 17 years - Living with one parent Native parent 769 100.0% NativeForeign-born parent 130 50.5% Native128 49.5% Foreign-born
Grandparents responsible for own grandchildren in Canyon Lake
Grandparents (30 to 59 years) White / Caucasian 24 31.4% Responsible for grandchildren53 68.6% Not responsible for grandchildrenOther race 19 100.0% Not responsible for grandchildrenTwo or more races 17 100.0% Not responsible for grandchildrenWhite alone, not Hispanic / Latino 32 27.7% Responsible for grandchildren82 72.3% Not responsible for grandchildrenHispanic or Latino 14 100.0% Not responsible for grandchildrenGrandparents (60 years and over) White / Caucasian 62 29.4% Responsible for grandchildren150 70.6% Not responsible for grandchildrenOther race 283 100.0% Not responsible for grandchildrenTwo or more races 10 100.0% Responsible for grandchildrenWhite alone, not Hispanic / Latino 68 33.4% Responsible for grandchildren135 66.6% Not responsible for grandchildrenHispanic or Latino 13 12.8% Responsible for grandchildren91 87.2% Not responsible for grandchildren