Estimated zip code population in 2022: 1,123 Zip code population in 2010: 813 Zip code population in 2000: 310
March 2022 cost of living index in zip code 78623: 80.0 (low, U.S. average is 100)
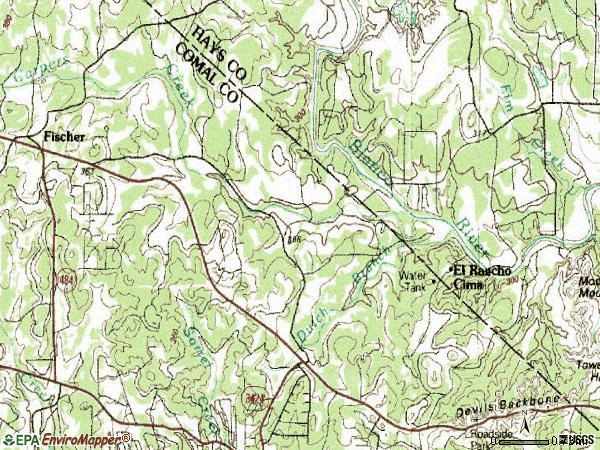
Land area: 20.5 sq. mi. Water area: 0.0 sq. mi.
Population density: 55 people per square mile
(very low).
OSM Map
General Map
Google Map
MSN Map
OSM Map
General Map
Google Map
MSN Map
OSM Map
General Map
Google Map
MSN Map
OSM Map
General Map
Google Map
MSN Map
Please wait while loading the map...
Real estate property taxes paid for housing units in 2022:
This zip code:
0.8% ($3,964)
Texas:
1.5% ($4,050)
Median real estate property taxes paid for housing units with mortgages in 2022: $3,696 (0.6%) Median real estate property taxes paid for housing units with no mortgage in 2022: $4,315 (0.9%)
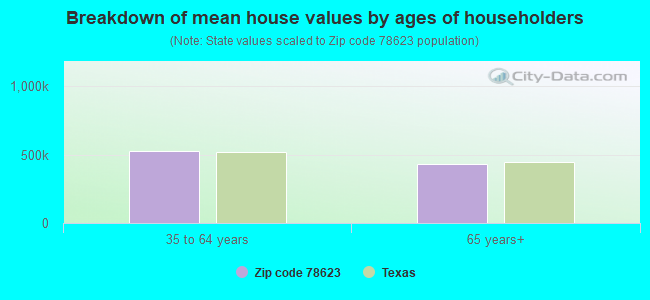
Estimated median house/condo value in 2022: $503,820
78623:
$503,820
Texas:
$275,400
According to our research of Texas and other state lists, there was 1 registered sex offender living in 78623 zip code as of April 27, 2024. The ratio of all residents to sex offenders in zip code 78623 is 762 to 1. The ratio of registered sex offenders to all residents in this zip code is lower than the state average.
Median resident age:
This zip code:
63.6 years
Texas median age:
35.6 years
Average household size:
This zip code:
2.1 people
Texas:
2.6 people
Averages for the 2020 tax year for zip code 78623, filed in 2021:
Average Adjusted Gross Income (AGI) in 2020: $82,931 (Individual Income Tax Returns)
Here:
$82,931
State:
$77,054
Salary/wage: $67,277 (reported on 69.3% of returns)
Here:
$67,277
State:
$62,766
(% of AGI for various income ranges: 860.6% for AGIs below $25k, 2804.2% for AGIs $25k-50k, 4146.0% for AGIs $50k-75k, 6962.0% for AGIs $75k-100k, 14150.0% for AGIs $100k-200k)
Taxable interest for individuals: $1,218 (reported on 43.6% of returns)
This zip code:
$1,218
Texas:
$2,665
(% of AGI for various income ranges: 23.5% for AGIs below $25k, 45.0% for AGIs $25k-50k, 54.0% for AGIs $50k-75k, 43.0% for AGIs $75k-100k, 177.5% for AGIs $100k-200k)
Ordinary dividends: $3,596 (reported on 54.5% of returns)
Here:
$3,596
State:
$10,044
(% of AGI for various income ranges: 49.4% for AGIs below $25k, 95.8% for AGIs $25k-50k, 156.0% for AGIs $50k-75k, 148.0% for AGIs $75k-100k, 455.0% for AGIs $100k-200k)
Net capital gain/loss in AGI: +$21,987 (reported on 22.8% of returns)
Here:
+$21,987
State:
+$39,590
(% of AGI for various income ranges: 18.2% for AGIs below $25k, 25.0% for AGIs $25k-50k, 84.0% for AGIs $50k-75k, 156.0% for AGIs $75k-100k, 523.1% for AGIs $100k-200k)
Profit/loss from business: +$12,157 (reported on 20.8% of returns)
Here:
+$12,157
State:
+$10,888
(% of AGI for various income ranges: 208.2% for AGIs below $25k, 365.8% for AGIs $25k-50k, 222.0% for AGIs $50k-75k, 251.0% for AGIs $75k-100k, 804.4% for AGIs $100k-200k)
Taxable individual retirement arrangement distribution: $25,888 (reported on 15.8% of returns)
78623:
$25,888
Texas:
$24,740
(% of AGI for various income ranges: 430.0% for AGIs $25k-50k, 571.0% for AGIs $50k-75k, 730.0% for AGIs $75k-100k, 1453.1% for AGIs $100k-200k)
Total itemized deductions: $29,680 (reported on 9.9% of returns)
Here:
$29,680
State:
$40,428
(% of AGI for various income ranges: 1249.0% for AGIs $50k-75k, 1074.4% for AGIs $100k-200k)
Charity contributions: $10,986 (reported on 6.9% of returns)
Here:
$10,986
State:
$18,201
(% of AGI for various income ranges: 187.0% for AGIs $50k-75k, 363.8% for AGIs $100k-200k)
Taxes paid: $6,433 (reported on 8.9% of returns)
78623:
$6,433
State:
$7,821
(% of AGI for various income ranges: 227.0% for AGIs $50k-75k, 220.0% for AGIs $100k-200k)
Earned income credit: $1,550 (reported on 7.9% of returns)
Here:
$1,550
State:
$2,584
(% of AGI for various income ranges: 46.5% for AGIs below $25k, 37.5% for AGIs $25k-50k)
Percentage of individuals using paid preparers for their 2020 taxes: 91.1%
Here:
91%
State:
92%
(% for various income ranges: 91.3% for AGIs below $25k, 88.2% for AGIs $25k-50k, 86.7% for AGIs $50k-75k, 92.9% for AGIs $75k-100k, 92.3% for AGIs $100k-200k, 100.0% for AGIs over 200k)
Averages for the 2012 tax year for zip code 78623, filed in 2013:
Average Adjusted Gross Income (AGI) in 2012: $66,392 (Individual Income Tax Returns)
Here:
$66,392
State:
$65,384
Salary/wage: $52,121 (reported on 71.7% of returns)
Here:
$52,121
State:
$52,524
(% of AGI for various income ranges: 61.0% for AGIs below $25k, 51.1% for AGIs $25k-50k, 59.9% for AGIs $50k-75k, 58.1% for AGIs $75k-100k, 55.1% for AGIs $100k-200k)
Taxable interest for individuals: $1,100 (reported on 39.6% of returns)
This zip code:
$1,100
Texas:
$2,372
(% of AGI for various income ranges: 1.3% for AGIs below $25k, 1.0% for AGIs $25k-50k, 0.4% for AGIs $50k-75k, 1.2% for AGIs $75k-100k, 0.4% for AGIs $100k-200k)
Ordinary dividends: $6,208 (reported on 22.6% of returns)
Here:
$6,208
State:
$9,721
(% of AGI for various income ranges: 6.5% for AGIs below $25k, 2.8% for AGIs $50k-75k, 1.7% for AGIs $75k-100k, 2.1% for AGIs $100k-200k)
Net capital gain/loss in AGI: +$4,055 (reported on 20.8% of returns)
Here:
+$4,055
State:
+$35,319
(% of AGI for various income ranges: 0.3% for AGIs $50k-75k, 2.6% for AGIs $100k-200k)
Profit/loss from business: +$8,483 (reported on 22.6% of returns)
Here:
+$8,483
State:
+$13,732
(% of AGI for various income ranges: 12.0% for AGIs below $25k, 7.7% for AGIs $25k-50k, 5.3% for AGIs $50k-75k, 1.2% for AGIs $100k-200k)
Taxable individual retirement arrangement distribution: $16,278 (reported on 17.0% of returns)
78623:
$16,278
Texas:
$19,511
(% of AGI for various income ranges: 11.5% for AGIs $25k-50k, 8.0% for AGIs $75k-100k, 2.8% for AGIs $100k-200k)
Total itemized deductions: $19,550 (20% of AGI, reported on 34.0% of returns)
Here:
$19,550
State:
$24,724
Here:
20.2% of AGI
State:
15.9% of AGI
(% of AGI for various income ranges: 20.0% for AGIs $25k-50k, 11.2% for AGIs $50k-75k, 11.4% for AGIs $75k-100k, 7.9% for AGIs $100k-200k)
Charity contributions: $3,654 (reported on 24.5% of returns)
Here:
$3,654
State:
$6,808
(% of AGI for various income ranges: 2.2% for AGIs $25k-50k, 1.5% for AGIs $50k-75k, 1.4% for AGIs $75k-100k, 1.2% for AGIs $100k-200k)
Taxes paid: $4,826 (reported on 35.8% of returns)
78623:
$4,826
State:
$6,921
(% of AGI for various income ranges: 4.8% for AGIs $25k-50k, 3.1% for AGIs $50k-75k, 3.2% for AGIs $75k-100k, 2.0% for AGIs $100k-200k)
Earned income credit: $2,080 (reported on 9.4% of returns)
Here:
$2,080
State:
$2,570
(% of AGI for various income ranges: 5.7% for AGIs below $25k)
Percentage of individuals using paid preparers for their 2012 taxes: 47.2%
Here:
47%
State:
51%
(% for various income ranges: 43.8% for AGIs below $25k, 40.0% for AGIs $25k-50k, 55.6% for AGIs $50k-75k, 37.5% for AGIs $75k-100k, 60.0% for AGIs $100k-200k)
Averages for the 2004 tax year for zip code 78623, filed in 2005:
Average Adjusted Gross Income (AGI) in 2004: $47,472 (Individual Income Tax Returns)
Here:
$47,472
State:
$47,881
Salary/wage: $37,700 (reported on 72.0% of returns)
Here:
$37,700
State:
$41,947
(% of AGI for various income ranges: 69.1% for AGIs below $10k, 67.7% for AGIs $10k-25k, 62.8% for AGIs $25k-50k, 59.4% for AGIs $50k-75k, 68.2% for AGIs $75k-100k, 46.1% for AGIs over 100k)
Taxable interest for individuals: $2,840 (reported on 51.0% of returns)
This zip code:
$2,840
Texas:
$2,255
(% of AGI for various income ranges: 8.0% for AGIs below $10k, 4.0% for AGIs $10k-25k, 1.1% for AGIs $25k-50k, 1.4% for AGIs $50k-75k, 0.1% for AGIs $75k-100k, 6.0% for AGIs over 100k)
Taxable dividends: $1,989 (reported on 27.7% of returns)
Here:
$1,989
State:
$4,261
(% of AGI for various income ranges: 10.0% for AGIs below $10k, 4.2% for AGIs $10k-25k, 1.2% for AGIs $25k-50k, 0.5% for AGIs $50k-75k, 1.1% for AGIs over 100k)
Net capital gain/loss: +$5,432 (reported on 25.7% of returns)
Here:
+$5,432
State:
+$16,110
(% of AGI for various income ranges: 3.6% for AGIs below $10k, 3.2% for AGIs $10k-25k, 0.6% for AGIs $25k-50k, -0.5% for AGIs $50k-75k, 7.9% for AGIs over 100k)
Profit/loss from business: +$2,725 (reported on 20.1% of returns)
Here:
+$2,725
State:
+$11,013
(% of AGI for various income ranges: 24.1% for AGIs below $10k, -5.3% for AGIs $10k-25k, 0.7% for AGIs $25k-50k, 3.6% for AGIs $50k-75k)
Total itemized deductions: $17,116 (21% of AGI, reported on 32.7% of returns)
Here:
$17,116
State:
$19,631
Here:
21.4% of AGI
State:
18.9% of AGI
(% of AGI for various income ranges: 18.3% for AGIs $25k-50k, 12.4% for AGIs $50k-75k, 16.2% for AGIs $75k-100k, 9.2% for AGIs over 100k)
Charity contributions deductions: $2,770 (3% of AGI, reported on 25.4% of returns)
Here:
$2,770
State:
$4,753
Here:
3.3% of AGI
State:
4.2% of AGI
Total tax: $6,967 (reported on 79.9% of returns)
78623:
$6,967
State:
$9,058
(% of AGI for various income ranges: 4.8% for AGIs below $10k, 4.3% for AGIs $10k-25k, 6.9% for AGIs $25k-50k, 9.9% for AGIs $50k-75k, 11.2% for AGIs $75k-100k, 17.5% for AGIs over 100k)
Earned income credit: $1,324 (reported on 9.9% of returns)
Here:
$1,324
State:
$2,024
Percentage of individuals using paid preparers for their 2004 taxes: 52.5%
Here:
52%
State:
57%
(% for various income ranges: 50.7% for AGIs below $10k, 44.4% for AGIs $10k-25k, 52.0% for AGIs $25k-50k, 57.5% for AGIs $50k-75k, 45.8% for AGIs $75k-100k, 64.1% for AGIs over 100k)
Household received Food Stamps/SNAP in the past 12 months: 51 Household did not receive Food Stamps/SNAP in the past 12 months: 484
Women who had a birth in the past 12 months: 14 (0 now married, 13 unmarried) Women who did not have a birth in the past 12 months: 121 (76 now married, 43 unmarried)
Housing units in zip code 78623 with a mortgage: 228 (8 second mortgage, 9 both second mortgage and home equity loan) Median monthly owner costs for units with a mortgage: $2,010 Median monthly owner costs for units without a mortgage: $653
Residents with income below the poverty level in 2022:
This zip code:
4.7%
Whole state:
14.0%
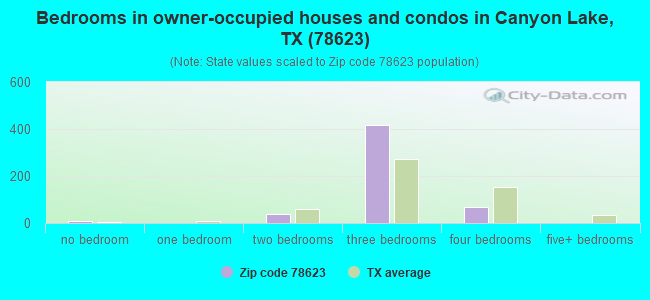
Median number of rooms in houses and condos:
Here:
6.2
State:
6.3
Notable locations in this zip code not listed on our city pages
Size of family households: 292 2-persons, 43 3-persons, 20 4-persons, 34 5-persons
Size of nonfamily households: 135 1-person, 14 2-persons
127 married couples with children.
0 single-parent households ().
92.8% of residents of 78623 zip code speak English at home.
1.6% of residents speak Spanish at home (100% very well).
5.7% of residents speak other Indo-European language at home (100% very well).
1.0% of residents speak Asian or Pacific Island language at home (100% well).
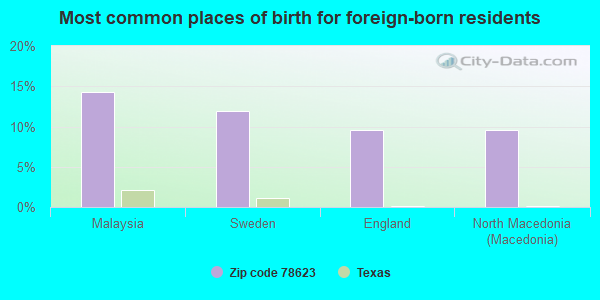
Foreign born population: 88 (7.9%) (78.7% of them are naturalized citizens)
This zip code:
7.9%
Whole state:
17.2%
14%Malaysia
12%Sweden
10%England
10%North Macedonia (Macedonia)
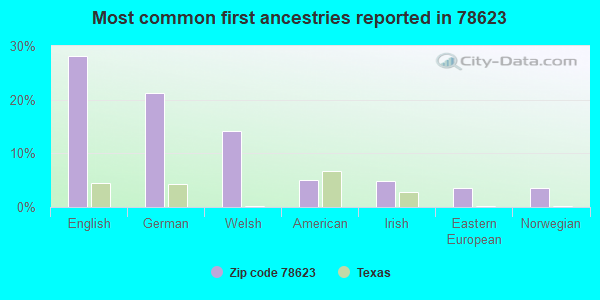
28%English
21%German
14%Welsh
5%American
5%Irish
4%Eastern European
4%Norwegian
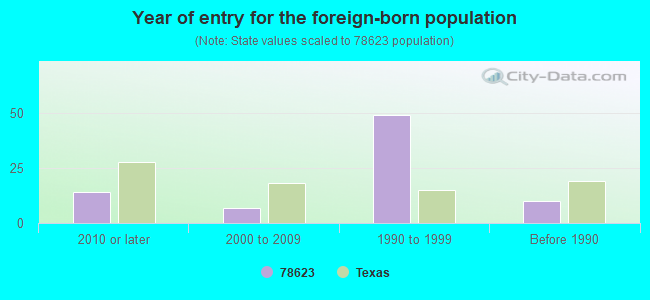
Year of entry for the foreign-born population
142010 or later
72000 to 2009
491990 to 1999
10Before 1990
Public high school in in zip code 78623 not listed on the city page:
CANYON LAKE H S (Location: 8555 FM 32, Grades: 9-12)
Housing units lacking complete plumbing facilities: 2.1% Housing units lacking complete kitchen facilities: 2.1%
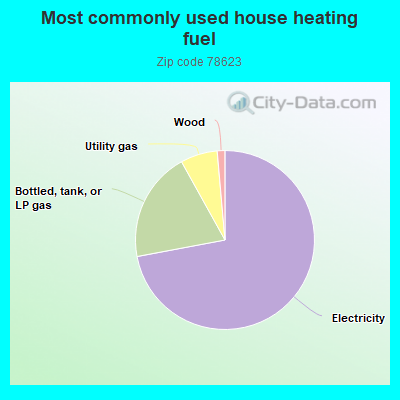
72.4%Electricity
20.0%Bottled, tank, or LP gas
6.7%Utility gas
1.4%Wood
Population in 1990: 459.
Place of birth for U.S.-born residents:
This state: 649
Northeast: 118
Midwest: 160
South: 33
West: 76
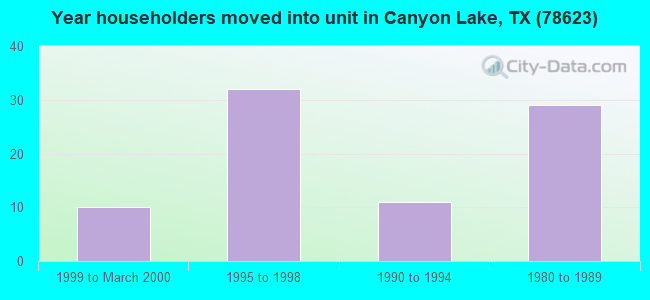
51% of the 78623 zip code residents lived in the same house 5 years ago. Out of people who lived in different houses, 0% lived in this county.
95% of the 78623 zip code residents lived in the same house 1 year ago. Out of people who lived in different houses, 25% moved from this county. Out of people who lived in different houses, 79% moved from different county within same state.
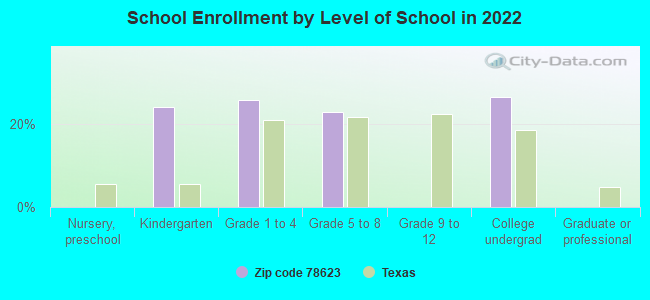
Private vs. public school enrollment:
Students in private schools in grades 1 to 8 (elementary and middle school):
Here:
0.0%
Texas:
8.8%
Students in private undergraduate colleges:
Here:
0.0%
Texas:
16.2%
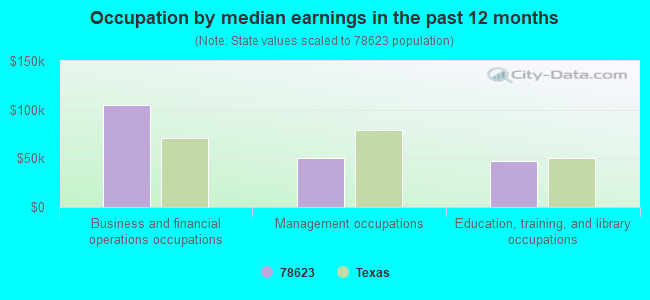
Occupation by median earnings in the past 12 months ($)
104,319Business and financial operations occupations
50,220Management occupations
46,747Education, training, and library occupations
Companies with federal contracts located in this zip code:
HERBERT LARSON (177 ARABIAN LN in FISCHER, TX; small business) : $33,765 in 4 contractsfrom 2004 to 2006
$8,840 with Army for Other Housekeeping Services. Signed on 2006-02-07. Completion date: 2006-04-01.
$8,664 with Army for Guard Services. Signed on 2005-02-25. Completion date: 2005-09-30.
$8,664 with U.S. Army Corps of Engineers - civil program financing only for Guard Services. Signed on 2005-02-25. Completion date: 2005-09-30.
$7,597 with Army for Guard Services. Signed on 2004-03-16. Completion date: 2004-08-16.
HAYLEY, FORREST (165 ARABIAN LN in FISCHER, TX; small business)
$9,825 with Army for Other Housekeeping Services. Signed on 2006-02-08. Completion date: 2006-04-01.
Top industries in this zip code by the number of employees in 2005:
Wholesale Trade: Other Chemical and Allied Products Merchant Wholesalers (10-19 employees: 1 establishment)
Construction: Masonry Contractors (5-9: 1)
Construction: Other Building Finishing Contractors (1-4: 1)
Other Services (except Public Administration): Religious Organizations (1-4: 1)
Finance and Insurance: Commercial Banking (1-4: 1)
Construction: Plumbing, Heating, and Air-Conditioning Contractors (1-4: 1)
Health Care and Social Assistance: Offices of Physicians (except Mental Health Specialists) (1-4: 1)
Arts, Entertainment, and Recreation: All Other Amusement and Recreation Industries (1-4: 1)
Fatal accident statistics in 2014:
Fatal accident count: 1
Vehicles involved in fatal accidents: 1
Fatal accidents caused by drunken drivers: 0
Fatalities: 1
Persons involved in fatal accidents: 3
Pedestrians involved in fatal accidents: 0
Fatal accident statistics in 2010:
Fatal accident count: 1
Vehicles involved in fatal accidents: 2
Fatal accidents caused by drunken drivers: 0
Fatalities: 1
Persons involved in fatal accidents: 3
Pedestrians involved in fatal accidents: 0
Home Mortgage Disclosure Act Aggregated Statistics For Year 2009 (Based on 2 partial tracts)
A) FHA, FSA/RHS & VA Home Purchase Loans
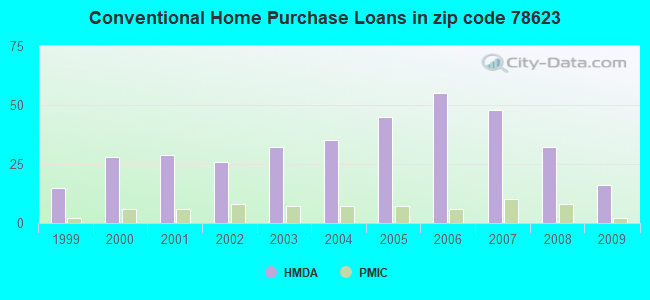
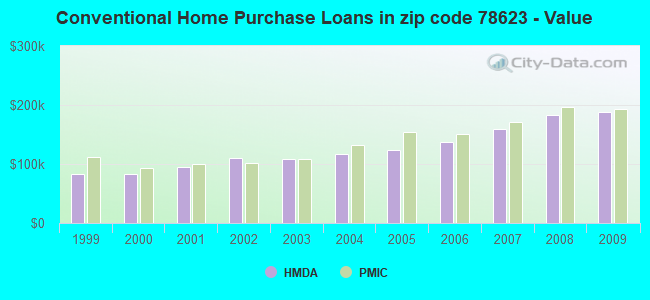
B) Conventional Home Purchase Loans
C) Refinancings
D) Home Improvement Loans
F) Non-occupant Loans on < 5 Family Dwellings (A B C & D)
G) Loans On Manufactured Home Dwelling (A B C & D)
Number
Average Value
Number
Average Value
Number
Average Value
Number
Average Value
Number
Average Value
Number
Average Value
LOANS ORIGINATED
9
$151,594
16
$188,162
47
$199,523
4
$45,395
11
$177,004
5
$81,026
APPLICATIONS APPROVED, NOT ACCEPTED
1
$130,080
3
$151,037
5
$168,638
1
$23,740
1
$35,280
1
$85,270
APPLICATIONS DENIED
1
$85,440
6
$137,912
18
$166,253
5
$65,776
3
$185,313
4
$67,298
APPLICATIONS WITHDRAWN
1
$162,180
2
$248,875
13
$179,778
3
$58,967
2
$162,935
1
$90,790
FILES CLOSED FOR INCOMPLETENESS
0
$0
1
$164,690
2
$144,545
0
$0
0
$0
1
$54,840
Aggregated Statistics For Year 2008 (Based on 2 partial tracts)
A) FHA, FSA/RHS & VA Home Purchase Loans
B) Conventional Home Purchase Loans
C) Refinancings
D) Home Improvement Loans
F) Non-occupant Loans on < 5 Family Dwellings (A B C & D)
G) Loans On Manufactured Home Dwelling (A B C & D)
Number
Average Value
Number
Average Value
Number
Average Value
Number
Average Value
Number
Average Value
Number
Average Value
LOANS ORIGINATED
6
$136,825
32
$183,298
27
$186,050
7
$43,353
15
$188,178
6
$83,795
APPLICATIONS APPROVED, NOT ACCEPTED
1
$54,340
4
$158,212
5
$140,148
2
$80,590
2
$106,170
2
$73,985
APPLICATIONS DENIED
1
$151,650
8
$156,918
19
$144,804
8
$50,201
5
$155,162
5
$57,516
APPLICATIONS WITHDRAWN
0
$0
4
$162,560
11
$180,697
2
$48,320
4
$95,638
1
$79,920
FILES CLOSED FOR INCOMPLETENESS
0
$0
2
$167,285
1
$204,990
1
$42,470
1
$82,430
1
$18,060
Aggregated Statistics For Year 2007 (Based on 2 partial tracts)
A) FHA, FSA/RHS & VA Home Purchase Loans
B) Conventional Home Purchase Loans
C) Refinancings
D) Home Improvement Loans
F) Non-occupant Loans on < 5 Family Dwellings (A B C & D)
G) Loans On Manufactured Home Dwelling (A B C & D)
Number
Average Value
Number
Average Value
Number
Average Value
Number
Average Value
Number
Average Value
Number
Average Value
LOANS ORIGINATED
4
$125,775
48
$160,122
30
$196,036
6
$46,035
21
$151,021
7
$72,087
APPLICATIONS APPROVED, NOT ACCEPTED
1
$138,780
7
$135,456
7
$159,150
2
$64,455
2
$154,325
3
$74,180
APPLICATIONS DENIED
1
$71,730
11
$119,761
22
$181,549
11
$47,226
5
$166,798
6
$42,720
APPLICATIONS WITHDRAWN
1
$103,500
6
$156,248
15
$152,966
2
$101,070
3
$120,273
2
$90,205
FILES CLOSED FOR INCOMPLETENESS
0
$0
1
$171,380
3
$186,650
1
$33,610
1
$114,360
0
$0
Aggregated Statistics For Year 2006 (Based on 2 partial tracts)
A) FHA, FSA/RHS & VA Home Purchase Loans
B) Conventional Home Purchase Loans
C) Refinancings
D) Home Improvement Loans
F) Non-occupant Loans on < 5 Family Dwellings (A B C & D)
G) Loans On Manufactured Home Dwelling (A B C & D)
Number
Average Value
Number
Average Value
Number
Average Value
Number
Average Value
Number
Average Value
Number
Average Value
LOANS ORIGINATED
6
$112,387
55
$137,125
28
$164,692
7
$49,371
20
$152,871
9
$78,956
APPLICATIONS APPROVED, NOT ACCEPTED
1
$104,330
9
$127,313
7
$129,126
2
$41,300
2
$185,005
4
$53,420
APPLICATIONS DENIED
1
$115,030
11
$116,265
21
$134,030
9
$56,607
3
$128,967
5
$69,856
APPLICATIONS WITHDRAWN
0
$0
6
$119,492
17
$160,109
3
$70,447
2
$80,675
1
$74,400
FILES CLOSED FOR INCOMPLETENESS
0
$0
1
$37,620
4
$178,445
0
$0
0
$0
0
$0
Aggregated Statistics For Year 2005 (Based on 2 partial tracts)
A) FHA, FSA/RHS & VA Home Purchase Loans
B) Conventional Home Purchase Loans
C) Refinancings
D) Home Improvement Loans
F) Non-occupant Loans on < 5 Family Dwellings (A B C & D)
G) Loans On Manufactured Home Dwelling (A B C & D)
Number
Average Value
Number
Average Value
Number
Average Value
Number
Average Value
Number
Average Value
Number
Average Value
LOANS ORIGINATED
6
$111,633
45
$123,434
33
$153,667
6
$57,267
13
$123,458
10
$81,376
APPLICATIONS APPROVED, NOT ACCEPTED
1
$47,820
7
$109,110
7
$91,076
2
$44,390
2
$86,110
4
$68,135
APPLICATIONS DENIED
1
$46,480
15
$90,511
32
$103,183
7
$34,371
4
$79,712
13
$64,629
APPLICATIONS WITHDRAWN
1
$79,090
3
$97,923
19
$125,523
3
$217,917
1
$156,830
2
$77,165
FILES CLOSED FOR INCOMPLETENESS
0
$0
1
$127,070
10
$127,992
0
$0
1
$157,500
0
$0
Aggregated Statistics For Year 2004 (Based on 2 partial tracts)
A) FHA, FSA/RHS & VA Home Purchase Loans
B) Conventional Home Purchase Loans
C) Refinancings
D) Home Improvement Loans
F) Non-occupant Loans on < 5 Family Dwellings (A B C & D)
G) Loans On Manufactured Home Dwelling (A B C & D)
Number
Average Value
Number
Average Value
Number
Average Value
Number
Average Value
Number
Average Value
Number
Average Value
LOANS ORIGINATED
5
$95,204
35
$117,737
41
$136,896
5
$43,438
12
$141,925
11
$70,483
APPLICATIONS APPROVED, NOT ACCEPTED
1
$70,390
6
$116,817
6
$135,850
1
$30,100
1
$103,330
4
$54,550
APPLICATIONS DENIED
1
$148,980
9
$76,299
28
$104,972
6
$57,043
2
$118,795
10
$52,183
APPLICATIONS WITHDRAWN
1
$129,080
3
$113,417
24
$115,257
1
$61,700
2
$112,860
3
$91,627
FILES CLOSED FOR INCOMPLETENESS
0
$0
1
$123,560
10
$125,885
0
$0
0
$0
1
$33,270
Aggregated Statistics For Year 2003 (Based on 2 partial tracts)
A) FHA, FSA/RHS & VA Home Purchase Loans
B) Conventional Home Purchase Loans
C) Refinancings
D) Home Improvement Loans
F) Non-occupant Loans on < 5 Family Dwellings (A B C & D)
Number
Average Value
Number
Average Value
Number
Average Value
Number
Average Value
Number
Average Value
LOANS ORIGINATED
5
$121,020
32
$108,544
67
$127,259
4
$31,892
14
$102,565
APPLICATIONS APPROVED, NOT ACCEPTED
0
$0
4
$100,152
7
$109,707
2
$43,305
1
$47,820
APPLICATIONS DENIED
1
$53,000
10
$76,812
36
$112,261
6
$23,437
3
$95,750
APPLICATIONS WITHDRAWN
1
$91,120
4
$84,562
22
$121,798
1
$50,830
1
$58,020
FILES CLOSED FOR INCOMPLETENESS
0
$0
1
$98,820
3
$114,700
1
$40,130
0
$0
Aggregated Statistics For Year 2002 (Based on 2 partial tracts)
A) FHA, FSA/RHS & VA Home Purchase Loans
B) Conventional Home Purchase Loans
C) Refinancings
D) Home Improvement Loans
F) Non-occupant Loans on < 5 Family Dwellings (A B C & D)
Number
Average Value
Number
Average Value
Number
Average Value
Number
Average Value
Number
Average Value
LOANS ORIGINATED
6
$86,387
26
$110,538
43
$115,535
4
$28,465
7
$109,874
APPLICATIONS APPROVED, NOT ACCEPTED
0
$0
5
$61,630
7
$109,157
1
$23,070
1
$111,520
APPLICATIONS DENIED
1
$52,170
9
$67,308
15
$112,447
3
$29,760
3
$97,033
APPLICATIONS WITHDRAWN
0
$0
3
$95,247
13
$111,162
1
$26,250
1
$83,100
FILES CLOSED FOR INCOMPLETENESS
0
$0
1
$124,060
5
$115,468
0
$0
0
$0
Aggregated Statistics For Year 2001 (Based on 2 partial tracts)
A) FHA, FSA/RHS & VA Home Purchase Loans
B) Conventional Home Purchase Loans
C) Refinancings
D) Home Improvement Loans
F) Non-occupant Loans on < 5 Family Dwellings (A B C & D)
Number
Average Value
Number
Average Value
Number
Average Value
Number
Average Value
Number
Average Value
LOANS ORIGINATED
4
$102,368
29
$95,298
29
$109,971
5
$29,326
5
$81,026
APPLICATIONS APPROVED, NOT ACCEPTED
0
$0
7
$57,397
4
$86,192
1
$29,090
0
$0
APPLICATIONS DENIED
0
$0
13
$64,051
17
$74,650
3
$26,193
1
$61,030
APPLICATIONS WITHDRAWN
1
$34,780
2
$64,540
11
$98,755
1
$18,730
0
$0
FILES CLOSED FOR INCOMPLETENESS
0
$0
0
$0
2
$102,910
0
$0
0
$0
Aggregated Statistics For Year 2000 (Based on 2 partial tracts)
A) FHA, FSA/RHS & VA Home Purchase Loans
B) Conventional Home Purchase Loans
C) Refinancings
D) Home Improvement Loans
F) Non-occupant Loans on < 5 Family Dwellings (A B C & D)
Number
Average Value
Number
Average Value
Number
Average Value
Number
Average Value
Number
Average Value
LOANS ORIGINATED
4
$77,705
28
$83,194
14
$110,806
4
$27,002
5
$78,518
APPLICATIONS APPROVED, NOT ACCEPTED
1
$41,630
6
$72,537
4
$75,575
1
$20,900
1
$20,570
APPLICATIONS DENIED
1
$64,540
18
$54,033
8
$84,018
3
$27,977
1
$34,940
APPLICATIONS WITHDRAWN
2
$90,455
2
$124,395
4
$70,685
0
$0
0
$0
FILES CLOSED FOR INCOMPLETENESS
0
$0
1
$47,820
3
$86,667
0
$0
0
$0
Aggregated Statistics For Year 1999 (Based on 1 partial tract)
A) FHA, FSA/RHS & VA Home Purchase Loans
B) Conventional Home Purchase Loans
C) Refinancings
D) Home Improvement Loans
F) Non-occupant Loans on < 5 Family Dwellings (A B C & D)

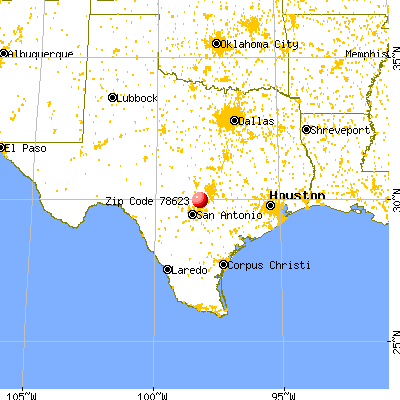


 Nearest zip codes: 78133, 78676, 78070, 78132, 78619, 78620.


 (Location: 8555 FM 32, Grades: 9-12)