Estimated zip code population in 2022: 20,427
Zip code population in 2010: 14,367
Zip code population in 2000: 9,689
Houses and condos: 7,773
Renter-occupied apartments: 1,033
% of renters here:
14%State:
38%
March 2022 cost of living index in zip code 78620: 83.2
(low, U.S. average is 100)
Land area: 171.0
sq. mi.
Water area: 0.4
sq. mi.
Population density: 119 people per square mile (very low).
OSM Map
General Map
Google Map
MSN Map
OSM Map
General Map
Google Map
MSN Map
OSM Map
General Map
Google Map
MSN Map
OSM Map
General Map
Google Map
MSN Map
Please wait while loading the map...
Real estate property taxes paid for housing units in 2022:
This zip code:
1.3% ($8,683)Texas:
1.5% ($4,050)
Median real estate property taxes paid for housing units with mortgages in 2022: $8,740 (1.3%)
Median real estate property taxes paid for housing units with no mortgage in 2022: $8,825 (1.3%)
Profiles of local businesses
Business Search - 14 Million verified businesses
Males: 10,705 Females: 9,722
For population 25 years and over in 78620:
High school or higher: 99.8%Bachelor's degree or higher: 64.9%Graduate or professional degree: 21.4%Unemployed: 2.4%Mean travel time to work (commute): 31.5 minutes
For population 15 years and over in 78620:
Never married: 26.4%Now married: 63.5%Separated: 0.3%Widowed: 3.3%Divorced: 6.4%
Zip code 78620 compared to state average:
Median household income above state average. Median house value significantly above state average. Unemployed percentage below state average. Black race population percentage significantly below state average. Hispanic race population percentage significantly below state average. Median age above state average. Foreign-born population percentage below state average. Renting percentage significantly below state average. Length of stay since moving in below state average. Number of rooms per house above state average. House age significantly below state average. Percentage of population with a bachelor's degree or higher above state average. 16,267 79.6% White 2,219 10.9% Hispanic or Latino 875 4.3% Two or more races 538 2.6% Asian 218 1.1% Black 223 1.1% Some other race 78 0.4% Native Hawaiian and Other 6 0.03% American Indian
Data:
Median household income ($)
Median household income (% change since 2000)
Household income diversity
Ratio of average income to average house value (%)
Ratio of average income to average rent
Median household income ($) - White
Median household income ($) - Black or African American
Median household income ($) - Asian
Median household income ($) - Hispanic or Latino
Median household income ($) - American Indian and Alaska Native
Median household income ($) - Multirace
Median household income ($) - Other Race
Median household income for houses/condos with a mortgage ($)
Median household income for apartments without a mortgage ($)
Races - White alone (%)
Races - White alone (% change since 2000)
Races - Black alone (%)
Races - Black alone (% change since 2000)
Races - American Indian alone (%)
Races - American Indian alone (% change since 2000)
Races - Asian alone (%)
Races - Asian alone (% change since 2000)
Races - Hispanic (%)
Races - Hispanic (% change since 2000)
Races - Native Hawaiian and Other Pacific Islander alone (%)
Races - Native Hawaiian and Other Pacific Islander alone (% change since 2000)
Races - Two or more races (%)
Races - Two or more races (% change since 2000)
Races - Other race alone (%)
Races - Other race alone (% change since 2000)
Racial diversity
Unemployment (%)
Unemployment (% change since 2000)
Unemployment (%) - White
Unemployment (%) - Black or African American
Unemployment (%) - Asian
Unemployment (%) - Hispanic or Latino
Unemployment (%) - American Indian and Alaska Native
Unemployment (%) - Multirace
Unemployment (%) - Other Race
Population density (people per square mile)
Population - Males (%)
Population - Females (%)
Population - Males (%) - White
Population - Males (%) - Black or African American
Population - Males (%) - Asian
Population - Males (%) - Hispanic or Latino
Population - Males (%) - American Indian and Alaska Native
Population - Males (%) - Multirace
Population - Males (%) - Other Race
Population - Females (%) - White
Population - Females (%) - Black or African American
Population - Females (%) - Asian
Population - Females (%) - Hispanic or Latino
Population - Females (%) - American Indian and Alaska Native
Population - Females (%) - Multirace
Population - Females (%) - Other Race
Coronavirus confirmed cases (Apr 27, 2024)
Deaths caused by coronavirus (Apr 27, 2024)
Coronavirus confirmed cases (per 100k population) (Apr 27, 2024)
Deaths caused by coronavirus (per 100k population) (Apr 27, 2024)
Daily increase in number of cases (Apr 27, 2024)
Weekly increase in number of cases (Apr 27, 2024)
Cases doubled (in days) (Apr 27, 2024)
Hospitalized patients (Apr 18, 2022)
Negative test results (Apr 18, 2022)
Total test results (Apr 18, 2022)
COVID Vaccine doses distributed (per 100k population) (Sep 19, 2023)
COVID Vaccine doses administered (per 100k population) (Sep 19, 2023)
COVID Vaccine doses distributed (Sep 19, 2023)
COVID Vaccine doses administered (Sep 19, 2023)
Likely homosexual households (%)
Likely homosexual households (% change since 2000)
Likely homosexual households - Lesbian couples (%)
Likely homosexual households - Lesbian couples (% change since 2000)
Likely homosexual households - Gay men (%)
Likely homosexual households - Gay men (% change since 2000)
Cost of living index
Median gross rent ($)
Median contract rent ($)
Median monthly housing costs ($)
Median house or condo value ($)
Median house or condo value ($ change since 2000)
Mean house or condo value by units in structure - 1, detached ($)
Mean house or condo value by units in structure - 1, attached ($)
Mean house or condo value by units in structure - 2 ($)
Mean house or condo value by units in structure by units in structure - 3 or 4 ($)
Mean house or condo value by units in structure - 5 or more ($)
Mean house or condo value by units in structure - Boat, RV, van, etc. ($)
Mean house or condo value by units in structure - Mobile home ($)
Median house or condo value ($) - White
Median house or condo value ($) - Black or African American
Median house or condo value ($) - Asian
Median house or condo value ($) - Hispanic or Latino
Median house or condo value ($) - American Indian and Alaska Native
Median house or condo value ($) - Multirace
Median house or condo value ($) - Other Race
Median resident age
Resident age diversity
Median resident age - Males
Median resident age - Females
Median resident age - White
Median resident age - Black or African American
Median resident age - Asian
Median resident age - Hispanic or Latino
Median resident age - American Indian and Alaska Native
Median resident age - Multirace
Median resident age - Other Race
Median resident age - Males - White
Median resident age - Males - Black or African American
Median resident age - Males - Asian
Median resident age - Males - Hispanic or Latino
Median resident age - Males - American Indian and Alaska Native
Median resident age - Males - Multirace
Median resident age - Males - Other Race
Median resident age - Females - White
Median resident age - Females - Black or African American
Median resident age - Females - Asian
Median resident age - Females - Hispanic or Latino
Median resident age - Females - American Indian and Alaska Native
Median resident age - Females - Multirace
Median resident age - Females - Other Race
Commute - mean travel time to work (minutes)
Travel time to work - Less than 5 minutes (%)
Travel time to work - Less than 5 minutes (% change since 2000)
Travel time to work - 5 to 9 minutes (%)
Travel time to work - 5 to 9 minutes (% change since 2000)
Travel time to work - 10 to 19 minutes (%)
Travel time to work - 10 to 19 minutes (% change since 2000)
Travel time to work - 20 to 29 minutes (%)
Travel time to work - 20 to 29 minutes (% change since 2000)
Travel time to work - 30 to 39 minutes (%)
Travel time to work - 30 to 39 minutes (% change since 2000)
Travel time to work - 40 to 59 minutes (%)
Travel time to work - 40 to 59 minutes (% change since 2000)
Travel time to work - 60 to 89 minutes (%)
Travel time to work - 60 to 89 minutes (% change since 2000)
Travel time to work - 90 or more minutes (%)
Travel time to work - 90 or more minutes (% change since 2000)
Marital status - Never married (%)
Marital status - Now married (%)
Marital status - Separated (%)
Marital status - Widowed (%)
Marital status - Divorced (%)
Median family income ($)
Median family income (% change since 2000)
Median non-family income ($)
Median non-family income (% change since 2000)
Median per capita income ($)
Median per capita income (% change since 2000)
Median family income ($) - White
Median family income ($) - Black or African American
Median family income ($) - Asian
Median family income ($) - Hispanic or Latino
Median family income ($) - American Indian and Alaska Native
Median family income ($) - Multirace
Median family income ($) - Other Race
Median year house/condo built
Median year apartment built
Year house built - Built 2005 or later (%)
Year house built - Built 2000 to 2004 (%)
Year house built - Built 1990 to 1999 (%)
Year house built - Built 1980 to 1989 (%)
Year house built - Built 1970 to 1979 (%)
Year house built - Built 1960 to 1969 (%)
Year house built - Built 1950 to 1959 (%)
Year house built - Built 1940 to 1949 (%)
Year house built - Built 1939 or earlier (%)
Average household size
Household density (households per square mile)
Average household size - White
Average household size - Black or African American
Average household size - Asian
Average household size - Hispanic or Latino
Average household size - American Indian and Alaska Native
Average household size - Multirace
Average household size - Other Race
Occupied housing units (%)
Vacant housing units (%)
Owner occupied housing units (%)
Renter occupied housing units (%)
Vacancy status - For rent (%)
Vacancy status - For sale only (%)
Vacancy status - Rented or sold, not occupied (%)
Vacancy status - For seasonal, recreational, or occasional use (%)
Vacancy status - For migrant workers (%)
Vacancy status - Other vacant (%)
Residents with income below the poverty level (%)
Residents with income below 50% of the poverty level (%)
Children below poverty level (%)
Poor families by family type - Married-couple family (%)
Poor families by family type - Male, no wife present (%)
Poor families by family type - Female, no husband present (%)
Poverty status for native-born residents (%)
Poverty status for foreign-born residents (%)
Poverty among high school graduates not in families (%)
Poverty among people who did not graduate high school not in families (%)
Residents with income below the poverty level (%) - White
Residents with income below the poverty level (%) - Black or African American
Residents with income below the poverty level (%) - Asian
Residents with income below the poverty level (%) - Hispanic or Latino
Residents with income below the poverty level (%) - American Indian and Alaska Native
Residents with income below the poverty level (%) - Multirace
Residents with income below the poverty level (%) - Other Race
Air pollution - Air Quality Index (AQI)
Air pollution - CO
Air pollution - NO2
Air pollution - SO2
Air pollution - Ozone
Air pollution - PM10
Air pollution - PM25
Air pollution - Pb
Crime - Murders per 100,000 population
Crime - Rapes per 100,000 population
Crime - Robberies per 100,000 population
Crime - Assaults per 100,000 population
Crime - Burglaries per 100,000 population
Crime - Thefts per 100,000 population
Crime - Auto thefts per 100,000 population
Crime - Arson per 100,000 population
Crime - City-data.com crime index
Crime - Violent crime index
Crime - Property crime index
Crime - Murders per 100,000 population (5 year average)
Crime - Rapes per 100,000 population (5 year average)
Crime - Robberies per 100,000 population (5 year average)
Crime - Assaults per 100,000 population (5 year average)
Crime - Burglaries per 100,000 population (5 year average)
Crime - Thefts per 100,000 population (5 year average)
Crime - Auto thefts per 100,000 population (5 year average)
Crime - Arson per 100,000 population (5 year average)
Crime - City-data.com crime index (5 year average)
Crime - Violent crime index (5 year average)
Crime - Property crime index (5 year average)
1996 Presidential Elections Results (%) - Democratic Party (Clinton)
1996 Presidential Elections Results (%) - Republican Party (Dole)
1996 Presidential Elections Results (%) - Other
2000 Presidential Elections Results (%) - Democratic Party (Gore)
2000 Presidential Elections Results (%) - Republican Party (Bush)
2000 Presidential Elections Results (%) - Other
2004 Presidential Elections Results (%) - Democratic Party (Kerry)
2004 Presidential Elections Results (%) - Republican Party (Bush)
2004 Presidential Elections Results (%) - Other
2008 Presidential Elections Results (%) - Democratic Party (Obama)
2008 Presidential Elections Results (%) - Republican Party (McCain)
2008 Presidential Elections Results (%) - Other
2012 Presidential Elections Results (%) - Democratic Party (Obama)
2012 Presidential Elections Results (%) - Republican Party (Romney)
2012 Presidential Elections Results (%) - Other
2016 Presidential Elections Results (%) - Democratic Party (Clinton)
2016 Presidential Elections Results (%) - Republican Party (Trump)
2016 Presidential Elections Results (%) - Other
2020 Presidential Elections Results (%) - Democratic Party (Biden)
2020 Presidential Elections Results (%) - Republican Party (Trump)
2020 Presidential Elections Results (%) - Other
Ancestries Reported - Arab (%)
Ancestries Reported - Czech (%)
Ancestries Reported - Danish (%)
Ancestries Reported - Dutch (%)
Ancestries Reported - English (%)
Ancestries Reported - French (%)
Ancestries Reported - French Canadian (%)
Ancestries Reported - German (%)
Ancestries Reported - Greek (%)
Ancestries Reported - Hungarian (%)
Ancestries Reported - Irish (%)
Ancestries Reported - Italian (%)
Ancestries Reported - Lithuanian (%)
Ancestries Reported - Norwegian (%)
Ancestries Reported - Polish (%)
Ancestries Reported - Portuguese (%)
Ancestries Reported - Russian (%)
Ancestries Reported - Scotch-Irish (%)
Ancestries Reported - Scottish (%)
Ancestries Reported - Slovak (%)
Ancestries Reported - Subsaharan African (%)
Ancestries Reported - Swedish (%)
Ancestries Reported - Swiss (%)
Ancestries Reported - Ukrainian (%)
Ancestries Reported - United States (%)
Ancestries Reported - Welsh (%)
Ancestries Reported - West Indian (%)
Ancestries Reported - Other (%)
Educational Attainment - No schooling completed (%)
Educational Attainment - Less than high school (%)
Educational Attainment - High school or equivalent (%)
Educational Attainment - Less than 1 year of college (%)
Educational Attainment - 1 or more years of college (%)
Educational Attainment - Associate degree (%)
Educational Attainment - Bachelor's degree (%)
Educational Attainment - Master's degree (%)
Educational Attainment - Professional school degree (%)
Educational Attainment - Doctorate degree (%)
School Enrollment - Nursery, preschool (%)
School Enrollment - Kindergarten (%)
School Enrollment - Grade 1 to 4 (%)
School Enrollment - Grade 5 to 8 (%)
School Enrollment - Grade 9 to 12 (%)
School Enrollment - College undergrad (%)
School Enrollment - Graduate or professional (%)
School Enrollment - Not enrolled in school (%)
School enrollment - Public schools (%)
School enrollment - Private schools (%)
School enrollment - Not enrolled (%)
Median number of rooms in houses and condos
Median number of rooms in apartments
Housing units lacking complete plumbing facilities (%)
Housing units lacking complete kitchen facilities (%)
Density of houses
Urban houses (%)
Rural houses (%)
Households with people 60 years and over (%)
Households with people 65 years and over (%)
Households with people 75 years and over (%)
Households with one or more nonrelatives (%)
Households with no nonrelatives (%)
Population in households (%)
Family households (%)
Nonfamily households (%)
Population in families (%)
Family households with own children (%)
Median number of bedrooms in owner occupied houses
Mean number of bedrooms in owner occupied houses
Median number of bedrooms in renter occupied houses
Mean number of bedrooms in renter occupied houses
Median number of vehichles in owner occupied houses
Mean number of vehichles in owner occupied houses
Median number of vehichles in renter occupied houses
Mean number of vehichles in renter occupied houses
Mortgage status - with mortgage (%)
Mortgage status - with second mortgage (%)
Mortgage status - with home equity loan (%)
Mortgage status - with both second mortgage and home equity loan (%)
Mortgage status - without a mortgage (%)
Average family size
Average family size - White
Average family size - Black or African American
Average family size - Asian
Average family size - Hispanic or Latino
Average family size - American Indian and Alaska Native
Average family size - Multirace
Average family size - Other Race
Geographical mobility - Same house 1 year ago (%)
Geographical mobility - Moved within same county (%)
Geographical mobility - Moved from different county within same state (%)
Geographical mobility - Moved from different state (%)
Geographical mobility - Moved from abroad (%)
Place of birth - Born in state of residence (%)
Place of birth - Born in other state (%)
Place of birth - Native, outside of US (%)
Place of birth - Foreign born (%)
Housing units in structures - 1, detached (%)
Housing units in structures - 1, attached (%)
Housing units in structures - 2 (%)
Housing units in structures - 3 or 4 (%)
Housing units in structures - 5 to 9 (%)
Housing units in structures - 10 to 19 (%)
Housing units in structures - 20 to 49 (%)
Housing units in structures - 50 or more (%)
Housing units in structures - Mobile home (%)
Housing units in structures - Boat, RV, van, etc. (%)
House/condo owner moved in on average (years ago)
Renter moved in on average (years ago)
Year householder moved into unit - Moved in 1999 to March 2000 (%)
Year householder moved into unit - Moved in 1995 to 1998 (%)
Year householder moved into unit - Moved in 1990 to 1994 (%)
Year householder moved into unit - Moved in 1980 to 1989 (%)
Year householder moved into unit - Moved in 1970 to 1979 (%)
Year householder moved into unit - Moved in 1969 or earlier (%)
Means of transportation to work - Drove car alone (%)
Means of transportation to work - Carpooled (%)
Means of transportation to work - Public transportation (%)
Means of transportation to work - Bus or trolley bus (%)
Means of transportation to work - Streetcar or trolley car (%)
Means of transportation to work - Subway or elevated (%)
Means of transportation to work - Railroad (%)
Means of transportation to work - Ferryboat (%)
Means of transportation to work - Taxicab (%)
Means of transportation to work - Motorcycle (%)
Means of transportation to work - Bicycle (%)
Means of transportation to work - Walked (%)
Means of transportation to work - Other means (%)
Working at home (%)
Industry diversity
Most Common Industries - Agriculture, forestry, fishing and hunting, and mining (%)
Most Common Industries - Agriculture, forestry, fishing and hunting (%)
Most Common Industries - Mining, quarrying, and oil and gas extraction (%)
Most Common Industries - Construction (%)
Most Common Industries - Manufacturing (%)
Most Common Industries - Wholesale trade (%)
Most Common Industries - Retail trade (%)
Most Common Industries - Transportation and warehousing, and utilities (%)
Most Common Industries - Transportation and warehousing (%)
Most Common Industries - Utilities (%)
Most Common Industries - Information (%)
Most Common Industries - Finance and insurance, and real estate and rental and leasing (%)
Most Common Industries - Finance and insurance (%)
Most Common Industries - Real estate and rental and leasing (%)
Most Common Industries - Professional, scientific, and management, and administrative and waste management services (%)
Most Common Industries - Professional, scientific, and technical services (%)
Most Common Industries - Management of companies and enterprises (%)
Most Common Industries - Administrative and support and waste management services (%)
Most Common Industries - Educational services, and health care and social assistance (%)
Most Common Industries - Educational services (%)
Most Common Industries - Health care and social assistance (%)
Most Common Industries - Arts, entertainment, and recreation, and accommodation and food services (%)
Most Common Industries - Arts, entertainment, and recreation (%)
Most Common Industries - Accommodation and food services (%)
Most Common Industries - Other services, except public administration (%)
Most Common Industries - Public administration (%)
Occupation diversity
Most Common Occupations - Management, business, science, and arts occupations (%)
Most Common Occupations - Management, business, and financial occupations (%)
Most Common Occupations - Management occupations (%)
Most Common Occupations - Business and financial operations occupations (%)
Most Common Occupations - Computer, engineering, and science occupations (%)
Most Common Occupations - Computer and mathematical occupations (%)
Most Common Occupations - Architecture and engineering occupations (%)
Most Common Occupations - Life, physical, and social science occupations (%)
Most Common Occupations - Education, legal, community service, arts, and media occupations (%)
Most Common Occupations - Community and social service occupations (%)
Most Common Occupations - Legal occupations (%)
Most Common Occupations - Education, training, and library occupations (%)
Most Common Occupations - Arts, design, entertainment, sports, and media occupations (%)
Most Common Occupations - Healthcare practitioners and technical occupations (%)
Most Common Occupations - Health diagnosing and treating practitioners and other technical occupations (%)
Most Common Occupations - Health technologists and technicians (%)
Most Common Occupations - Service occupations (%)
Most Common Occupations - Healthcare support occupations (%)
Most Common Occupations - Protective service occupations (%)
Most Common Occupations - Fire fighting and prevention, and other protective service workers including supervisors (%)
Most Common Occupations - Law enforcement workers including supervisors (%)
Most Common Occupations - Food preparation and serving related occupations (%)
Most Common Occupations - Building and grounds cleaning and maintenance occupations (%)
Most Common Occupations - Personal care and service occupations (%)
Most Common Occupations - Sales and office occupations (%)
Most Common Occupations - Sales and related occupations (%)
Most Common Occupations - Office and administrative support occupations (%)
Most Common Occupations - Natural resources, construction, and maintenance occupations (%)
Most Common Occupations - Farming, fishing, and forestry occupations (%)
Most Common Occupations - Construction and extraction occupations (%)
Most Common Occupations - Installation, maintenance, and repair occupations (%)
Most Common Occupations - Production, transportation, and material moving occupations (%)
Most Common Occupations - Production occupations (%)
Most Common Occupations - Transportation occupations (%)
Most Common Occupations - Material moving occupations (%)
People in Group quarters - Institutionalized population (%)
People in Group quarters - Correctional institutions (%)
People in Group quarters - Federal prisons and detention centers (%)
People in Group quarters - Halfway houses (%)
People in Group quarters - Local jails and other confinement facilities (including police lockups) (%)
People in Group quarters - Military disciplinary barracks (%)
People in Group quarters - State prisons (%)
People in Group quarters - Other types of correctional institutions (%)
People in Group quarters - Nursing homes (%)
People in Group quarters - Hospitals/wards, hospices, and schools for the handicapped (%)
People in Group quarters - Hospitals/wards and hospices for chronically ill (%)
People in Group quarters - Hospices or homes for chronically ill (%)
People in Group quarters - Military hospitals or wards for chronically ill (%)
People in Group quarters - Other hospitals or wards for chronically ill (%)
People in Group quarters - Hospitals or wards for drug/alcohol abuse (%)
People in Group quarters - Mental (Psychiatric) hospitals or wards (%)
People in Group quarters - Schools, hospitals, or wards for the mentally retarded (%)
People in Group quarters - Schools, hospitals, or wards for the physically handicapped (%)
People in Group quarters - Institutions for the deaf (%)
People in Group quarters - Institutions for the blind (%)
People in Group quarters - Orthopedic wards and institutions for the physically handicapped (%)
People in Group quarters - Wards in general hospitals for patients who have no usual home elsewhere (%)
People in Group quarters - Wards in military hospitals for patients who have no usual home elsewhere (%)
People in Group quarters - Juvenile institutions (%)
People in Group quarters - Long-term care (%)
People in Group quarters - Homes for abused, dependent, and neglected children (%)
People in Group quarters - Residential treatment centers for emotionally disturbed children (%)
People in Group quarters - Training schools for juvenile delinquents (%)
People in Group quarters - Short-term care, detention or diagnostic centers for delinquent children (%)
People in Group quarters - Type of juvenile institution unknown (%)
People in Group quarters - Noninstitutionalized population (%)
People in Group quarters - College dormitories (includes college quarters off campus) (%)
People in Group quarters - Military quarters (%)
People in Group quarters - On base (%)
People in Group quarters - Barracks, unaccompanied personnel housing (UPH), (Enlisted/Officer), ;and similar group living quarters for military personnel (%)
People in Group quarters - Transient quarters for temporary residents (%)
People in Group quarters - Military ships (%)
People in Group quarters - Group homes (%)
People in Group quarters - Homes or halfway houses for drug/alcohol abuse (%)
People in Group quarters - Homes for the mentally ill (%)
People in Group quarters - Homes for the mentally retarded (%)
People in Group quarters - Homes for the physically handicapped (%)
People in Group quarters - Other group homes (%)
People in Group quarters - Religious group quarters (%)
People in Group quarters - Dormitories (%)
People in Group quarters - Agriculture workers' dormitories on farms (%)
People in Group quarters - Job Corps and vocational training facilities (%)
People in Group quarters - Other workers' dormitories (%)
People in Group quarters - Crews of maritime vessels (%)
People in Group quarters - Other nonhousehold living situations (%)
People in Group quarters - Other noninstitutional group quarters (%)
Residents speaking English at home (%)
Residents speaking English at home - Born in the United States (%)
Residents speaking English at home - Native, born elsewhere (%)
Residents speaking English at home - Foreign born (%)
Residents speaking Spanish at home (%)
Residents speaking Spanish at home - Born in the United States (%)
Residents speaking Spanish at home - Native, born elsewhere (%)
Residents speaking Spanish at home - Foreign born (%)
Residents speaking other language at home (%)
Residents speaking other language at home - Born in the United States (%)
Residents speaking other language at home - Native, born elsewhere (%)
Residents speaking other language at home - Foreign born (%)
Class of Workers - Employee of private company (%)
Class of Workers - Self-employed in own incorporated business (%)
Class of Workers - Private not-for-profit wage and salary workers (%)
Class of Workers - Local government workers (%)
Class of Workers - State government workers (%)
Class of Workers - Federal government workers (%)
Class of Workers - Self-employed workers in own not incorporated business and Unpaid family workers (%)
House heating fuel used in houses and condos - Utility gas (%)
House heating fuel used in houses and condos - Bottled, tank, or LP gas (%)
House heating fuel used in houses and condos - Electricity (%)
House heating fuel used in houses and condos - Fuel oil, kerosene, etc. (%)
House heating fuel used in houses and condos - Coal or coke (%)
House heating fuel used in houses and condos - Wood (%)
House heating fuel used in houses and condos - Solar energy (%)
House heating fuel used in houses and condos - Other fuel (%)
House heating fuel used in houses and condos - No fuel used (%)
House heating fuel used in apartments - Utility gas (%)
House heating fuel used in apartments - Bottled, tank, or LP gas (%)
House heating fuel used in apartments - Electricity (%)
House heating fuel used in apartments - Fuel oil, kerosene, etc. (%)
House heating fuel used in apartments - Coal or coke (%)
House heating fuel used in apartments - Wood (%)
House heating fuel used in apartments - Solar energy (%)
House heating fuel used in apartments - Other fuel (%)
House heating fuel used in apartments - No fuel used (%)
Armed forces status - In Armed Forces (%)
Armed forces status - Civilian (%)
Armed forces status - Civilian - Veteran (%)
Armed forces status - Civilian - Nonveteran (%)
Fatal accidents locations in years 2005-2021
Fatal accidents locations in 2005
Fatal accidents locations in 2006
Fatal accidents locations in 2007
Fatal accidents locations in 2008
Fatal accidents locations in 2009
Fatal accidents locations in 2010
Fatal accidents locations in 2011
Fatal accidents locations in 2012
Fatal accidents locations in 2013
Fatal accidents locations in 2014
Fatal accidents locations in 2015
Fatal accidents locations in 2016
Fatal accidents locations in 2017
Fatal accidents locations in 2018
Fatal accidents locations in 2019
Fatal accidents locations in 2020
Fatal accidents locations in 2021
Alcohol use - People drinking some alcohol every month (%)
Alcohol use - People not drinking at all (%)
Alcohol use - Average days/month drinking alcohol
Alcohol use - Average drinks/week
Alcohol use - Average days/year people drink much
Audiometry - Average condition of hearing (%)
Audiometry - People that can hear a whisper from across a quiet room (%)
Audiometry - People that can hear normal voice from across a quiet room (%)
Audiometry - Ears ringing, roaring, buzzing (%)
Audiometry - Had a job exposure to loud noise (%)
Audiometry - Had off-work exposure to loud noise (%)
Blood Pressure & Cholesterol - Has high blood pressure (%)
Blood Pressure & Cholesterol - Checking blood pressure at home (%)
Blood Pressure & Cholesterol - Frequently checking blood cholesterol (%)
Blood Pressure & Cholesterol - Has high cholesterol level (%)
Consumer Behavior - Money monthly spent on food at supermarket/grocery store
Consumer Behavior - Money monthly spent on food at other stores
Consumer Behavior - Money monthly spent on eating out
Consumer Behavior - Money monthly spent on carryout/delivered foods
Consumer Behavior - Income spent on food at supermarket/grocery store (%)
Consumer Behavior - Income spent on food at other stores (%)
Consumer Behavior - Income spent on eating out (%)
Consumer Behavior - Income spent on carryout/delivered foods (%)
Current Health Status - General health condition (%)
Current Health Status - Blood donors (%)
Current Health Status - Has blood ever tested for HIV virus (%)
Current Health Status - Left-handed people (%)
Dermatology - People using sunscreen (%)
Diabetes - Diabetics (%)
Diabetes - Had a blood test for high blood sugar (%)
Diabetes - People taking insulin (%)
Diet Behavior & Nutrition - Diet health (%)
Diet Behavior & Nutrition - Milk product consumption (# of products/month)
Diet Behavior & Nutrition - Meals not home prepared (#/week)
Diet Behavior & Nutrition - Meals from fast food or pizza place (#/week)
Diet Behavior & Nutrition - Ready-to-eat foods (#/month)
Diet Behavior & Nutrition - Frozen meals/pizza (#/month)
Drug Use - People that ever used marijuana or hashish (%)
Drug Use - Ever used hard drugs (%)
Drug Use - Ever used any form of cocaine (%)
Drug Use - Ever used heroin (%)
Drug Use - Ever used methamphetamine (%)
Health Insurance - People covered by health insurance (%)
Kidney Conditions-Urology - Avg. # of times urinating at night
Medical Conditions - People with asthma (%)
Medical Conditions - People with anemia (%)
Medical Conditions - People with psoriasis (%)
Medical Conditions - People with overweight (%)
Medical Conditions - Elderly people having difficulties in thinking or remembering (%)
Medical Conditions - People who ever received blood transfusion (%)
Medical Conditions - People having trouble seeing even with glass/contacts (%)
Medical Conditions - People with arthritis (%)
Medical Conditions - People with gout (%)
Medical Conditions - People with congestive heart failure (%)
Medical Conditions - People with coronary heart disease (%)
Medical Conditions - People with angina pectoris (%)
Medical Conditions - People who ever had heart attack (%)
Medical Conditions - People who ever had stroke (%)
Medical Conditions - People with emphysema (%)
Medical Conditions - People with thyroid problem (%)
Medical Conditions - People with chronic bronchitis (%)
Medical Conditions - People with any liver condition (%)
Medical Conditions - People who ever had cancer or malignancy (%)
Mental Health - People who have little interest in doing things (%)
Mental Health - People feeling down, depressed, or hopeless (%)
Mental Health - People who have trouble sleeping or sleeping too much (%)
Mental Health - People feeling tired or having little energy (%)
Mental Health - People with poor appetite or overeating (%)
Mental Health - People feeling bad about themself (%)
Mental Health - People who have trouble concentrating on things (%)
Mental Health - People moving or speaking slowly or too fast (%)
Mental Health - People having thoughts they would be better off dead (%)
Oral Health - Average years since last visit a dentist
Oral Health - People embarrassed because of mouth (%)
Oral Health - People with gum disease (%)
Oral Health - General health of teeth and gums (%)
Oral Health - Average days a week using dental floss/device
Oral Health - Average days a week using mouthwash for dental problem
Oral Health - Average number of teeth
Pesticide Use - Households using pesticides to control insects (%)
Pesticide Use - Households using pesticides to kill weeds (%)
Physical Activity - People doing vigorous-intensity work activities (%)
Physical Activity - People doing moderate-intensity work activities (%)
Physical Activity - People walking or bicycling (%)
Physical Activity - People doing vigorous-intensity recreational activities (%)
Physical Activity - People doing moderate-intensity recreational activities (%)
Physical Activity - Average hours a day doing sedentary activities
Physical Activity - Average hours a day watching TV or videos
Physical Activity - Average hours a day using computer
Physical Functioning - People having limitations keeping them from working (%)
Physical Functioning - People limited in amount of work they can do (%)
Physical Functioning - People that need special equipment to walk (%)
Physical Functioning - People experiencing confusion/memory problems (%)
Physical Functioning - People requiring special healthcare equipment (%)
Prescription Medications - Average number of prescription medicines taking
Preventive Aspirin Use - Adults 40+ taking low-dose aspirin (%)
Reproductive Health - Vaginal deliveries (%)
Reproductive Health - Cesarean deliveries (%)
Reproductive Health - Deliveries resulted in a live birth (%)
Reproductive Health - Pregnancies resulted in a delivery (%)
Reproductive Health - Women breastfeeding newborns (%)
Reproductive Health - Women that had a hysterectomy (%)
Reproductive Health - Women that had both ovaries removed (%)
Reproductive Health - Women that have ever taken birth control pills (%)
Reproductive Health - Women taking birth control pills (%)
Reproductive Health - Women that have ever used Depo-Provera or injectables (%)
Reproductive Health - Women that have ever used female hormones (%)
Sexual Behavior - People 18+ that ever had sex (vaginal, anal, or oral) (%)
Sexual Behavior - Males 18+ that ever had vaginal sex with a woman (%)
Sexual Behavior - Males 18+ that ever performed oral sex on a woman (%)
Sexual Behavior - Males 18+ that ever had anal sex with a woman (%)
Sexual Behavior - Males 18+ that ever had any sex with a man (%)
Sexual Behavior - Females 18+ that ever had vaginal sex with a man (%)
Sexual Behavior - Females 18+ that ever performed oral sex on a man (%)
Sexual Behavior - Females 18+ that ever had anal sex with a man (%)
Sexual Behavior - Females 18+ that ever had any kind of sex with a woman (%)
Sexual Behavior - Average age people first had sex
Sexual Behavior - Average number of female sex partners in lifetime (males 18+)
Sexual Behavior - Average number of female vaginal sex partners in lifetime (males 18+)
Sexual Behavior - Average age people first performed oral sex on a woman (18+)
Sexual Behavior - Average number of woman performed oral sex on in lifetime (18+)
Sexual Behavior - Average number of male sex partners in lifetime (males 18+)
Sexual Behavior - Average number of male anal sex partners in lifetime (males 18+)
Sexual Behavior - Average age people first performed oral sex on a man (18+)
Sexual Behavior - Average number of male oral sex partners in lifetime (18+)
Sexual Behavior - People using protection when performing oral sex (%)
Sexual Behavior - Average number of times people have vaginal or anal sex a year
Sexual Behavior - People having sex without condom (%)
Sexual Behavior - Average number of male sex partners in lifetime (females 18+)
Sexual Behavior - Average number of male vaginal sex partners in lifetime (females 18+)
Sexual Behavior - Average number of female sex partners in lifetime (females 18+)
Sexual Behavior - Circumcised males 18+ (%)
Sleep Disorders - Average hours sleeping at night
Sleep Disorders - People that has trouble sleeping (%)
Smoking-Cigarette Use - People smoking cigarettes (%)
Taste & Smell - People 40+ having problems with smell (%)
Taste & Smell - People 40+ having problems with taste (%)
Taste & Smell - People 40+ that ever had wisdom teeth removed (%)
Taste & Smell - People 40+ that ever had tonsils teeth removed (%)
Taste & Smell - People 40+ that ever had a loss of consciousness because of a head injury (%)
Taste & Smell - People 40+ that ever had a broken nose or other serious injury to face or skull (%)
Taste & Smell - People 40+ that ever had two or more sinus infections (%)
Weight - Average height (inches)
Weight - Average weight (pounds)
Weight - Average BMI
Weight - People that are obese (%)
Weight - People that ever were obese (%)
Weight - People trying to lose weight (%)
100%
rural population.
Estimated median house/condo value in 2022: $677,276
78620:
$677,276Texas:
$275,400
According to our research of Texas and other state lists, there were 9 registered sex offenders living in 78620 zip code as of April 27, 2024 . The ratio of all residents to sex offenders in zip code 78620 is 1,706 to 1.The ratio of registered sex offenders to all residents in this zip code is much lower than the state average.
Median resident age: This zip code:
42.2 yearsTexas median age:
35.6 years
Average household size: This zip code:
2.7 peopleTexas:
2.6 people
Averages for the 2020 tax year for zip code 78620, filed in 2021:
Average Adjusted Gross Income (AGI) in 2020: $153,014 (Individual Income Tax Returns) Here:
$153,014State:
$77,054
Salary/wage: $113,086 (reported on 77.8% of returns )Here:
$113,086State:
$62,766
(% of AGI for various income ranges: 1158.3% for AGIs below $25k , 3554.5% for AGIs $25k-50k , 6404.9% for AGIs $50k-75k , 9385.9% for AGIs $75k-100k , 19444.5% for AGIs $100k-200k , 86490.7% for AGIs over 200k ) Taxable interest for individuals: $2,435 (reported on 45.8% of returns )This zip code:
$2,435Texas:
$2,665
(% of AGI for various income ranges: 25.4% for AGIs below $25k , 47.3% for AGIs $25k-50k , 84.2% for AGIs $50k-75k , 131.3% for AGIs $75k-100k , 135.6% for AGIs $100k-200k , 1294.8% for AGIs over 200k ) Ordinary dividends: $10,188 (reported on 34.2% of returns )Here:
$10,188State:
$10,044
(% of AGI for various income ranges: 70.5% for AGIs below $25k , 127.3% for AGIs $25k-50k , 251.0% for AGIs $50k-75k , 307.8% for AGIs $75k-100k , 494.6% for AGIs $100k-200k , 4055.2% for AGIs over 200k ) Net capital gain/loss in AGI: +$57,778 (reported on 34.7% of returns )Here:
+$57,778State:
+$39,590
(% of AGI for various income ranges: 57.2% for AGIs below $25k , 107.4% for AGIs $25k-50k , 154.9% for AGIs $50k-75k , 476.1% for AGIs $75k-100k , 1008.7% for AGIs $100k-200k , 31990.5% for AGIs over 200k ) Profit/loss from business: +$25,374 (reported on 25.7% of returns )Here:
+$25,374State:
+$10,888
(% of AGI for various income ranges: 259.9% for AGIs below $25k , 434.2% for AGIs $25k-50k , 814.3% for AGIs $50k-75k , 826.9% for AGIs $75k-100k , 1329.1% for AGIs $100k-200k , 5434.5% for AGIs over 200k ) Taxable individual retirement arrangement distribution: $30,084 (reported on 11.5% of returns )78620:
$30,084Texas:
$24,740
(% of AGI for various income ranges: 73.0% for AGIs below $25k , 191.2% for AGIs $25k-50k , 333.8% for AGIs $50k-75k , 705.9% for AGIs $75k-100k , 1039.2% for AGIs $100k-200k , 2237.2% for AGIs over 200k ) Self-employed (Keogh) retirement plans: $25,467 (reported on 1.4% of returns )78620:
$25,467Texas:
$29,298
(% of AGI for various income ranges: 68.9% for AGIs $100k-200k , 485.0% for AGIs over 200k ) Total itemized deductions: $41,722 (reported on 19.4% of returns )Here:
$41,722State:
$40,428
(% of AGI for various income ranges: 144.6% for AGIs below $25k , 288.5% for AGIs $25k-50k , 571.7% for AGIs $50k-75k , 873.3% for AGIs $75k-100k , 1420.2% for AGIs $100k-200k , 8739.7% for AGIs over 200k ) Charity contributions: $17,556 (reported on 15.5% of returns )Here:
$17,556State:
$18,201
(% of AGI for various income ranges: 5.6% for AGIs below $25k , 30.0% for AGIs $25k-50k , 65.0% for AGIs $50k-75k , 153.9% for AGIs $75k-100k , 247.6% for AGIs $100k-200k , 3942.7% for AGIs over 200k ) Taxes paid: $8,837 (reported on 19.1% of returns )(% of AGI for various income ranges: 30.1% for AGIs below $25k , 54.3% for AGIs $25k-50k , 146.8% for AGIs $50k-75k , 222.2% for AGIs $75k-100k , 383.9% for AGIs $100k-200k , 1573.0% for AGIs over 200k ) Earned income credit: $1,981 (reported on 6.4% of returns )(% of AGI for various income ranges: 52.5% for AGIs below $25k , 54.4% for AGIs $25k-50k ) Percentage of individuals using paid preparers for their 2020 taxes: 91.2%(% for various income ranges: 88.5% for AGIs below $25k , 91.4% for AGIs $25k-50k , 90.8% for AGIs $50k-75k , 90.4% for AGIs $75k-100k , 91.8% for AGIs $100k-200k , 93.9% for AGIs over 200k )
Averages for the 2012 tax year for zip code 78620, filed in 2013:
Average Adjusted Gross Income (AGI) in 2012: $102,457 (Individual Income Tax Returns) Here:
$102,457State:
$65,384
Salary/wage: $79,422 (reported on 80.4% of returns )Here:
$79,422State:
$52,524
(% of AGI for various income ranges: 67.0% for AGIs below $25k , 69.2% for AGIs $25k-50k , 65.4% for AGIs $50k-75k , 69.4% for AGIs $75k-100k , 74.4% for AGIs $100k-200k , 51.2% for AGIs over 200k ) Taxable interest for individuals: $1,812 (reported on 46.1% of returns )This zip code:
$1,812Texas:
$2,372
(% of AGI for various income ranges: 1.6% for AGIs below $25k , 0.9% for AGIs $25k-50k , 0.9% for AGIs $50k-75k , 1.0% for AGIs $75k-100k , 0.7% for AGIs $100k-200k , 0.7% for AGIs over 200k ) Ordinary dividends: $6,324 (reported on 29.4% of returns )(% of AGI for various income ranges: 2.8% for AGIs below $25k , 2.1% for AGIs $25k-50k , 1.6% for AGIs $50k-75k , 1.7% for AGIs $75k-100k , 1.5% for AGIs $100k-200k , 2.0% for AGIs over 200k ) Net capital gain/loss in AGI: +$31,424 (reported on 27.7% of returns )Here:
+$31,424State:
+$35,319
(% of AGI for various income ranges: 0.7% for AGIs $25k-50k , 1.1% for AGIs $50k-75k , 1.5% for AGIs $75k-100k , 1.6% for AGIs $100k-200k , 17.4% for AGIs over 200k ) Profit/loss from business: +$19,860 (reported on 26.9% of returns )Here:
+$19,860State:
+$13,732
(% of AGI for various income ranges: 14.3% for AGIs below $25k , 8.8% for AGIs $25k-50k , 8.0% for AGIs $50k-75k , 5.9% for AGIs $75k-100k , 5.6% for AGIs $100k-200k , 3.2% for AGIs over 200k ) Taxable individual retirement arrangement distribution: $22,152 (reported on 11.5% of returns )78620:
$22,152Texas:
$19,511
(% of AGI for various income ranges: 3.1% for AGIs below $25k , 3.6% for AGIs $25k-50k , 2.9% for AGIs $50k-75k , 3.6% for AGIs $75k-100k , 3.5% for AGIs $100k-200k , 1.4% for AGIs over 200k ) Self-employment retirement plans: $17,990 (reported on 1.4% of returns )78620:
$17,990Texas:
$23,938
(% of AGI for various income ranges: 0.5% for AGIs $25k-50k , 0.3% for AGIs $100k-200k , 0.3% for AGIs over 200k ) Total itemized deductions: $26,385 (16% of AGI, reported on 46.9% of returns )Here:
$26,385State:
$24,724
Here:
15.8% of AGIState:
15.9% of AGI
(% of AGI for various income ranges: 16.9% for AGIs below $25k , 14.7% for AGIs $25k-50k , 15.6% for AGIs $50k-75k , 14.8% for AGIs $75k-100k , 14.5% for AGIs $100k-200k , 8.6% for AGIs over 200k ) Charity contributions: $4,656 (reported on 38.0% of returns )(% of AGI for various income ranges: 1.0% for AGIs below $25k , 1.2% for AGIs $25k-50k , 1.6% for AGIs $50k-75k , 1.7% for AGIs $75k-100k , 2.0% for AGIs $100k-200k , 1.7% for AGIs over 200k ) Taxes paid: $8,544 (reported on 46.7% of returns )(% of AGI for various income ranges: 3.9% for AGIs below $25k , 4.1% for AGIs $25k-50k , 4.5% for AGIs $50k-75k , 4.7% for AGIs $75k-100k , 5.0% for AGIs $100k-200k , 2.9% for AGIs over 200k ) Earned income credit: $2,051 (reported on 9.7% of returns )(% of AGI for various income ranges: 4.5% for AGIs below $25k , 0.9% for AGIs $25k-50k ) Percentage of individuals using paid preparers for their 2012 taxes: 46.4%(% for various income ranges: 36.9% for AGIs below $25k , 42.6% for AGIs $25k-50k , 47.2% for AGIs $50k-75k , 50.6% for AGIs $75k-100k , 49.3% for AGIs $100k-200k , 68.7% for AGIs over 200k )
Averages for the 2004 tax year for zip code 78620, filed in 2005:
Average Adjusted Gross Income (AGI) in 2004: $68,992 (Individual Income Tax Returns) Here:
$68,992State:
$47,881
Salary/wage: $61,466 (reported on 82.5% of returns )Here:
$61,466State:
$41,947
(% of AGI for various income ranges: 69.5% for AGIs $10k-25k , 74.3% for AGIs $25k-50k , 74.9% for AGIs $50k-75k , 79.6% for AGIs $75k-100k , 69.4% for AGIs over 100k ) Taxable interest for individuals: $1,644 (reported on 55.3% of returns )This zip code:
$1,644Texas:
$2,255
(% of AGI for various income ranges: 2.3% for AGIs $10k-25k , 1.8% for AGIs $25k-50k , 1.5% for AGIs $50k-75k , 0.9% for AGIs $75k-100k , 1.0% for AGIs over 100k ) Taxable dividends: $2,612 (reported on 32.4% of returns )(% of AGI for various income ranges: 2.1% for AGIs $10k-25k , 1.5% for AGIs $25k-50k , 1.2% for AGIs $50k-75k , 0.9% for AGIs $75k-100k , 1.1% for AGIs over 100k ) Net capital gain/loss: +$12,773 (reported on 31.5% of returns )Here:
+$12,773State:
+$16,110
(% of AGI for various income ranges: 0.2% for AGIs $10k-25k , 0.9% for AGIs $25k-50k , 0.9% for AGIs $50k-75k , 1.5% for AGIs $75k-100k , 9.1% for AGIs over 100k ) Profit/loss from business: +$17,158 (reported on 27.1% of returns )Here:
+$17,158State:
+$11,013
(% of AGI for various income ranges: 12.9% for AGIs $10k-25k , 10.1% for AGIs $25k-50k , 6.3% for AGIs $50k-75k , 5.5% for AGIs $75k-100k , 6.0% for AGIs over 100k ) IRA payment deduction: $3,397 (reported on 3.6% of returns )(% of AGI for various income ranges: 0.4% for AGIs $10k-25k , 0.3% for AGIs $25k-50k , 0.3% for AGIs $50k-75k , 0.2% for AGIs $75k-100k , 0.1% for AGIs over 100k ) Self-employed pension: $13,659 (reported on 1.6% of returns )Here:
$13,659Texas:
$16,401
(% of AGI for various income ranges: 0.3% for AGIs $25k-50k , 0.1% for AGIs $50k-75k , 0.1% for AGIs $75k-100k , 0.4% for AGIs over 100k ) Total itemized deductions: $21,667 (20% of AGI, reported on 50.5% of returns )Here:
$21,667State:
$19,631
Here:
20.1% of AGIState:
18.9% of AGI
(% of AGI for various income ranges: 17.5% for AGIs $10k-25k , 19.3% for AGIs $25k-50k , 17.9% for AGIs $50k-75k , 19.2% for AGIs $75k-100k , 13.4% for AGIs over 100k ) Charity contributions deductions: $3,321 (3% of AGI, reported on 42.1% of returns )Here:
2.9% of AGIState:
4.2% of AGI
(% of AGI for various income ranges: 1.3% for AGIs $10k-25k , 1.7% for AGIs $25k-50k , 2.0% for AGIs $50k-75k , 2.1% for AGIs $75k-100k , 2.1% for AGIs over 100k ) Total tax: $12,131 (reported on 81.4% of returns )78620:
$12,131State:
$9,058
(% of AGI for various income ranges: 5.3% for AGIs $10k-25k , 7.5% for AGIs $25k-50k , 8.7% for AGIs $50k-75k , 10.3% for AGIs $75k-100k , 18.2% for AGIs over 100k ) Earned income credit: $1,556 (reported on 8.4% of returns )Percentage of individuals using paid preparers for their 2004 taxes: 50.2%(% for various income ranges: 45.9% for AGIs below $10k , 51.1% for AGIs $10k-25k , 51.5% for AGIs $25k-50k , 51.4% for AGIs $50k-75k , 47.3% for AGIs $75k-100k , 53.0% for AGIs over 100k )
Estimated median household income in 2022: This zip code:
$137,213Texas:
$72,284
Nearest zip codes: 78619 ,
78736 ,
78737 ,
78676 ,
78738 ,
78669 .
Dripping Springs Zip Code Map
Percentage of family households: This zip code:
58.5%Texas:
50.5%
Percentage of households with unmarried partners: This zip code:
2.4%Texas:
48.7%
No gay or lesbian households reported
Household received Food Stamps/SNAP in the past 12 months: 55Household did not receive Food Stamps/SNAP in the past 12 months: 7,303
Women who had a birth in the past 12 months: 224 (228 now married , 0 unmarried) Women who did not have a birth in the past 12 months: 3,636 (1,984 now married , 1,639 unmarried)
Housing units in zip code 78620 with a mortgage: 4,272 (279
second mortgage , 56
home equity loan , 187
both second mortgage and home equity loan )
Houses without a mortgage: 202
Median monthly owner costs for units with a mortgage: $2,690
Median monthly owner costs for units without a mortgage: $1,144
Residents with income below the poverty level in 2022:
This zip code:
5.0%Whole state:
14.0%
Residents with income below 50% of the poverty level in 2022:
This zip code:
3.2%Whole state:
7.4%
Median number of rooms in houses and condos: Median number of rooms in apartments: Notable locations in this zip code not listed on our city pages
Click to draw/clear zip code borders Notable locations in zip code 78620: (A) , Doctor Joseph M and Sarah Pound Farmstead (B) , Storm Ranch (C) , Henly Volunteer Fire Department (D) , North Hays County Volunteer Fire Department (E) , North Hays County Emergency Services District 6 (F) , North Hays County Volunteer Fire Department North Station (G) , San Marcus - Hays County Emergency Medical Service (H) . Display/hide their locations on the map
Churches in zip code 78620 include: (A) , Dripping Springs Community Church (B) , Holy Spirit Episcopal Church (C) , Sunset Canyon Baptist Church (D) . Display/hide their locations on the map
Cemeteries: (1) , Moore Cemetery (2) , Pursley Cemetery (3) , Sprouse Cemetery (4) , Dye Cemetery (5) , Peryear Cemetery (6) , Fitzhugh Cemetery (7) . Display/hide their locations on the map
Lakes and reservoirs: (A) , Dead Mans Hole (B) , Reeves Lake (C) , Purola Lake (D) , Seven H Ranch Lake (E) . Display/hide their locations on the map
Streams, rivers, and creeks: (A) , South Onion Creek (B) , Roy Creek (C) , Roy Branch (D) , Mustang Branch (E) , Millseat Branch (F) , Eskew Branch (G) , Fitzhugh Creek (H) , Cardium Creek (I) . Display/hide their locations on the map
Park in zip code 78620: (1) . Display/hide its location on the map
Year house built (houses)
257 2020 or later2,830 2010 to 20191,950 2000 to 20091,487 1990 to 1999683 1980 to 1989431 1970 to 1979147 1960 to 196913 1950 to 19598 1940 to 194986 1939 or earlier
Zip code 78620 household income distribution in 2022 143 Less than $10,000121 $10,000 to $14,99995 $15,000 to $19,999174 $20,000 to $24,99987 $25,000 to $29,999139 $30,000 to $34,999105 $35,000 to $39,999224 $40,000 to $44,999118 $45,000 to $49,999250 $50,000 to $59,999429 $60,000 to $74,999810 $75,000 to $99,999601 $100,000 to $124,999706 $125,000 to $149,9991,055 $150,000 to $199,9992,311 $200,000 or moreEstimate of home value of owner-occupied houses/condos in 2022 in zip code 78620 93 Less than $10,00032 $10,000 to $14,9993 $20,000 to $24,9996 $50,000 to $59,99939 $70,000 to $79,99962 $100,000 to $124,99941 $125,000 to $149,99966 $150,000 to $174,99914 $175,000 to $199,999227 $200,000 to $249,999282 $250,000 to $299,999794 $300,000 to $399,999925 $400,000 to $499,9992,943 $500,000 to $749,9991,437 $750,000 to $999,999725 $1,000,000 to $1,499,999151 $1,500,000 to $1,999,999126 $2,000,000 or moreRent paid by renters in 2022 in zip code 78620 4 $200 to $2497 $250 to $29928 $550 to $5999 $600 to $64910 $750 to $79959 $800 to $89948 $900 to $999252 $1,000 to $1,249168 $1,250 to $1,499146 $1,500 to $1,999308 $2,000 to $2,49926 No cash rent
Median gross rent in 2022: $1,532.
Median price asked for vacant for-sale houses and condos in 2022: $600,040.
Estimated median house (or condo) value in 2022 for: White Non-Hispanic householders: $701,230American Indian or Alaska Native householders: $488,901Some other race householders: $188,737Two or more races householders: $589,803Hispanic or Latino householders: $305,245Estimated median house or condo value in 2022: $677,276
78620:
$677,276Texas:
$275,400
Lower value quartile - upper value quartile: $464,647 - $897,618
Mean price in 2022: Detached houses: $354,135Here:
$354,135State:
$369,058
Townhouses or other attached units: $677,034Here:
$677,034State:
$327,631
In 3-to-4-unit structures: $105,333Here:
$105,333State:
$209,652
Mobile homes: $177,482Here:
$177,482State:
$124,413
Housing units in structures:
One, detached: 6,422One, attached: 272Two: 1123 or 4: 4910 to 19: 8020 to 49: 14650 or more: 72Mobile homes: 566Boats, RVs, vans, etc.: 12Unemployment : 2.4%
Means of transportation to work in zip code 78620 61.7% 6,418 Drove a car alone5.7% 596 Carpooled0.0% 3 Bus or trolley bus0.5% 57 Walked1.1% 112 Other means36.7% 3,821 Worked at homeTravel time to work (commute) in zip code 78620 167 Less than 5 minutes609 5 to 9 minutes934 10 to 14 minutes650 15 to 19 minutes731 20 to 24 minutes329 25 to 29 minutes1,008 30 to 34 minutes244 35 to 39 minutes429 40 to 44 minutes1,241 45 to 59 minutes728 60 to 89 minutes134 90 or more minutes
Percentage of zip code residents living and working in this county: 65.5%
Household type by relationship:
Households: 20,427
Male householders: 4,055 (515 living alone ), Female householders: 3,338 (654 living alone )4,996 spouses (4,850 opposite-sex spouses ), 313 unmarried partners , (238 opposite-sex unmarried partners ), 6,777 children (6,470 natural , 70 adopted , 236 stepchildren ), 339 grandchildren , 26 brothers or sisters , 164 parents , 0 foster children , 145 other relatives , 257 non-relatives In group quarters: 83 (-1 institutionalized population )
Size of family households: 2,351 2-persons , 1,371 3-persons , 1,398 4-persons , 593 5-persons , 187 6-persons , 60 7-or-more-persons
Size of nonfamily households: 1,168 1-person , 177 2-persons , 9 3-persons , 31 4-persons
4,298 married couples with children. single-parent households (216 men , 414 women ).
90.8% of residents of 78620 zip code speak English at home. of residents speak Spanish at home (76% very well, 20% well, 4% not well ).of residents speak other Indo-European language at home (44% very well, 56% well ).of residents speak Asian or Pacific Island language at home (99% very well, 1% not well ).of residents speak other language at home (100% very well ).
Foreign born population: 1,522 (7.5%)
(39.8%
of them are naturalized citizens )
This zip code:
7.5%Whole state:
17.2%
30% Honduras 12% Sweden 7% Bhutan 4% England 4% Liberia 4% France 3% Afghanistan 19% English 12% German 10% Irish 10% American 9% European 6% Scottish 2% Italian
Year of entry for the foreign-born population
707 2010 or later 472 2000 to 2009 347 1990 to 1999 298 Before 1990
Facilities with environmental interests located in this zip code:
AMERICAN TELEPHONE AND TELEGRAPH COMPANY (HWY 12 20.3 MI S LONE MAN MTN in DRIPPING SPRINGS, TX)
(Resource Conservation and Recovery Act (tracking hazardous waste)) Alternative names: AMERICAN TEL & TEL CO LONG LINES
Housing units lacking complete kitchen facilities: 0.5%
66.6% Electricity 18.8% Bottled, tank, or LP gas 13.3% Utility gas 0.5% Wood 0.5% Solar energy
Population in 1990: 3,453. Population change in the 1990s: +6,236 (+180.6%).
Place of birth for U.S.-born residents:
This state: 10,790Northeast: 1,080Midwest: 1,764South: 1,793West: 3,335
48% of the 78620 zip code residents lived in the same house 5 years ago.
Out of people who lived in different houses, 24% lived in this county.
Out of people who lived in different counties, 50% lived in Texas.
87% of the 78620 zip code residents lived in the same house 1 year ago.
Out of people who lived in different houses, 25% moved from this county.
Out of people who lived in different houses, 42% moved from different county within same state.
Out of people who lived in different houses, 35% moved from different state.
Out of people who lived in different houses, 2% moved from abroad.
Private vs. public school enrollment:
Students in private schools in grades 1 to 8 (elementary and middle school): 269
Students in private schools in grades 9 to 12 (high school): 75
Students in private undergraduate colleges: 52
Occupation by median earnings in the past 12 months ($)
149,942 Architecture and engineering occupations 128,697 Legal occupations 118,575 Computer and mathematical occupations 116,959 Law enforcement workers including supervisors 114,975 Management occupations 100,525 Health diagnosing and treating practitioners and other technical occupations
Companies with federal contracts located in this zip code:
DO2 PLANT MAINTENANCE, INC (26550 RANCH ROAD 12, SUITE in DRIPPING SPRIN, TX; small business)
$76,125 with Navy for Maintenance, Repair or Alteration of Real Property -- Sewage and Waste Facilities. Signed on 2001-11-20. Completion date: 2002-03-12.
ROPE WORKS INCORPORATED (551 BLUE CREEK DR in DRIPPING SPRIN, TX; small business) in 2 contracts from 2004 to 2005
$3,125 with Army for Fiber Rope, Cordage, and Twine. Signed on 2005-05-05. Completion date: 2005-05-16.
with Navy for Inspection Services (including commercial testing and lab services, except medical/dental) -- Rope, Cable, Chain, and Fittings. Signed on 2004-02-09. Completion date: 2004-02-12.
Top industries in this zip code by the number of employees in 2005:
Health Care and Social Assistance: Nursing Care Facilities (100-249 employees: 1 establishment)Other Services (except Public Administration): Religious Organizations (50-99: 1, 20-49: 1, 10-19: 2, 5-9: 2, 1-4: 4)Construction: Water and Sewer Line and Related Structures Construction (50-99: 1, 20-49: 1, 10-19: 1, 5-9: 1)Accommodation and Food Services: Limited-Service Restaurants (20-49: 1, 10-19: 2, 5-9: 1, 1-4: 3)Health Care and Social Assistance: Child Day Care Services (50-99: 1, 1-4: 1)Educational Services: Elementary and Secondary Schools (50-99: 1)Professional, Scientific, and Technical Services: Engineering Services (20-49: 1, 10-19: 1, 1-4: 4)Professional, Scientific, and Technical Services: Veterinary Services (20-49: 1, 10-19: 1)Construction: Electrical Contractors (20-49: 1, 1-4: 6)
People in group quarters in 2010:
56 people in nursing facilities/skilled-nursing facilities
6 people in group homes intended for adults
People in group quarters in 2000:
58 people in nursing homes
24 people in training schools for juvenile delinquents
14 people in homes for the mentally ill
12 people in homes for the physically handicapped
Fatal accident statistics in 2014:
Fatal accident count: 2Vehicles involved in fatal accidents: 3Fatal accidents caused by drunken drivers: 0Fatalities: 2Persons involved in fatal accidents: 3Pedestrians involved in fatal accidents: 0
Fatal accident statistics in 2013:
Fatal accident count: 1Vehicles involved in fatal accidents: 1Fatal accidents caused by drunken drivers: 0Fatalities: 1Persons involved in fatal accidents: 6Pedestrians involved in fatal accidents: 0
Home Mortgage Disclosure Act Aggregated Statistics For Year 2009(Based on 4 partial tracts) A) FHA, FSA/RHS & VA B) Conventional C) Refinancings D) Home Improvement Loans F) Non-occupant Loans on G) Loans On Manufactured Number Average Value Number Average Value Number Average Value Number Average Value Number Average Value Number Average Value
LOANS ORIGINATED 159 $230,738 539 $248,664 1,295 $244,620 59 $138,715 78 $242,503 15 $112,880 APPLICATIONS APPROVED, NOT ACCEPTED 9 $212,032 52 $317,225 131 $227,771 11 $107,005 8 $304,651 13 $75,299 APPLICATIONS DENIED 39 $218,517 80 $224,334 428 $292,362 43 $44,397 36 $526,891 20 $105,356 APPLICATIONS WITHDRAWN 21 $248,221 57 $247,502 326 $240,944 24 $133,880 12 $203,995 5 $84,480 FILES CLOSED FOR INCOMPLETENESS 1 $550,070 7 $308,294 48 $240,935 3 $22,797 1 $564,620 3 $114,960
Aggregated Statistics For Year 2008(Based on 4 partial tracts) A) FHA, FSA/RHS & VA B) Conventional C) Refinancings D) Home Improvement Loans E) Loans on Dwellings For 5+ Families F) Non-occupant Loans on G) Loans On Manufactured Number Average Value Number Average Value Number Average Value Number Average Value Number Average Value Number Average Value Number Average Value
LOANS ORIGINATED 60 $247,751 762 $263,719 567 $280,222 82 $97,698 1 $13,811,200 110 $405,904 22 $84,970 APPLICATIONS APPROVED, NOT ACCEPTED 7 $188,969 111 $251,288 78 $218,682 25 $73,301 0 $0 15 $180,505 5 $86,374 APPLICATIONS DENIED 14 $231,678 130 $224,906 275 $268,907 79 $94,693 0 $0 39 $303,558 25 $63,201 APPLICATIONS WITHDRAWN 11 $243,637 126 $222,550 117 $268,736 15 $83,133 0 $0 18 $288,420 4 $85,130 FILES CLOSED FOR INCOMPLETENESS 6 $203,970 10 $283,288 23 $276,364 7 $110,066 0 $0 1 $606,820 3 $59,177
Aggregated Statistics For Year 2007(Based on 4 partial tracts) A) FHA, FSA/RHS & VA B) Conventional C) Refinancings D) Home Improvement Loans F) Non-occupant Loans on G) Loans On Manufactured Number Average Value Number Average Value Number Average Value Number Average Value Number Average Value Number Average Value
LOANS ORIGINATED 17 $204,455 1,130 $233,955 507 $254,993 151 $111,168 143 $249,407 36 $84,273 APPLICATIONS APPROVED, NOT ACCEPTED 2 $231,320 201 $237,291 74 $230,788 29 $47,726 12 $339,696 17 $105,062 APPLICATIONS DENIED 6 $154,493 190 $266,378 280 $229,458 97 $87,312 45 $362,671 42 $75,144 APPLICATIONS WITHDRAWN 3 $166,543 156 $269,339 162 $222,870 38 $129,482 24 $321,067 7 $90,346 FILES CLOSED FOR INCOMPLETENESS 0 $0 29 $256,768 58 $341,728 11 $88,965 7 $268,380 0 $0
Aggregated Statistics For Year 2006(Based on 4 partial tracts) A) FHA, FSA/RHS & VA B) Conventional C) Refinancings D) Home Improvement Loans F) Non-occupant Loans on G) Loans On Manufactured Number Average Value Number Average Value Number Average Value Number Average Value Number Average Value Number Average Value
LOANS ORIGINATED 22 $176,795 1,528 $205,092 476 $242,381 130 $85,948 180 $225,612 22 $80,619 APPLICATIONS APPROVED, NOT ACCEPTED 1 $263,390 252 $196,200 88 $192,600 37 $65,890 35 $154,886 17 $48,535 APPLICATIONS DENIED 1 $192,090 200 $188,781 280 $210,294 103 $121,269 57 $185,147 55 $71,535 APPLICATIONS WITHDRAWN 3 $217,793 172 $245,374 202 $232,175 40 $175,424 17 $156,734 5 $80,558 FILES CLOSED FOR INCOMPLETENESS 1 $206,640 36 $184,882 66 $228,298 4 $102,592 1 $134,660 1 $157,160
Aggregated Statistics For Year 2005(Based on 4 partial tracts) A) FHA, FSA/RHS & VA B) Conventional C) Refinancings D) Home Improvement Loans F) Non-occupant Loans on G) Loans On Manufactured Number Average Value Number Average Value Number Average Value Number Average Value Number Average Value Number Average Value
LOANS ORIGINATED 18 $166,516 1,070 $201,171 581 $220,196 119 $111,564 122 $221,489 38 $94,246 APPLICATIONS APPROVED, NOT ACCEPTED 5 $161,062 123 $154,287 100 $214,488 37 $72,988 20 $237,065 14 $59,957 APPLICATIONS DENIED 7 $167,556 153 $171,634 394 $182,572 82 $66,020 41 $144,970 52 $72,000 APPLICATIONS WITHDRAWN 4 $184,810 114 $198,104 224 $185,064 37 $167,942 25 $221,115 10 $73,633 FILES CLOSED FOR INCOMPLETENESS 0 $0 39 $194,855 146 $210,037 7 $176,703 6 $136,547 0 $0
Aggregated Statistics For Year 2004(Based on 4 partial tracts) A) FHA, FSA/RHS & VA B) Conventional C) Refinancings D) Home Improvement Loans F) Non-occupant Loans on G) Loans On Manufactured Number Average Value Number Average Value Number Average Value Number Average Value Number Average Value Number Average Value
LOANS ORIGINATED 23 $157,245 835 $181,484 832 $187,864 87 $64,502 107 $217,042 42 $74,351 APPLICATIONS APPROVED, NOT ACCEPTED 1 $115,670 101 $178,678 139 $193,778 40 $91,325 10 $89,195 19 $51,227 APPLICATIONS DENIED 4 $68,385 161 $135,649 396 $187,274 89 $61,321 38 $175,483 60 $52,949 APPLICATIONS WITHDRAWN 3 $145,033 107 $194,583 294 $189,864 20 $68,965 31 $151,524 15 $85,372 FILES CLOSED FOR INCOMPLETENESS 1 $123,690 17 $167,947 121 $196,634 5 $91,602 6 $184,325 3 $85,857
Aggregated Statistics For Year 2003(Based on 4 partial tracts) A) FHA, FSA/RHS & VA B) Conventional C) Refinancings D) Home Improvement Loans F) Non-occupant Loans on Number Average Value Number Average Value Number Average Value Number Average Value Number Average Value
LOANS ORIGINATED 31 $131,480 644 $184,977 2,105 $182,053 96 $50,693 105 $170,307 APPLICATIONS APPROVED, NOT ACCEPTED 1 $79,410 60 $150,005 233 $165,427 37 $43,037 15 $210,811 APPLICATIONS DENIED 1 $106,170 99 $132,682 603 $165,375 82 $60,450 26 $139,553 APPLICATIONS WITHDRAWN 10 $136,439 88 $199,268 515 $177,503 4 $48,360 25 $177,257 FILES CLOSED FOR INCOMPLETENESS 0 $0 14 $219,630 60 $204,009 3 $109,997 3 $246,413
Aggregated Statistics For Year 2002(Based on 2 partial tracts) A) FHA, FSA/RHS & VA B) Conventional C) Refinancings D) Home Improvement Loans F) Non-occupant Loans on Number Average Value Number Average Value Number Average Value Number Average Value Number Average Value
LOANS ORIGINATED 35 $146,310 605 $173,392 1,208 $172,699 109 $45,578 71 $193,132 APPLICATIONS APPROVED, NOT ACCEPTED 1 $155,710 90 $143,159 183 $155,484 42 $37,108 13 $121,565 APPLICATIONS DENIED 7 $142,194 100 $94,093 268 $158,465 76 $29,793 7 $146,976 APPLICATIONS WITHDRAWN 4 $136,060 39 $141,677 215 $173,588 19 $56,983 7 $166,517 FILES CLOSED FOR INCOMPLETENESS 0 $0 19 $196,146 64 $186,789 1 $218,280 4 $81,128
Aggregated Statistics For Year 2001(Based on 2 partial tracts) A) FHA, FSA/RHS & VA B) Conventional C) Refinancings D) Home Improvement Loans F) Non-occupant Loans on Number Average Value Number Average Value Number Average Value Number Average Value Number Average Value
LOANS ORIGINATED 33 $141,463 569 $167,565 953 $168,759 127 $37,835 81 $159,353 APPLICATIONS APPROVED, NOT ACCEPTED 3 $66,940 97 $132,093 115 $150,518 32 $34,106 7 $219,320 APPLICATIONS DENIED 6 $121,995 138 $107,980 224 $145,942 64 $34,311 17 $165,551 APPLICATIONS WITHDRAWN 6 $131,938 51 $212,545 194 $158,984 16 $58,117 13 $141,266 FILES CLOSED FOR INCOMPLETENESS 0 $0 19 $193,848 48 $206,426 4 $27,285 4 $288,858
Aggregated Statistics For Year 2000(Based on 2 partial tracts) A) FHA, FSA/RHS & VA B) Conventional C) Refinancings D) Home Improvement Loans E) Loans on Dwellings For 5+ Families F) Non-occupant Loans on Number Average Value Number Average Value Number Average Value Number Average Value Number Average Value Number Average Value
LOANS ORIGINATED 19 $138,857 522 $158,781 294 $144,698 115 $35,621 3 $1,392,140 44 $160,535 APPLICATIONS APPROVED, NOT ACCEPTED 4 $112,778 92 $133,388 57 $122,543 33 $41,407 0 $0 12 $98,348 APPLICATIONS DENIED 3 $45,110 137 $94,152 127 $148,259 57 $46,030 0 $0 29 $148,782 APPLICATIONS WITHDRAWN 1 $202,270 47 $163,849 60 $142,852 7 $69,850 0 $0 1 $181,900 FILES CLOSED FOR INCOMPLETENESS 1 $48,020 10 $208,967 38 $151,571 1 $58,210 0 $0 3 $87,797
Aggregated Statistics For Year 1999(Based on 2 partial tracts) A) FHA, FSA/RHS & VA B) Conventional C) Refinancings D) Home Improvement Loans F) Non-occupant Loans on Number Average Value Number Average Value Number Average Value Number Average Value Number Average Value
LOANS ORIGINATED 36 $115,613 338 $142,669 282 $139,826 82 $35,825 18 $127,073 APPLICATIONS APPROVED, NOT ACCEPTED 0 $0 59 $98,070 65 $116,965 31 $22,399 6 $88,085 APPLICATIONS DENIED 4 $84,205 107 $96,070 93 $124,480 32 $25,766 17 $115,475 APPLICATIONS WITHDRAWN 4 $98,930 28 $163,759 51 $133,420 7 $38,140 4 $89,140 FILES CLOSED FOR INCOMPLETENESS 0 $0 8 $198,061 22 $135,273 2 $57,690 0 $0
Detailed HMDA statistics for the following Tracts:
0017.68
,
0108.01
Private Mortgage Insurance Companies Aggregated Statistics For Year 2009(Based on 4 partial tracts) A) Conventional B) Refinancings C) Non-occupant Loans on Number Average Value Number Average Value Number Average Value
LOANS ORIGINATED 95 $257,059 48 $289,848 1 $369,620 APPLICATIONS APPROVED, NOT ACCEPTED 19 $283,868 26 $288,493 0 $0 APPLICATIONS DENIED 4 $244,158 19 $293,556 1 $135,520 APPLICATIONS WITHDRAWN 7 $191,281 10 $322,036 1 $135,520 FILES CLOSED FOR INCOMPLETENESS 1 $387,080 0 $0 0 $0
Aggregated Statistics For Year 2008(Based on 4 partial tracts) A) Conventional B) Refinancings C) Non-occupant Loans on Number Average Value Number Average Value Number Average Value
LOANS ORIGINATED 173 $298,112 32 $349,537 17 $305,474 APPLICATIONS APPROVED, NOT ACCEPTED 39 $281,644 9 $360,081 1 $59,660 APPLICATIONS DENIED 9 $273,197 4 $596,268 1 $599,540 APPLICATIONS WITHDRAWN 7 $220,033 0 $0 1 $114,960 FILES CLOSED FOR INCOMPLETENESS 3 $157,160 0 $0 1 $136,790
Aggregated Statistics For Year 2007(Based on 4 partial tracts) A) Conventional B) Refinancings C) Non-occupant Loans on D) Loans On Manufactured Number Average Value Number Average Value Number Average Value Number Average Value
LOANS ORIGINATED 120 $298,222 28 $290,525 16 $233,554 1 $254,660 APPLICATIONS APPROVED, NOT ACCEPTED 19 $300,920 6 $244,232 1 $302,680 1 $176,080 APPLICATIONS DENIED 2 $253,565 0 $0 0 $0 0 $0 APPLICATIONS WITHDRAWN 1 $125,160 1 $924,050 0 $0 0 $0 FILES CLOSED FOR INCOMPLETENESS 1 $327,420 0 $0 0 $0 0 $0
Aggregated Statistics For Year 2006(Based on 4 partial tracts) A) Conventional B) Refinancings C) Non-occupant Loans on D) Loans On Manufactured Number Average Value Number Average Value Number Average Value Number Average Value
LOANS ORIGINATED 68 $250,797 18 $255,169 9 $177,211 3 $88,767 APPLICATIONS APPROVED, NOT ACCEPTED 11 $263,503 12 $294,193 0 $0 0 $0 APPLICATIONS DENIED 1 $509,320 0 $0 0 $0 0 $0 APPLICATIONS WITHDRAWN 7 $342,596 1 $247,380 0 $0 0 $0 FILES CLOSED FOR INCOMPLETENESS 0 $0 0 $0 0 $0 0 $0
Aggregated Statistics For Year 2005(Based on 4 partial tracts) A) Conventional B) Refinancings C) Non-occupant Loans on D) Loans On Manufactured Number Average Value Number Average Value Number Average Value Number Average Value
LOANS ORIGINATED 63 $225,536 18 $228,989 6 $184,083 2 $122,330 APPLICATIONS APPROVED, NOT ACCEPTED 18 $287,054 10 $292,365 4 $261,572 0 $0 APPLICATIONS DENIED 4 $96,800 2 $414,110 3 $314,920 0 $0 APPLICATIONS WITHDRAWN 9 $157,970 1 $308,500 1 $177,530 0 $0 FILES CLOSED FOR INCOMPLETENESS 0 $0 2 $249,460 0 $0 0 $0
Aggregated Statistics For Year 2004(Based on 4 partial tracts) A) Conventional B) Refinancings C) Non-occupant Loans on D) Loans On Manufactured Number Average Value Number Average Value Number Average Value Number Average Value
LOANS ORIGINATED 76 $199,266 24 $232,290 15 $120,281 4 $185,902 APPLICATIONS APPROVED, NOT ACCEPTED 32 $217,647 17 $215,037 9 $159,961 1 $152,800 APPLICATIONS DENIED 3 $219,737 0 $0 3 $219,737 0 $0 APPLICATIONS WITHDRAWN 3 $308,163 0 $0 1 $446,270 0 $0 FILES CLOSED FOR INCOMPLETENESS 1 $355,070 0 $0 0 $0 0 $0
Aggregated Statistics For Year 2003(Based on 4 partial tracts) A) Conventional B) Refinancings C) Non-occupant Loans on Number Average Value Number Average Value Number Average Value
LOANS ORIGINATED 92 $202,795 66 $188,188 8 $158,788 APPLICATIONS APPROVED, NOT ACCEPTED 24 $202,280 29 $203,506 7 $146,767 APPLICATIONS DENIED 5 $217,664 0 $0 0 $0 APPLICATIONS WITHDRAWN 8 $219,358 5 $256,582 4 $220,462 FILES CLOSED FOR INCOMPLETENESS 0 $0 1 $609,730 0 $0
Aggregated Statistics For Year 2002(Based on 2 partial tracts) A) Conventional B) Refinancings C) Non-occupant Loans on Number Average Value Number Average Value Number Average Value
LOANS ORIGINATED 74 $193,247 42 $196,244 12 $132,059 APPLICATIONS APPROVED, NOT ACCEPTED 16 $216,552 26 $177,031 1 $117,870 APPLICATIONS DENIED 1 $240,110 3 $250,780 1 $589,360 APPLICATIONS WITHDRAWN 9 $252,234 10 $203,437 3 $231,377 FILES CLOSED FOR INCOMPLETENESS 0 $0 0 $0 0 $0
Aggregated Statistics For Year 2001(Based on 2 partial tracts) A) Conventional B) Refinancings C) Non-occupant Loans on Number Average Value Number Average Value Number Average Value
LOANS ORIGINATED 92 $191,612 44 $177,964 7 $138,660 APPLICATIONS APPROVED, NOT ACCEPTED 22 $203,860 15 $188,594 3 $100,893 APPLICATIONS DENIED 4 $263,755 1 $654,840 0 $0 APPLICATIONS WITHDRAWN 10 $219,153 0 $0 1 $157,160 FILES CLOSED FOR INCOMPLETENESS 3 $195,967 1 $218,280 0 $0
Aggregated Statistics For Year 2000(Based on 2 partial tracts) A) Conventional B) Refinancings C) Non-occupant Loans on Number Average Value Number Average Value Number Average Value
LOANS ORIGINATED 100 $177,083 35 $236,615 12 $138,729 APPLICATIONS APPROVED, NOT ACCEPTED 10 $174,770 20 $204,601 1 $138,240 APPLICATIONS DENIED 9 $230,407 3 $115,447 0 $0 APPLICATIONS WITHDRAWN 4 $148,068 1 $465,660 0 $0 FILES CLOSED FOR INCOMPLETENESS 3 $216,340 1 $216,820 0 $0
Aggregated Statistics For Year 1999(Based on 2 partial tracts) A) Conventional B) Refinancings C) Non-occupant Loans on Number Average Value Number Average Value Number Average Value
LOANS ORIGINATED 55 $153,869 23 $145,834 3 $170,680 APPLICATIONS APPROVED, NOT ACCEPTED 13 $163,599 7 $165,471 1 $129,900 APPLICATIONS DENIED 3 $137,303 1 $84,180 0 $0 APPLICATIONS WITHDRAWN 3 $137,080 2 $255,085 0 $0 FILES CLOSED FOR INCOMPLETENESS 1 $98,700 1 $121,190 0 $0
Detailed PMIC statistics for the following Tracts:
0017.68
,
0108.01
2002 - 2018 National Fire Incident Reporting System (NFIRS) incidents See full 2006 National Fire Incident Reporting System statistics for zip code 78620, Texas
Most common first names in zip code 78620 among deceased individuals Name Count Lived (average)
Mary 27 82.1 years James 25 72.4 years John 25 74.6 years William 20 75.1 years Robert 14 74.4 years Thomas 12 81.2 years Willie 11 82.0 years Charles 10 70.8 years Edward 8 75.0 years Edna 8 84.1 years
Most common last names in zip code 78620 among deceased individuals Last name Count Lived (average)
Jones 9 82.3 years Breed 9 80.5 years Johnson 7 71.9 years Mccarty 7 77.7 years Garza 7 70.1 years Smith 6 88.0 years Rogers 6 88.5 years Watson 6 85.5 years Baker 5 87.4 years Spillar 5 82.8 years
Businesses in zip code 78620
Name Count Name Count
AT&T 1 SONIC Drive-In 1 Circle K 1 Sears 1 Curves 1 Subway 1 FedEx 3 Taco Bell 1 Home Depot 1 U-Haul 1 Lane Furniture 1 UPS 2 McDonald's 1 YMCA 1


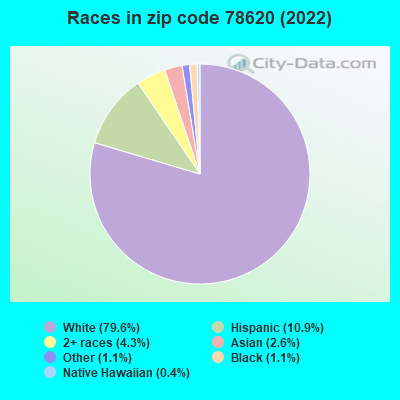


 Nearest zip codes: 78619, 78736, 78737, 78676, 78738, 78669.
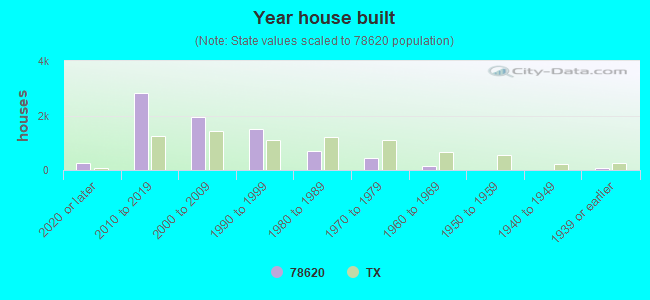


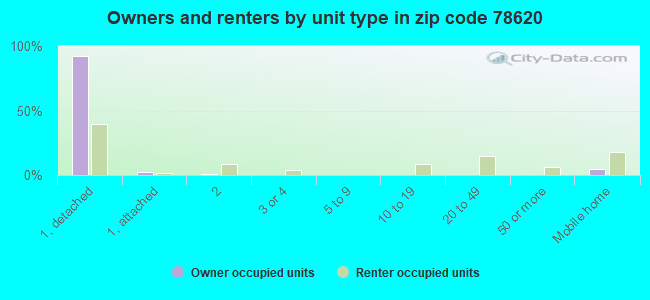
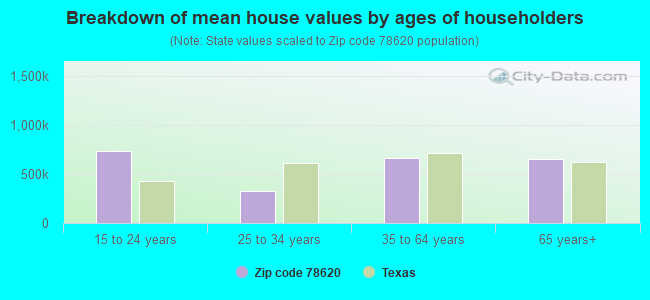


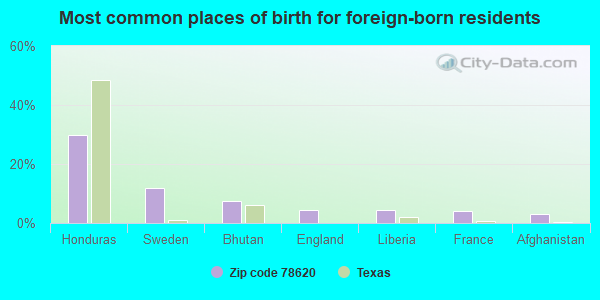
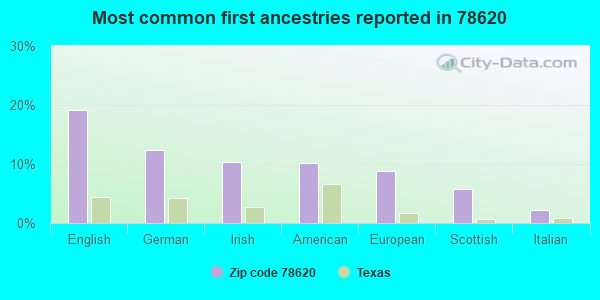
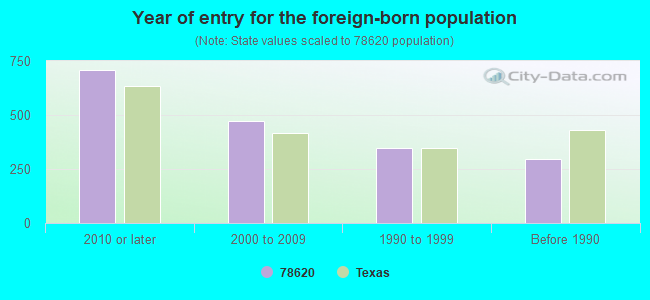


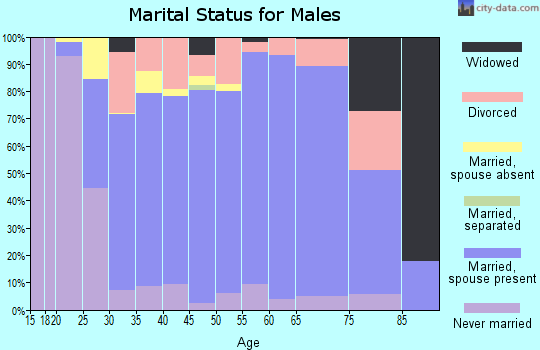
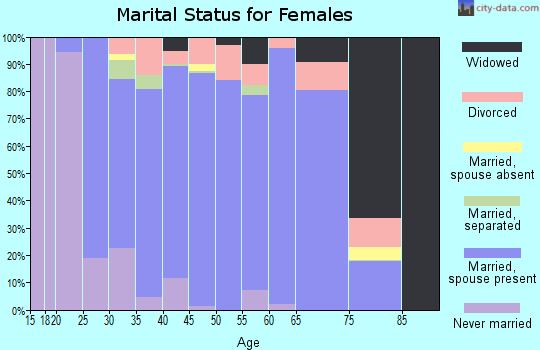
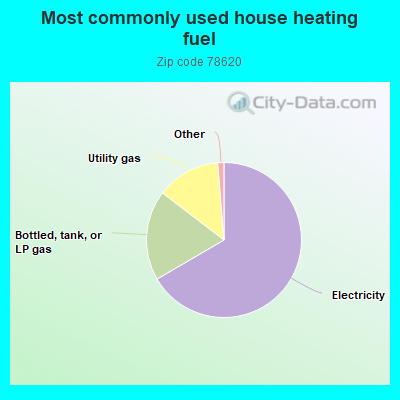
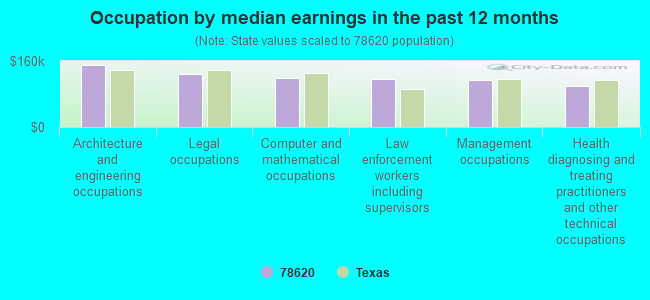
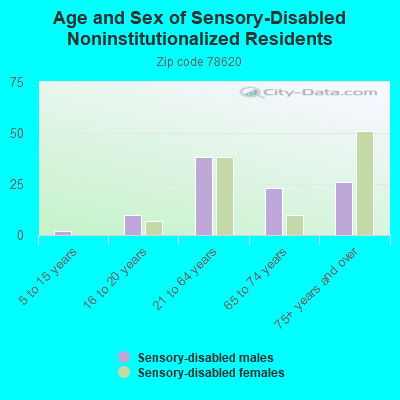
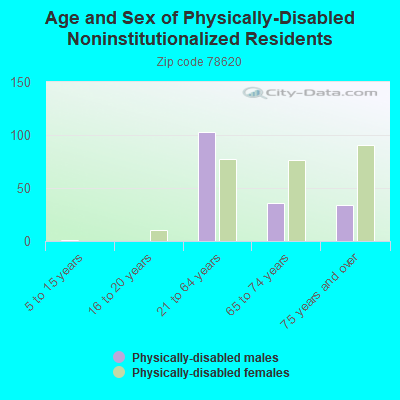
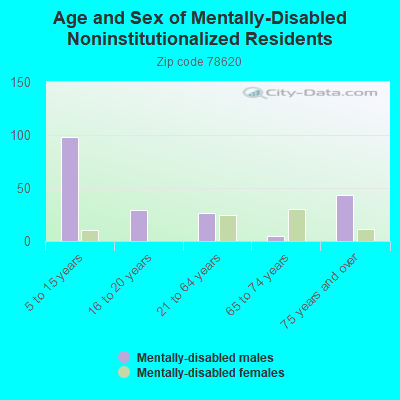
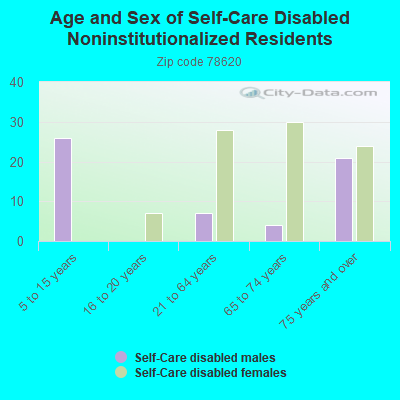
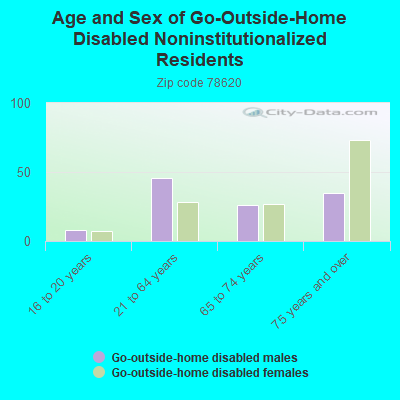
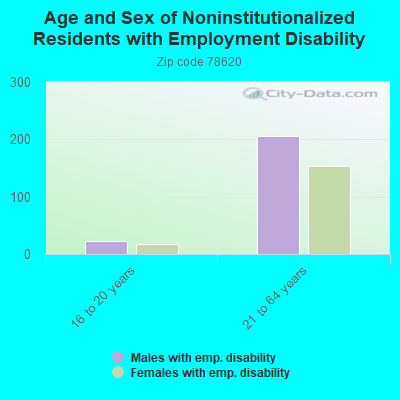
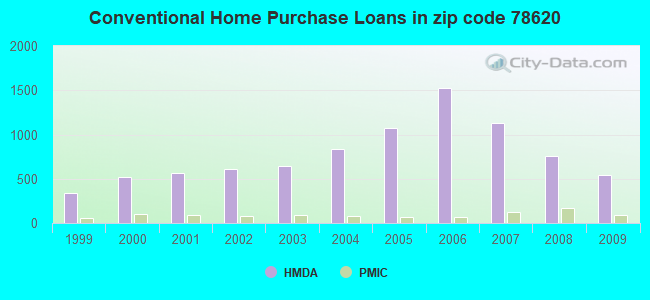
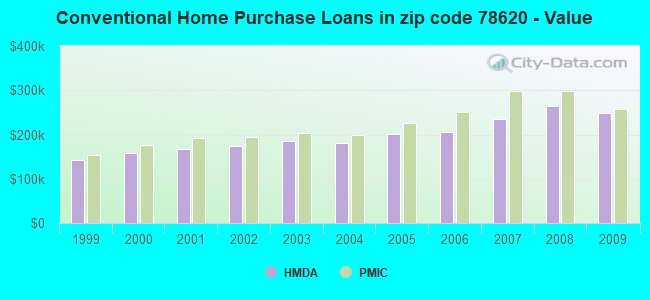
 Based on the data from the years 2002 - 2018 the average number of fires per year is 92. The highest number of fire incidents - 141 took place in 2011, and the least - 68 in 2002. The data has a growing trend.
 When looking into fire subcategories, the most incidents belonged to: Outside Fires (68.3%), and Structure Fires (19.3%).