Estimated zip code population in 2022: 11,092 Zip code population in 2010: 8,731 Zip code population in 2000: 5,527
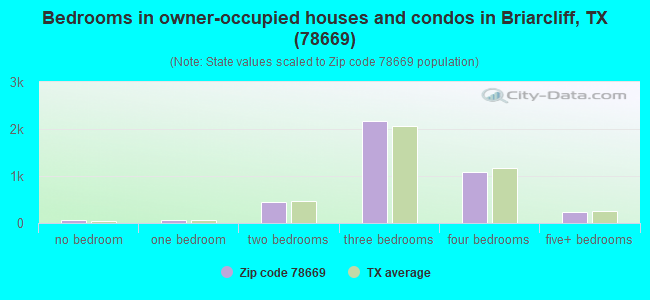
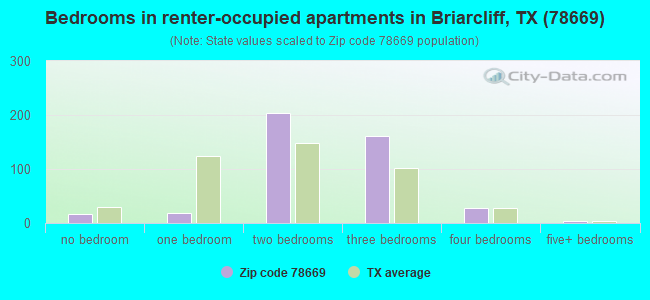
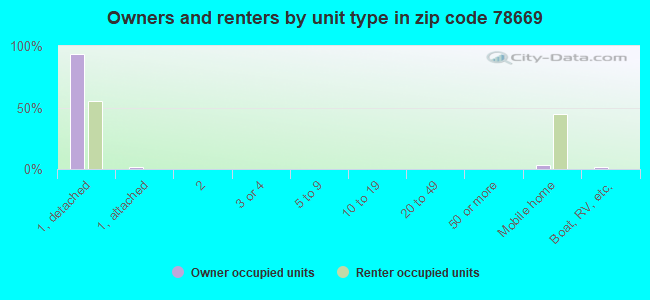
Houses and condos: 5,813 Renter-occupied apartments: 437
% of renters here:
10%
State:
38%
March 2022 cost of living index in zip code 78669: 82.7 (low, U.S. average is 100)
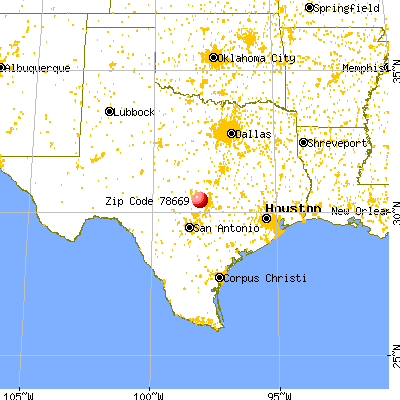
Land area: 139.8 sq. mi. Water area: 9.1 sq. mi.
Population density: 79 people per square mile
(very low).
OSM Map
General Map
Google Map
MSN Map
OSM Map
General Map
Google Map
MSN Map
OSM Map
General Map
Google Map
MSN Map
OSM Map
General Map
Google Map
MSN Map
Please wait while loading the map...
Real estate property taxes paid for housing units in 2022:
This zip code:
1.3% ($8,214)
Texas:
1.5% ($4,050)
Median real estate property taxes paid for housing units with mortgages in 2022: $9,152 (1.3%) Median real estate property taxes paid for housing units with no mortgage in 2022: $6,603 (1.3%)
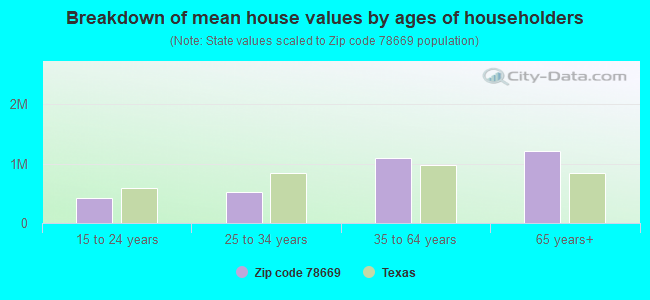
Estimated median house/condo value in 2022: $634,461
78669:
$634,461
Texas:
$275,400
According to our research of Texas and other state lists, there were 13 registered sex offenders living in 78669 zip code as of April 28, 2024. The ratio of all residents to sex offenders in zip code 78669 is 837 to 1. The ratio of registered sex offenders to all residents in this zip code is lower than the state average.
Median resident age:
This zip code:
48.3 years
Texas median age:
35.6 years
Average household size:
This zip code:
2.5 people
Texas:
2.6 people
Averages for the 2020 tax year for zip code 78669, filed in 2021:
Average Adjusted Gross Income (AGI) in 2020: $176,414 (Individual Income Tax Returns)
Here:
$176,414
State:
$77,054
Salary/wage: $114,767 (reported on 73.9% of returns)
Here:
$114,767
State:
$62,766
(% of AGI for various income ranges: 1125.3% for AGIs below $25k, 3592.5% for AGIs $25k-50k, 6844.7% for AGIs $50k-75k, 8881.0% for AGIs $75k-100k, 18236.1% for AGIs $100k-200k, 88299.7% for AGIs over 200k)
Taxable interest for individuals: $4,262 (reported on 46.2% of returns)
This zip code:
$4,262
Texas:
$2,665
(% of AGI for various income ranges: 34.2% for AGIs below $25k, 61.0% for AGIs $25k-50k, 132.2% for AGIs $50k-75k, 233.1% for AGIs $75k-100k, 318.8% for AGIs $100k-200k, 2266.8% for AGIs over 200k)
Ordinary dividends: $18,945 (reported on 34.6% of returns)
Here:
$18,945
State:
$10,044
(% of AGI for various income ranges: 68.6% for AGIs below $25k, 147.1% for AGIs $25k-50k, 278.9% for AGIs $50k-75k, 611.4% for AGIs $75k-100k, 803.9% for AGIs $100k-200k, 8554.7% for AGIs over 200k)
Net capital gain/loss in AGI: +$98,101 (reported on 34.6% of returns)
Here:
+$98,101
State:
+$39,590
(% of AGI for various income ranges: 56.5% for AGIs below $25k, 156.8% for AGIs $25k-50k, 343.9% for AGIs $50k-75k, 559.7% for AGIs $75k-100k, 1166.4% for AGIs $100k-200k, 55121.8% for AGIs over 200k)
Profit/loss from business: +$22,428 (reported on 28.1% of returns)
Here:
+$22,428
State:
+$10,888
(% of AGI for various income ranges: 237.6% for AGIs below $25k, 468.0% for AGIs $25k-50k, 731.4% for AGIs $50k-75k, 717.6% for AGIs $75k-100k, 1243.4% for AGIs $100k-200k, 5750.9% for AGIs over 200k)
Taxable individual retirement arrangement distribution: $43,730 (reported on 13.5% of returns)
78669:
$43,730
Texas:
$24,740
(% of AGI for various income ranges: 76.4% for AGIs below $25k, 188.5% for AGIs $25k-50k, 431.9% for AGIs $50k-75k, 727.6% for AGIs $75k-100k, 1378.3% for AGIs $100k-200k, 5970.6% for AGIs over 200k)
Self-employed (Keogh) retirement plans: $33,650 (reported on 1.4% of returns)
78669:
$33,650
Texas:
$29,298
(% of AGI for various income ranges: 791.8% for AGIs over 200k)
Total itemized deductions: $45,715 (reported on 21.6% of returns)
Here:
$45,715
State:
$40,428
(% of AGI for various income ranges: 155.4% for AGIs below $25k, 339.3% for AGIs $25k-50k, 812.5% for AGIs $50k-75k, 1103.1% for AGIs $75k-100k, 1643.8% for AGIs $100k-200k, 11203.2% for AGIs over 200k)
Charity contributions: $18,539 (reported on 17.5% of returns)
Here:
$18,539
State:
$18,201
(% of AGI for various income ranges: 6.6% for AGIs below $25k, 28.0% for AGIs $25k-50k, 125.3% for AGIs $50k-75k, 143.1% for AGIs $75k-100k, 329.2% for AGIs $100k-200k, 4676.8% for AGIs over 200k)
Taxes paid: $8,802 (reported on 21.3% of returns)
78669:
$8,802
State:
$7,821
(% of AGI for various income ranges: 28.1% for AGIs below $25k, 73.7% for AGIs $25k-50k, 183.1% for AGIs $50k-75k, 227.6% for AGIs $75k-100k, 458.9% for AGIs $100k-200k, 1785.9% for AGIs over 200k)
Earned income credit: $1,950 (reported on 7.2% of returns)
Here:
$1,950
State:
$2,584
(% of AGI for various income ranges: 56.5% for AGIs below $25k, 57.5% for AGIs $25k-50k)
Percentage of individuals using paid preparers for their 2020 taxes: 89.4%
Here:
89%
State:
92%
(% for various income ranges: 87.3% for AGIs below $25k, 88.9% for AGIs $25k-50k, 86.2% for AGIs $50k-75k, 88.2% for AGIs $75k-100k, 90.6% for AGIs $100k-200k, 93.3% for AGIs over 200k)
Averages for the 2012 tax year for zip code 78669, filed in 2013:
Average Adjusted Gross Income (AGI) in 2012: $141,664 (Individual Income Tax Returns)
Here:
$141,664
State:
$65,384
Salary/wage: $81,421 (reported on 75.5% of returns)
Here:
$81,421
State:
$52,524
(% of AGI for various income ranges: 60.4% for AGIs below $25k, 68.0% for AGIs $25k-50k, 64.5% for AGIs $50k-75k, 66.0% for AGIs $75k-100k, 68.0% for AGIs $100k-200k, 29.6% for AGIs over 200k)
Taxable interest for individuals: $4,540 (reported on 45.3% of returns)
This zip code:
$4,540
Texas:
$2,372
(% of AGI for various income ranges: 1.8% for AGIs below $25k, 1.5% for AGIs $25k-50k, 1.1% for AGIs $50k-75k, 0.9% for AGIs $75k-100k, 1.2% for AGIs $100k-200k, 1.6% for AGIs over 200k)
Ordinary dividends: $23,160 (reported on 31.6% of returns)
Here:
$23,160
State:
$9,721
(% of AGI for various income ranges: 4.6% for AGIs below $25k, 2.1% for AGIs $25k-50k, 2.1% for AGIs $50k-75k, 2.0% for AGIs $75k-100k, 2.5% for AGIs $100k-200k, 6.8% for AGIs over 200k)
Net capital gain/loss in AGI: +$51,143 (reported on 30.2% of returns)
Here:
+$51,143
State:
+$35,319
(% of AGI for various income ranges: 0.4% for AGIs below $25k, 0.9% for AGIs $25k-50k, 2.5% for AGIs $50k-75k, 1.0% for AGIs $75k-100k, 3.0% for AGIs $100k-200k, 16.1% for AGIs over 200k)
Profit/loss from business: +$22,082 (reported on 28.1% of returns)
Here:
+$22,082
State:
+$13,732
(% of AGI for various income ranges: 17.5% for AGIs below $25k, 7.1% for AGIs $25k-50k, 7.3% for AGIs $50k-75k, 6.4% for AGIs $75k-100k, 5.4% for AGIs $100k-200k, 2.9% for AGIs over 200k)
Taxable individual retirement arrangement distribution: $29,169 (reported on 13.7% of returns)
78669:
$29,169
Texas:
$19,511
(% of AGI for various income ranges: 3.3% for AGIs below $25k, 3.7% for AGIs $25k-50k, 4.5% for AGIs $50k-75k, 3.8% for AGIs $75k-100k, 4.2% for AGIs $100k-200k, 2.1% for AGIs over 200k)
Self-employment retirement plans: $27,167 (reported on 1.4% of returns)
78669:
$27,167
Texas:
$23,938
Total itemized deductions: $33,149 (13% of AGI, reported on 46.2% of returns)
Here:
$33,149
State:
$24,724
Here:
13.1% of AGI
State:
15.9% of AGI
(% of AGI for various income ranges: 18.7% for AGIs below $25k, 15.8% for AGIs $25k-50k, 16.1% for AGIs $50k-75k, 14.8% for AGIs $75k-100k, 15.3% for AGIs $100k-200k, 8.0% for AGIs over 200k)
Charity contributions: $9,388 (reported on 36.8% of returns)
Here:
$9,388
State:
$6,808
(% of AGI for various income ranges: 1.0% for AGIs below $25k, 1.4% for AGIs $25k-50k, 1.3% for AGIs $50k-75k, 1.7% for AGIs $75k-100k, 1.7% for AGIs $100k-200k, 2.9% for AGIs over 200k)
Taxes paid: $9,999 (reported on 45.8% of returns)
78669:
$9,999
State:
$6,921
(% of AGI for various income ranges: 4.9% for AGIs below $25k, 4.1% for AGIs $25k-50k, 4.5% for AGIs $50k-75k, 4.8% for AGIs $75k-100k, 5.1% for AGIs $100k-200k, 2.3% for AGIs over 200k)
Earned income credit: $1,752 (reported on 9.4% of returns)
Here:
$1,752
State:
$2,570
(% of AGI for various income ranges: 3.6% for AGIs below $25k, 0.7% for AGIs $25k-50k)
Percentage of individuals using paid preparers for their 2012 taxes: 48.3%
Here:
48%
State:
51%
(% for various income ranges: 41.0% for AGIs below $25k, 41.3% for AGIs $25k-50k, 47.3% for AGIs $50k-75k, 44.4% for AGIs $75k-100k, 51.2% for AGIs $100k-200k, 78.7% for AGIs over 200k)
Averages for the 2004 tax year for zip code 78669, filed in 2005:
Average Adjusted Gross Income (AGI) in 2004: $86,917 (Individual Income Tax Returns)
Here:
$86,917
State:
$47,881
Salary/wage: $63,951 (reported on 77.2% of returns)
Here:
$63,951
State:
$41,947
(% of AGI for various income ranges: 67.5% for AGIs $10k-25k, 74.6% for AGIs $25k-50k, 70.1% for AGIs $50k-75k, 75.5% for AGIs $75k-100k, 47.0% for AGIs over 100k)
Taxable interest for individuals: $3,258 (reported on 55.0% of returns)
This zip code:
$3,258
Texas:
$2,255
(% of AGI for various income ranges: 3.4% for AGIs $10k-25k, 1.6% for AGIs $25k-50k, 1.5% for AGIs $50k-75k, 1.0% for AGIs $75k-100k, 2.0% for AGIs over 100k)
Taxable dividends: $6,908 (reported on 31.6% of returns)
Here:
$6,908
State:
$4,261
(% of AGI for various income ranges: 1.7% for AGIs $10k-25k, 1.1% for AGIs $25k-50k, 1.3% for AGIs $50k-75k, 1.6% for AGIs $75k-100k, 2.9% for AGIs over 100k)
Net capital gain/loss: +$40,497 (reported on 32.8% of returns)
Here:
+$40,497
State:
+$16,110
(% of AGI for various income ranges: -0.3% for AGIs $10k-25k, 1.3% for AGIs $25k-50k, 3.4% for AGIs $50k-75k, 3.0% for AGIs $75k-100k, 20.9% for AGIs over 100k)
Profit/loss from business: +$18,377 (reported on 28.7% of returns)
Here:
+$18,377
State:
+$11,013
(% of AGI for various income ranges: 13.8% for AGIs $10k-25k, 10.2% for AGIs $25k-50k, 6.5% for AGIs $50k-75k, 6.8% for AGIs $75k-100k, 5.1% for AGIs over 100k)
IRA payment deduction: $3,509 (reported on 3.3% of returns)
78669:
$3,509
Texas:
$3,120
(% of AGI for various income ranges: 0.3% for AGIs $25k-50k, 0.3% for AGIs $50k-75k, 0.2% for AGIs $75k-100k, 0.1% for AGIs over 100k)
Self-employed pension: $15,972 (reported on 2.1% of returns)
Here:
$15,972
Texas:
$16,401
Total itemized deductions: $25,591 (18% of AGI, reported on 45.9% of returns)
Here:
$25,591
State:
$19,631
Here:
17.8% of AGI
State:
18.9% of AGI
(% of AGI for various income ranges: 21.8% for AGIs $10k-25k, 17.9% for AGIs $25k-50k, 16.8% for AGIs $50k-75k, 18.2% for AGIs $75k-100k, 10.8% for AGIs over 100k)
Charity contributions deductions: $5,913 (4% of AGI, reported on 37.1% of returns)
Here:
$5,913
State:
$4,753
Here:
3.7% of AGI
State:
4.2% of AGI
(% of AGI for various income ranges: 1.5% for AGIs $10k-25k, 1.4% for AGIs $25k-50k, 1.7% for AGIs $50k-75k, 2.3% for AGIs $75k-100k, 2.8% for AGIs over 100k)
Total tax: $18,577 (reported on 81.4% of returns)
78669:
$18,577
State:
$9,058
(% of AGI for various income ranges: 5.5% for AGIs $10k-25k, 7.8% for AGIs $25k-50k, 9.7% for AGIs $50k-75k, 11.1% for AGIs $75k-100k, 20.7% for AGIs over 100k)
Earned income credit: $1,552 (reported on 10.2% of returns)
Here:
$1,552
State:
$2,024
Percentage of individuals using paid preparers for their 2004 taxes: 54.0%
Here:
54%
State:
57%
(% for various income ranges: 47.3% for AGIs below $10k, 52.5% for AGIs $10k-25k, 53.0% for AGIs $25k-50k, 50.7% for AGIs $50k-75k, 51.2% for AGIs $75k-100k, 65.7% for AGIs over 100k)
Likely homosexual households (counted as self-reported same-sex unmarried-partner households)
Lesbian couples: 0.2% of all households
Gay men: 0.0% of all households
Household received Food Stamps/SNAP in the past 12 months: 121 Household did not receive Food Stamps/SNAP in the past 12 months: 4,356
Women who had a birth in the past 12 months: 219 (223 now married, 0 unmarried) Women who did not have a birth in the past 12 months: 1,687 (1,021 now married, 657 unmarried)
Housing units in zip code 78669 with a mortgage: 2,598 (160 second mortgage, 113 both second mortgage and home equity loan) Houses without a mortgage: 17
Median monthly owner costs for units with a mortgage: $2,839 Median monthly owner costs for units without a mortgage: $947
Residents with income below the poverty level in 2022:
This zip code:
7.2%
Whole state:
14.0%
Residents with income below 50% of the poverty level in 2022:
This zip code:
3.9%
Whole state:
7.4%
Median number of rooms in houses and condos:
Here:
6.4
State:
6.3
Median number of rooms in apartments:
Here:
4.2
State:
4.0
Notable locations in this zip code not listed on our city pages
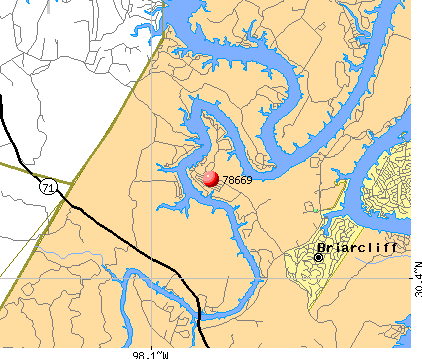
Notable locations in zip code 78669: Camp Texlake (A), Spicewood Volunteer Fire Department and Emergency Medical Services (B), Travis County Emergency Services District 8 Station 3 Pedernales (C), Travis County Emergency Services District 8 Station 2 Pedernales (D), Pedernales Emergency Services (E), Austin / Travis County Emergency Medical Service - Rescue 26 (F). Display/hide their locations on the map
Cemeteries: Fowler Cemetery (1), Lewis Cemetery (2), Holloway Cemetery (3), Rockvale Cemetery (4), Haynie Flat Cemetery (5), Fall Creek Cemetery (6), Burnam Cemetery (7). Display/hide their locations on the map
Streams, rivers, and creeks: Alligator Creek (A), Wallace Branch (B), Pedernales River (C), Lick Creek (D), Sycamore Creek (E), Fall Creek (F), Cat Creek (G), Bee Creek (H), Red Bluff Creek (I). Display/hide their locations on the map
In group quarters: 21 (-1 institutionalized population)
Size of family households: 1,846 2-persons, 664 3-persons, 446 4-persons, 263 5-persons, 113 6-persons, 35 7-or-more-persons
Size of nonfamily households: 816 1-person, 320 2-persons, 3 3-persons
1,587 married couples with children.
418 single-parent households (71 men, 347 women).
92.0% of residents of 78669 zip code speak English at home.
6.3% of residents speak Spanish at home (75% very well, 19% well, 1% not well, 6% not at all).
1.2% of residents speak other Indo-European language at home (100% very well).
0.8% of residents speak Asian or Pacific Island language at home (78% very well, 22% well).
0.2% of residents speak other language at home (100% very well).
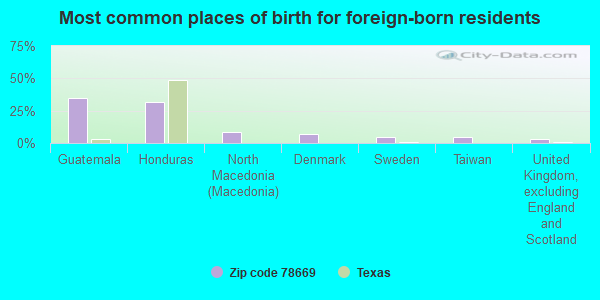
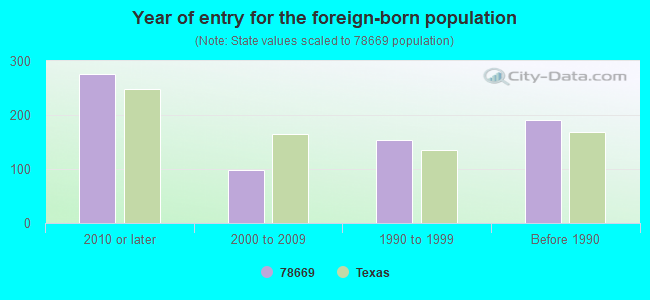
Foreign born population: 651 (5.9%) (51.9% of them are naturalized citizens)
This zip code:
5.9%
Whole state:
17.2%
35%Guatemala
32%Honduras
9%North Macedonia (Macedonia)
7%Denmark
5%Sweden
5%Taiwan
3%United Kingdom, excluding England and Scotland
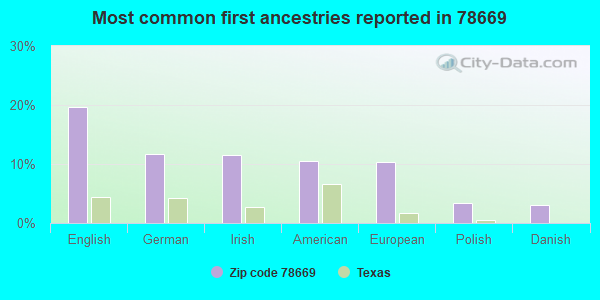
20%English
12%German
12%Irish
11%American
10%European
3%Polish
3%Danish
Year of entry for the foreign-born population
2762010 or later
982000 to 2009
1531990 to 1999
191Before 1990
Public elementary/middle schools in in zip code 78669 not listed on the city page:
LAKE TRAVIS MIDDLE(Students: 725, Location: 4932 BEE CREEK RD, Grades: 6-8)
WEST CYPRESS HILLS EL (Location: 6112 CYPRESS RANCH BLVD, Grades: PK-5)
Housing units lacking complete plumbing facilities: 1.6%
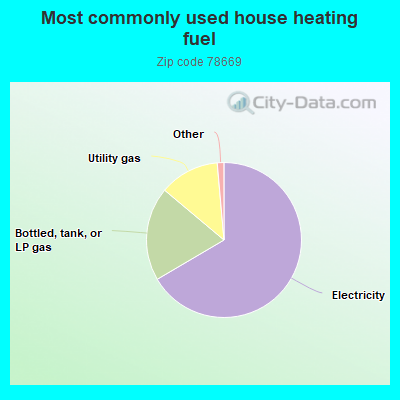
66.6%Electricity
19.6%Bottled, tank, or LP gas
12.5%Utility gas
0.8%No fuel used
0.6%Wood
Population in 1990: 2,235. Population change in the 1990s: +3,292 (+147.3%).
Place of birth for U.S.-born residents:
This state: 5,783
Northeast: 542
Midwest: 1,395
South: 1,128
West: 1,594
50% of the 78669 zip code residents lived in the same house 5 years ago. Out of people who lived in different houses, 48% lived in this county. Out of people who lived in different counties, 50% lived in Texas.
92% of the 78669 zip code residents lived in the same house 1 year ago. Out of people who lived in different houses, 71% moved from this county. Out of people who lived in different houses, 20% moved from different county within same state. Out of people who lived in different houses, 6% moved from different state.
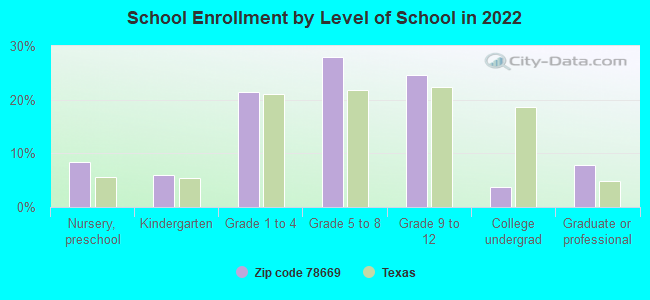
Private vs. public school enrollment:
Students in private schools in grades 1 to 8 (elementary and middle school): 112
Here:
10.7%
Texas:
8.8%
Students in private schools in grades 9 to 12 (high school): 28
Here:
5.3%
Texas:
8.0%
Students in private undergraduate colleges: 2
Here:
3.6%
Texas:
16.2%
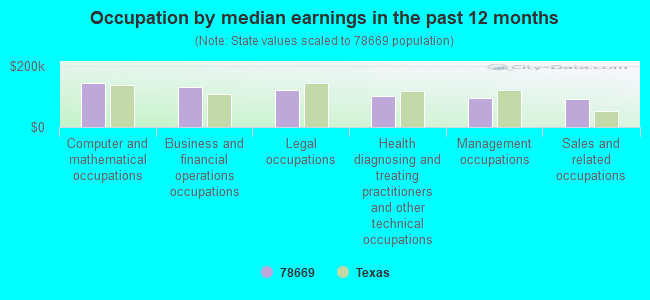
Occupation by median earnings in the past 12 months ($)
143,425Computer and mathematical occupations
131,617Business and financial operations occupations
120,700Legal occupations
100,390Health diagnosing and treating practitioners and other technical occupations
94,982Management occupations
91,918Sales and related occupations
Companies with federal contracts located in this zip code (SPICEWOOD, TX):
APPLIED PHYSICAL ELECTRONICS L (19510 W HWY 71; small business) : $3,812,900 in 13 contractsfrom 2000 to 2006
Contracts for Defense Missile and Space Systems -- Advanced Development (R&D), Weapons -- Basic Research (R&D), Defense Aircraft -- Applied Research and Exploratory Development (R&D), Other Defense -- Applied Research and Exploratory Development (R&D), and moreby Army, Air Force Signed by year:2000: $150,000; 2001: $99,797; 2002: $375,000; 2003: $474,667; 2004: $915,750; 2005: $1,597,686; 2006: $200,000.
Biggest contracts:
$1,497,686 with Army for Defense Missile and Space Systems -- Advanced Development (R&D). Signed on 2005-07-05. Completion date: 2006-07-05.
$600,000 with Air Force for Weapons -- Basic Research (R&D). Signed on 2004-08-09. Completion date: 2006-08-09.
$375,000 with Air Force for Defense Aircraft -- Applied Research and Exploratory Development (R&D). Signed on 2002-09-09. Completion date: 2004-09-16.
$374,804, same as above.Signed on 2003-03-18. Completion date: 2004-08-31.
SYSTEMS & MATERIALS RESEARCH C (19300 CROSSWIND CIR; small business) : $3,603,339 in 24 contractsfrom 2000 to 2006
Contracts for Defense Electronics and Communication Equipment -- Applied Research and Exploratory Development (R&D), Physical Sciences -- Management and Support (R&D), Defense Electronics and Communication Equipment -- Advanced Development (R&D), Invalid code: AC17, and moreby Navy, Air Force, Research and Innovative Technology Administration, Army, and others Signed by year:2000: $247,866; 2001: $1,247,047; 2002: $568,451; 2003: $69,993; 2004: $639,985; 2005: $729,998; 2006: $99,999.
Biggest contracts:
$597,451 with Navy for Defense Electronics and Communication Equipment -- Applied Research and Exploratory Development (R&D). Signed on 2001-12-26. Completion date: 2003-03-22.
$400,000, same as above.Signed on 2004-12-23. Completion date: 2006-12-23.
$300,000, same as above.Signed on 2001-03-23. Completion date: 2003-03-22.
$250,000 with Air Force for Physical Sciences -- Management and Support (R&D). Signed on 2002-05-31. Completion date: 2003-10-31.
SOFTPLC (25603 RED BRANGUS DR; small business) : $639,436 in 32 contractsfrom 2001 to 2006
Contracts for ADP Software, ADP Support Equipment, ADPE System Configuration, ADP Components, and moreby Army, U.S. Army Corps of Engineers - civil program financing only Signed by year:2000: $0; 2001: $36,580; 2002: $38,335; 2003: $49,730; 2004: $294,046; 2005: $195,060; 2006: $25,685.
Biggest contracts:
$56,945 with Army for ADP Software. Taking place in MT. Signed on 2004-07-14. Completion date: 2004-08-20.
$56,945 with U.S. Army Corps of Engineers - civil program financing only for ADP Software. Taking place in MT. Signed on 2004-07-14. Completion date: 2004-08-20.
$43,500 with Army for ADP Software. Signed on 2004-08-10. Completion date: 2005-07-31.
$43,500 with U.S. Army Corps of Engineers - civil program financing only for ADP Software. Signed on 2004-08-10. Completion date: 2005-07-31.
EQUIPMENT SPECIALISTS, INC (919 DEBCO LANE; small business) : $315,578 in 4 contractsfrom 2003 to 2005
$262,822 with Army for Miscellaneous Special Industry Machinery. Signed on 2005-07-20. Completion date: 2005-09-30.
$50,201 with Army for Motor Vehicle Maintenance and Repair Shop Specialized Equipment. Signed on 2003-09-26. Completion date: 2003-12-25.
$2,805 with Army for Maintenance, Repair or Alteration of Real Property -- Maintenance Buildings. Signed on 2004-03-30. Completion date: 2003-12-25.
-$250 with Army for Miscellaneous Special Industry Machinery. Signed on 2005-11-10. Completion date: 2005-09-30.
Top industries in this zip code by the number of employees in 2005:
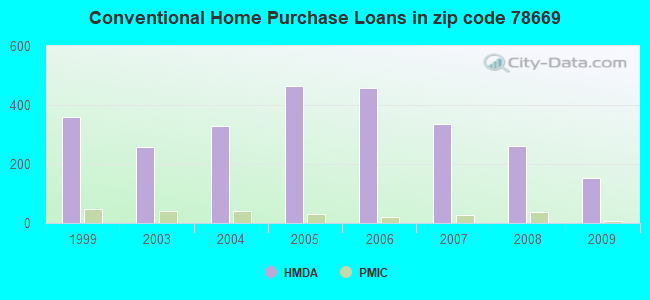
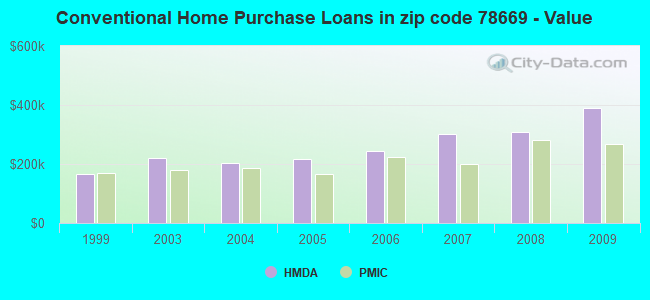
Detailed PMIC statistics for the following Tracts:0017.64
2002 - 2018 National Fire Incident Reporting System (NFIRS) incidents
According to the data from the years 2002 - 2018 the average number of fires per year is 51. The highest number of reported fire incidents - 117 took place in 2017, and the least - 3 in 2013. The data has a growing trend.
When looking into fire subcategories, the most reports belonged to: Outside Fires (61.9%), and Structure Fires (23.5%).
Fire incident types reported to NFIRS in Zip Code 78669


 Nearest zip codes: 78645, 78734, 78654, 78738, 78620, 78732.


 (Students: 725, Location: 4932 BEE CREEK RD, Grades: 6-8)
 According to the data from the years 2002 - 2018 the average number of fires per year is 51. The highest number of reported fire incidents - 117 took place in 2017, and the least - 3 in 2013. The data has a growing trend.
 When looking into fire subcategories, the most reports belonged to: Outside Fires (61.9%), and Structure Fires (23.5%).