Estimated zip code population in 2022: 38,391 Zip code population in 2010: 19,139 Zip code population in 2000: 10,898
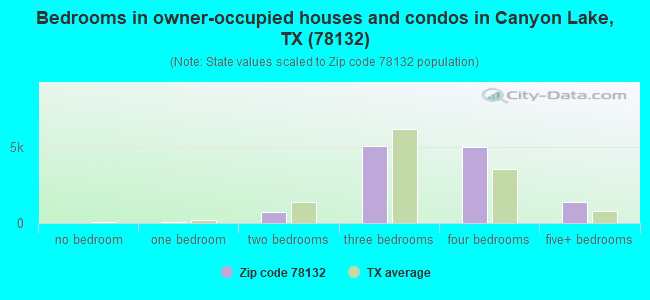
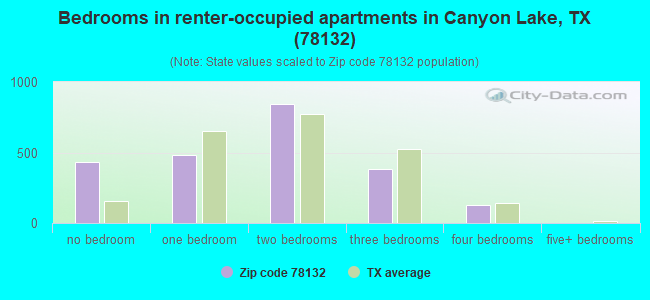
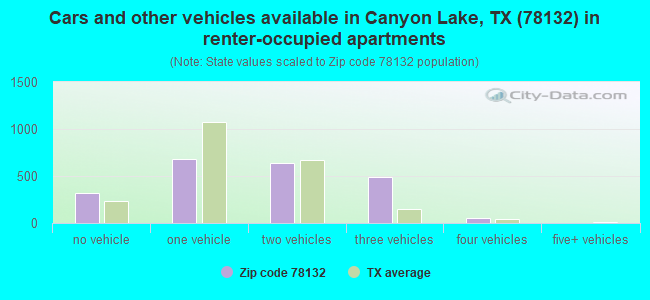
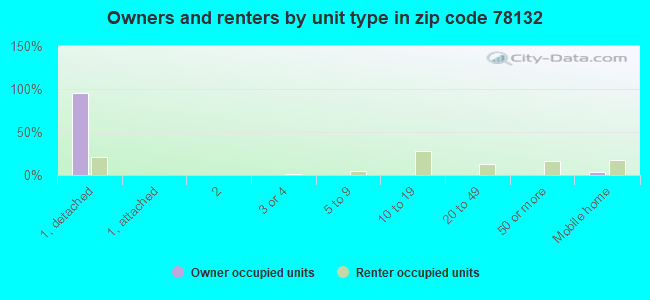
Houses and condos: 15,167 Renter-occupied apartments: 2,199
% of renters here:
15%
State:
38%
March 2022 cost of living index in zip code 78132: 82.7 (low, U.S. average is 100)
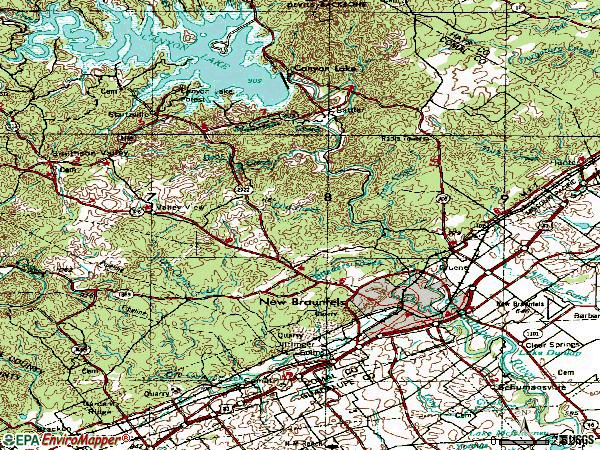
Land area: 185.6 sq. mi. Water area: 0.7 sq. mi.
Population density: 207 people per square mile
(very low).
OSM Map
General Map
Google Map
MSN Map
OSM Map
General Map
Google Map
MSN Map
OSM Map
General Map
Google Map
MSN Map
OSM Map
General Map
Google Map
MSN Map
Please wait while loading the map...
Real estate property taxes paid for housing units in 2022:
This zip code:
1.2% ($6,873)
Texas:
1.5% ($4,050)
Median real estate property taxes paid for housing units with mortgages in 2022: $7,670 (1.3%) Median real estate property taxes paid for housing units with no mortgage in 2022: $5,531 (1.0%)
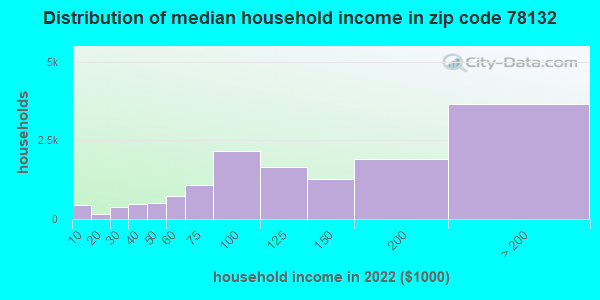
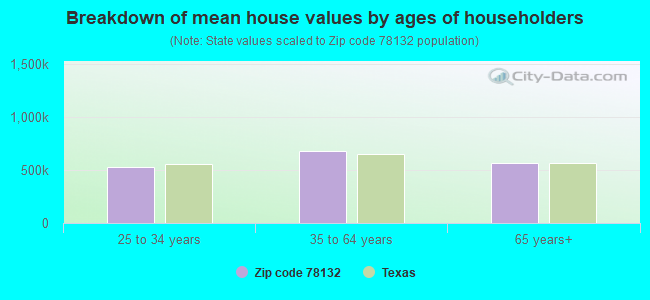
Estimated median house/condo value in 2022: $583,431
78132:
$583,431
Texas:
$275,400
According to our research of Texas and other state lists, there were 25 registered sex offenders living in 78132 zip code as of April 27, 2024. The ratio of all residents to sex offenders in zip code 78132 is 1,024 to 1. The ratio of registered sex offenders to all residents in this zip code is lower than the state average.
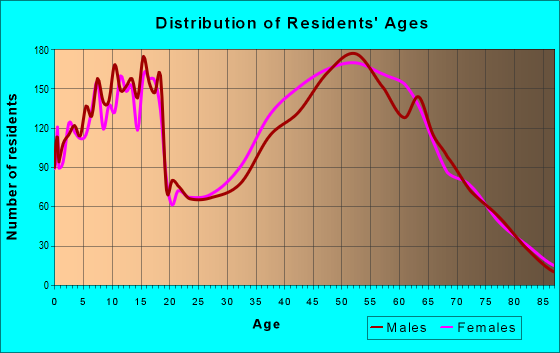
Median resident age:
This zip code:
43.8 years
Texas median age:
35.6 years
Average household size:
This zip code:
2.6 people
Texas:
2.6 people
Averages for the 2020 tax year for zip code 78132, filed in 2021:
Average Adjusted Gross Income (AGI) in 2020: $123,031 (Individual Income Tax Returns)
Here:
$123,031
State:
$77,054
Salary/wage: $96,283 (reported on 77.9% of returns)
Here:
$96,283
State:
$62,766
(% of AGI for various income ranges: 1149.3% for AGIs below $25k, 3415.4% for AGIs $25k-50k, 5831.3% for AGIs $50k-75k, 8309.1% for AGIs $75k-100k, 16999.1% for AGIs $100k-200k, 69218.4% for AGIs over 200k)
Taxable interest for individuals: $2,463 (reported on 47.2% of returns)
This zip code:
$2,463
Texas:
$2,665
(% of AGI for various income ranges: 24.4% for AGIs below $25k, 45.7% for AGIs $25k-50k, 97.5% for AGIs $50k-75k, 160.3% for AGIs $75k-100k, 193.0% for AGIs $100k-200k, 1217.4% for AGIs over 200k)
Ordinary dividends: $8,197 (reported on 38.6% of returns)
Here:
$8,197
State:
$10,044
(% of AGI for various income ranges: 51.1% for AGIs below $25k, 80.5% for AGIs $25k-50k, 172.6% for AGIs $50k-75k, 369.4% for AGIs $75k-100k, 450.6% for AGIs $100k-200k, 3871.8% for AGIs over 200k)
Net capital gain/loss in AGI: +$24,842 (reported on 30.0% of returns)
Here:
+$24,842
State:
+$39,590
(% of AGI for various income ranges: 17.0% for AGIs below $25k, 50.2% for AGIs $25k-50k, 179.5% for AGIs $50k-75k, 343.5% for AGIs $75k-100k, 710.6% for AGIs $100k-200k, 11685.9% for AGIs over 200k)
Profit/loss from business: +$20,215 (reported on 20.7% of returns)
Here:
+$20,215
State:
+$10,888
(% of AGI for various income ranges: 108.0% for AGIs below $25k, 233.0% for AGIs $25k-50k, 278.7% for AGIs $50k-75k, 491.7% for AGIs $75k-100k, 823.9% for AGIs $100k-200k, 3998.6% for AGIs over 200k)
Taxable individual retirement arrangement distribution: $33,828 (reported on 13.5% of returns)
78132:
$33,828
Texas:
$24,740
(% of AGI for various income ranges: 74.0% for AGIs below $25k, 177.3% for AGIs $25k-50k, 411.3% for AGIs $50k-75k, 637.0% for AGIs $75k-100k, 1276.1% for AGIs $100k-200k, 3399.8% for AGIs over 200k)
Self-employed (Keogh) retirement plans: $22,769 (reported on 0.9% of returns)
78132:
$22,769
Texas:
$29,298
(% of AGI for various income ranges: 38.9% for AGIs $100k-200k, 272.2% for AGIs over 200k)
Total itemized deductions: $37,589 (reported on 17.3% of returns)
Here:
$37,589
State:
$40,428
(% of AGI for various income ranges: 89.9% for AGIs below $25k, 222.8% for AGIs $25k-50k, 467.7% for AGIs $50k-75k, 843.7% for AGIs $75k-100k, 1412.3% for AGIs $100k-200k, 6282.8% for AGIs over 200k)
Charity contributions: $13,296 (reported on 14.3% of returns)
Here:
$13,296
State:
$18,201
(% of AGI for various income ranges: 5.9% for AGIs below $25k, 26.5% for AGIs $25k-50k, 55.8% for AGIs $50k-75k, 161.5% for AGIs $75k-100k, 323.5% for AGIs $100k-200k, 2449.2% for AGIs over 200k)
Taxes paid: $8,219 (reported on 17.0% of returns)
78132:
$8,219
State:
$7,821
(% of AGI for various income ranges: 16.3% for AGIs below $25k, 42.4% for AGIs $25k-50k, 101.4% for AGIs $50k-75k, 195.6% for AGIs $75k-100k, 345.2% for AGIs $100k-200k, 1244.3% for AGIs over 200k)
Earned income credit: $2,146 (reported on 8.0% of returns)
Here:
$2,146
State:
$2,584
(% of AGI for various income ranges: 62.2% for AGIs below $25k, 56.7% for AGIs $25k-50k, 1.6% for AGIs $50k-75k)
Percentage of individuals using paid preparers for their 2020 taxes: 92.1%
Here:
92%
State:
92%
(% for various income ranges: 90.6% for AGIs below $25k, 91.5% for AGIs $25k-50k, 92.7% for AGIs $50k-75k, 92.4% for AGIs $75k-100k, 92.5% for AGIs $100k-200k, 93.7% for AGIs over 200k)
Averages for the 2012 tax year for zip code 78132, filed in 2013:
Average Adjusted Gross Income (AGI) in 2012: $104,583 (Individual Income Tax Returns)
Here:
$104,583
State:
$65,384
Salary/wage: $75,187 (reported on 81.2% of returns)
Here:
$75,187
State:
$52,524
(% of AGI for various income ranges: 75.2% for AGIs below $25k, 69.3% for AGIs $25k-50k, 64.8% for AGIs $50k-75k, 68.6% for AGIs $75k-100k, 71.6% for AGIs $100k-200k, 44.2% for AGIs over 200k)
Taxable interest for individuals: $2,423 (reported on 49.1% of returns)
This zip code:
$2,423
Texas:
$2,372
(% of AGI for various income ranges: 2.0% for AGIs below $25k, 1.5% for AGIs $25k-50k, 1.1% for AGIs $50k-75k, 1.2% for AGIs $75k-100k, 0.8% for AGIs $100k-200k, 1.3% for AGIs over 200k)
Ordinary dividends: $5,118 (reported on 28.9% of returns)
Here:
$5,118
State:
$9,721
(% of AGI for various income ranges: 2.5% for AGIs below $25k, 1.8% for AGIs $25k-50k, 1.8% for AGIs $50k-75k, 1.5% for AGIs $75k-100k, 1.4% for AGIs $100k-200k, 1.2% for AGIs over 200k)
Net capital gain/loss in AGI: +$36,900 (reported on 25.6% of returns)
Here:
+$36,900
State:
+$35,319
(% of AGI for various income ranges: 0.2% for AGIs below $25k, 0.6% for AGIs $25k-50k, 1.2% for AGIs $50k-75k, 1.0% for AGIs $75k-100k, 1.6% for AGIs $100k-200k, 18.4% for AGIs over 200k)
Profit/loss from business: +$19,192 (reported on 21.1% of returns)
Here:
+$19,192
State:
+$13,732
(% of AGI for various income ranges: 6.8% for AGIs below $25k, 7.1% for AGIs $25k-50k, 4.5% for AGIs $50k-75k, 3.9% for AGIs $75k-100k, 3.9% for AGIs $100k-200k, 3.2% for AGIs over 200k)
Taxable individual retirement arrangement distribution: $20,967 (reported on 13.2% of returns)
78132:
$20,967
Texas:
$19,511
(% of AGI for various income ranges: 4.1% for AGIs below $25k, 3.6% for AGIs $25k-50k, 4.3% for AGIs $50k-75k, 3.8% for AGIs $75k-100k, 3.7% for AGIs $100k-200k, 1.3% for AGIs over 200k)
Self-employment retirement plans: $18,817 (reported on 1.2% of returns)
78132:
$18,817
Texas:
$23,938
(% of AGI for various income ranges: 0.3% for AGIs $25k-50k, 0.2% for AGIs $100k-200k, 0.3% for AGIs over 200k)
Total itemized deductions: $26,496 (14% of AGI, reported on 42.1% of returns)
Here:
$26,496
State:
$24,724
Here:
14.3% of AGI
State:
15.9% of AGI
(% of AGI for various income ranges: 11.4% for AGIs below $25k, 12.3% for AGIs $25k-50k, 14.3% for AGIs $50k-75k, 14.0% for AGIs $75k-100k, 13.5% for AGIs $100k-200k, 7.3% for AGIs over 200k)
Charity contributions: $6,686 (reported on 34.9% of returns)
Here:
$6,686
State:
$6,808
(% of AGI for various income ranges: 0.8% for AGIs below $25k, 1.1% for AGIs $25k-50k, 1.6% for AGIs $50k-75k, 2.1% for AGIs $75k-100k, 2.2% for AGIs $100k-200k, 2.6% for AGIs over 200k)
Taxes paid: $7,521 (reported on 41.6% of returns)
78132:
$7,521
State:
$6,921
(% of AGI for various income ranges: 2.5% for AGIs below $25k, 2.7% for AGIs $25k-50k, 4.1% for AGIs $50k-75k, 4.3% for AGIs $75k-100k, 4.0% for AGIs $100k-200k, 1.9% for AGIs over 200k)
Earned income credit: $2,179 (reported on 10.3% of returns)
Here:
$2,179
State:
$2,570
(% of AGI for various income ranges: 5.0% for AGIs below $25k, 1.0% for AGIs $25k-50k)
Percentage of individuals using paid preparers for their 2012 taxes: 47.7%
Here:
48%
State:
51%
(% for various income ranges: 37.5% for AGIs below $25k, 47.6% for AGIs $25k-50k, 49.1% for AGIs $50k-75k, 49.6% for AGIs $75k-100k, 50.0% for AGIs $100k-200k, 73.6% for AGIs over 200k)
Averages for the 2004 tax year for zip code 78132, filed in 2005:
Average Adjusted Gross Income (AGI) in 2004: $64,253 (Individual Income Tax Returns)
Here:
$64,253
State:
$47,881
Salary/wage: $53,594 (reported on 80.4% of returns)
Here:
$53,594
State:
$41,947
(% of AGI for various income ranges: 138.7% for AGIs below $10k, 72.6% for AGIs $10k-25k, 72.8% for AGIs $25k-50k, 71.9% for AGIs $50k-75k, 74.4% for AGIs $75k-100k, 61.3% for AGIs over 100k)
Taxable interest for individuals: $2,560 (reported on 56.3% of returns)
This zip code:
$2,560
Texas:
$2,255
(% of AGI for various income ranges: 10.4% for AGIs below $10k, 3.1% for AGIs $10k-25k, 2.3% for AGIs $25k-50k, 2.0% for AGIs $50k-75k, 1.9% for AGIs $75k-100k, 2.2% for AGIs over 100k)
Taxable dividends: $3,197 (reported on 31.9% of returns)
Here:
$3,197
State:
$4,261
(% of AGI for various income ranges: 5.8% for AGIs below $10k, 1.6% for AGIs $10k-25k, 1.4% for AGIs $25k-50k, 1.3% for AGIs $50k-75k, 0.9% for AGIs $75k-100k, 1.8% for AGIs over 100k)
Net capital gain/loss: +$8,741 (reported on 28.4% of returns)
Here:
+$8,741
State:
+$16,110
(% of AGI for various income ranges: -1.6% for AGIs below $10k, 0.4% for AGIs $10k-25k, 0.6% for AGIs $25k-50k, 0.7% for AGIs $50k-75k, 2.2% for AGIs $75k-100k, 6.1% for AGIs over 100k)
Profit/loss from business: +$15,442 (reported on 22.3% of returns)
Here:
+$15,442
State:
+$11,013
(% of AGI for various income ranges: 1.6% for AGIs below $10k, 6.8% for AGIs $10k-25k, 5.2% for AGIs $25k-50k, 4.5% for AGIs $50k-75k, 4.2% for AGIs $75k-100k, 5.8% for AGIs over 100k)
IRA payment deduction: $3,604 (reported on 4.2% of returns)
78132:
$3,604
Texas:
$3,120
(% of AGI for various income ranges: 0.4% for AGIs $10k-25k, 0.3% for AGIs $25k-50k, 0.4% for AGIs $50k-75k, 0.3% for AGIs $75k-100k, 0.2% for AGIs over 100k)
Self-employed pension: $13,429 (reported on 1.4% of returns)
Here:
$13,429
Texas:
$16,401
(% of AGI for various income ranges: 0.2% for AGIs $50k-75k, 0.2% for AGIs $75k-100k, 0.4% for AGIs over 100k)
Total itemized deductions: $20,532 (19% of AGI, reported on 38.3% of returns)
Here:
$20,532
State:
$19,631
Here:
19.2% of AGI
State:
18.9% of AGI
(% of AGI for various income ranges: 21.9% for AGIs below $10k, 11.5% for AGIs $10k-25k, 12.1% for AGIs $25k-50k, 14.9% for AGIs $50k-75k, 14.9% for AGIs $75k-100k, 10.8% for AGIs over 100k)
Charity contributions deductions: $4,262 (4% of AGI, reported on 32.8% of returns)
Here:
$4,262
State:
$4,753
Here:
3.8% of AGI
State:
4.2% of AGI
(% of AGI for various income ranges: 1.1% for AGIs below $10k, 1.2% for AGIs $10k-25k, 1.4% for AGIs $25k-50k, 2.2% for AGIs $50k-75k, 2.2% for AGIs $75k-100k, 2.4% for AGIs over 100k)
Total tax: $12,252 (reported on 77.5% of returns)
78132:
$12,252
State:
$9,058
(% of AGI for various income ranges: 5.7% for AGIs below $10k, 4.3% for AGIs $10k-25k, 6.7% for AGIs $25k-50k, 8.6% for AGIs $50k-75k, 10.3% for AGIs $75k-100k, 20.0% for AGIs over 100k)
Earned income credit: $1,724 (reported on 10.2% of returns)
Here:
$1,724
State:
$2,024
Percentage of individuals using paid preparers for their 2004 taxes: 53.9%
Here:
54%
State:
57%
(% for various income ranges: 47.7% for AGIs below $10k, 53.3% for AGIs $10k-25k, 53.5% for AGIs $25k-50k, 55.4% for AGIs $50k-75k, 55.4% for AGIs $75k-100k, 60.4% for AGIs over 100k)
Likely homosexual households (counted as self-reported same-sex unmarried-partner households)
Lesbian couples: 0.0% of all households
Gay men: 0.0% of all households
Household received Food Stamps/SNAP in the past 12 months: 328 Household did not receive Food Stamps/SNAP in the past 12 months: 14,045
Women who had a birth in the past 12 months: 311 (273 now married, 40 unmarried) Women who did not have a birth in the past 12 months: 7,967 (4,788 now married, 3,138 unmarried)
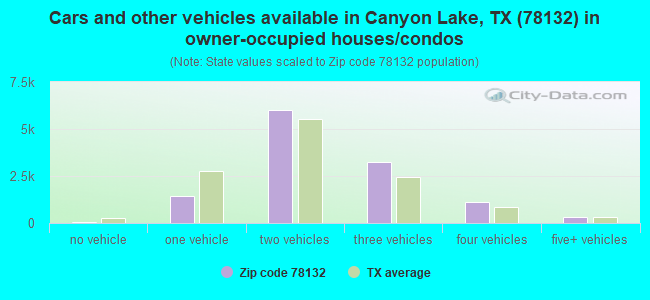
Housing units in zip code 78132 with a mortgage: 7,830 (528 second mortgage, 52 home equity loan, 320 both second mortgage and home equity loan) Houses without a mortgage: 163
Median monthly owner costs for units with a mortgage: $2,763 Median monthly owner costs for units without a mortgage: $884
Residents with income below the poverty level in 2022:
This zip code:
3.3%
Whole state:
14.0%
Residents with income below 50% of the poverty level in 2022:
This zip code:
1.5%
Whole state:
7.4%
Median number of rooms in houses and condos:
Here:
7.4
State:
6.3
Median number of rooms in apartments:
Here:
3.2
State:
4.0
Notable locations in this zip code not listed on our city pages
Notable locations in zip code 78132: Circle Dot Ranch (A), Wegner Ranch (B), Krueger Ranch (C), Mission Valley Guest Ranch (D), New Braunfels Fire Department Station 2 (E), Bracken Volunteer Fire Department Station 1 Central (F), Bracken Volunteer Fire Department Station 2 (G), SouthernCross Ambulance (H), Canyon Lake Fire and Emergency Medical Service Headquarters (I). Display/hide their locations on the map
Cemeteries: Smithson Valley Cemetery (1), Kraft Cemetery (2), Kellerman Cemetery (3), Rosenthal Cemetery (4), Conrads Cemetery (5), Heimer Cemetery (6), Gerhardt Cemetery (7). Display/hide their locations on the map
Reservoirs: Soil Conservation Service Site 5 Reservoir (A), Haley Tank (B), Soil Conservation Service Site 3 Reservoir (C), Soil Conservation Service Site 1 Reservoir (D), Soil Conservation Service Site Number 2 Reservoir (E). Display/hide their locations on the map
Creeks: Bear Creek (A), West Fork Dry Comal Creek (B), Fourmile Creek (C), Tausch Creek (D), Turkey Creek (E), Mountain Creek (F), Jacobs Creek (G), Isaac Creek (H), Elm Creek (I). Display/hide their locations on the map
In group quarters: 43 (-1 institutionalized population)
Size of family households: 5,447 2-persons, 2,373 3-persons, 2,349 4-persons, 871 5-persons, 411 6-persons, 112 7-or-more-persons
Size of nonfamily households: 2,225 1-person, 535 2-persons, 63 3-persons
7,662 married couples with children.
951 single-parent households (356 men, 595 women).
87.9% of residents of 78132 zip code speak English at home.
10.1% of residents speak Spanish at home (81% very well, 12% well, 6% not well, 1% not at all).
1.1% of residents speak other Indo-European language at home (86% very well, 10% well, 5% not well).
0.8% of residents speak Asian or Pacific Island language at home (74% very well, 25% well, 1% not well).
0.4% of residents speak other language at home (100% very well).
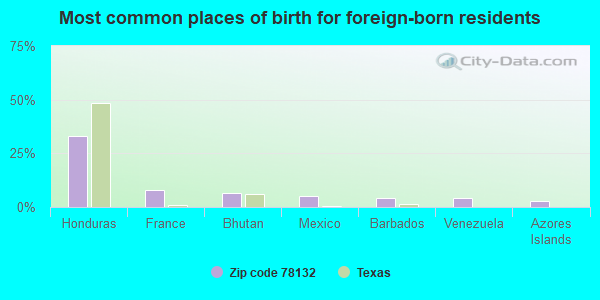
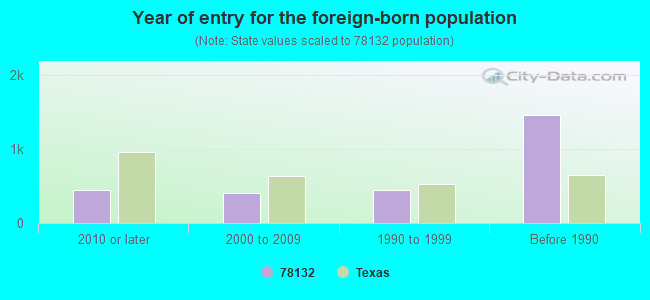
Foreign born population: 2,380 (6.2%) (68.2% of them are naturalized citizens)
Facilities with environmental interests located in this zip code:
2YNO NOBEL MID AMERICA - NEW BRAUNFELS SITE (1758 KRUGER CANYON in NEW BRAUNFELS, TX)
(Integrated Compliance Information System) - ICIS-06-2000-0918, FORMAL ENFORCEMENT ACTION Business SIC classification: EXPLOSIVES
APG LIME CORP (WALD RD (RT 6 BOX 662) in NEW BRAUNFELS, TX)
COMPLIANCE ACTIVITY (Tracking inspections of insecticide, fungicide, and rodenticide, and toxic substances) Business SIC classification: CONCRETE PRODUCTS, EXCEPT BLOCK AND BRICK; LIME
Housing units lacking complete plumbing facilities: 0.8% Housing units lacking complete kitchen facilities: 1.6%
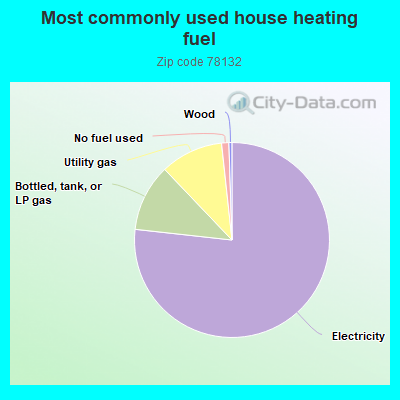
76.6%Electricity
11.1%Bottled, tank, or LP gas
10.4%Utility gas
1.2%No fuel used
0.5%Wood
Population in 1990: 6,412. Population change in the 1990s: +4,486 (+70.0%).
Place of birth for U.S.-born residents:
This state: 21,749
Northeast: 1,627
Midwest: 4,198
South: 3,798
West: 4,226
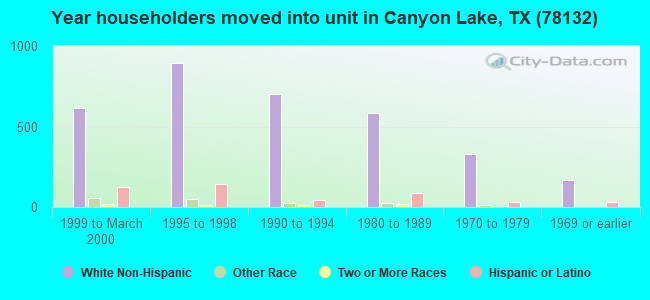
54% of the 78132 zip code residents lived in the same house 5 years ago. Out of people who lived in different houses, 45% lived in this county. Out of people who lived in different counties, 50% lived in Texas.
88% of the 78132 zip code residents lived in the same house 1 year ago. Out of people who lived in different houses, 23% moved from this county. Out of people who lived in different houses, 47% moved from different county within same state. Out of people who lived in different houses, 28% moved from different state. Out of people who lived in different houses, 6% moved from abroad.
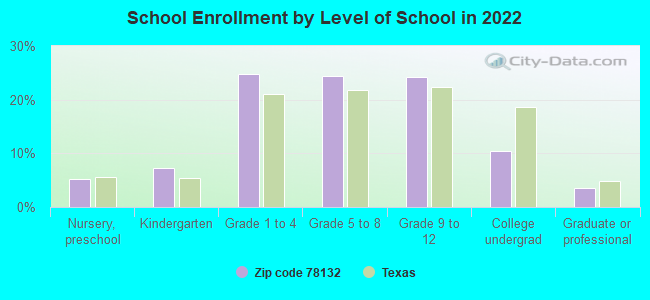
Private vs. public school enrollment:
Students in private schools in grades 1 to 8 (elementary and middle school): 823
Here:
17.8%
Texas:
8.8%
Students in private schools in grades 9 to 12 (high school): 397
Here:
17.6%
Texas:
8.0%
Students in private undergraduate colleges: 176
Here:
18.2%
Texas:
16.2%
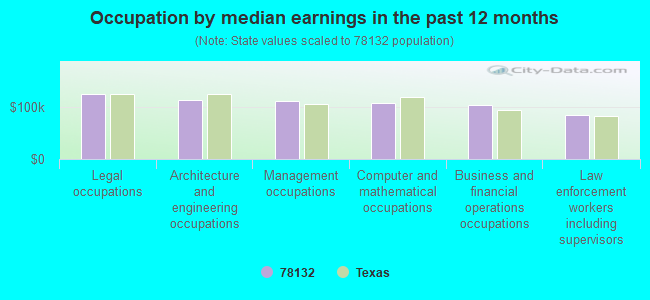
Occupation by median earnings in the past 12 months ($)
125,428Legal occupations
113,232Architecture and engineering occupations
111,822Management occupations
108,147Computer and mathematical occupations
104,283Business and financial operations occupations
84,971Law enforcement workers including supervisors
Companies with biggest federal contracts located in this zip code (NEW BRAUNFELS, TX):
CANYON LAKE WATER SUPPLY CORPO (1399 SATTLER ROAD; small business) : $255,678 in 3 contractsfrom 2001 to 2004
$89,460 with U.S. Army Corps of Engineers - civil program financing only for Maintenance, Repair or Alteration of Real Property -- Water Supply Facilities. Signed on 2001-09-25. Completion date: 2001-10-25.
$83,109 with U.S. Army Corps of Engineers - civil program financing only for Maintenance, Repair or Alteration of Real Property -- Other Utilities. Signed on 2004-01-27. Completion date: 2004-02-25.
$83,109 with Army for Maintenance, Repair or Alteration of Real Property -- Other Utilities. Signed on 2004-01-27. Completion date: 2004-02-25.
FLANDERS, JONE GEIMER (194 WINTERBURY COVE; small business) : $232,920 in 7 contractsfrom 2002 to 2004
Contracts for Evaluation and Screening, Cardio-Vascular Services by Army Signed by year:2000: $0; 2001: $0; 2002: $105,950; 2003: $35,360; 2004: $91,610; 2005: $0; 2006: $0.
Biggest contracts:
$114,100 with Army for Evaluation and Screening. Signed on 2004-10-05. Completion date: 2005-09-30.
$105,950 with Army for Cardio-Vascular Services. Signed on 2003-10-24. Completion date: 2003-09-30.
$105,950, same as above.Signed on 2002-12-18. Completion date: 2003-09-30.
$2,145, same as above.Signed on 2004-11-03. Completion date: 2003-09-30.
BENHAM, BRIAN (110 QUARRY POINT; small business)
$81,875 with Army for Nursing Services. Signed on 2006-03-09. Completion date: 2006-09-30.
ELITE MECHANICAL OF TEXAS, INC (5737 MORNINGSIDE DR; small business) : $42,797 in 5 contractsfrom 2000 to 2006
Contracts for Maintenance, Repair or Alteration of Real Property -- Other Residential Buildings, Maintenance, Repair or Alteration of Real Property -- Office Buildings, Facilities Operations Support Services by Air Force Signed by year:2000: $39,905; 2001: $0; 2002: $0; 2003: $0; 2004: $0; 2005: $0; 2006: $2,892.
Biggest contracts:
$15,960 with Air Force for Maintenance, Repair or Alteration of Real Property -- Other Residential Buildings. Signed on 2000-05-15. Completion date: 2000-06-07.
$15,960 with Air Force for Maintenance, Repair or Alteration of Real Property -- Office Buildings. Signed on 2000-08-02. Completion date: 2000-09-29.
$4,515, same as above.Signed on 2000-09-23. Completion date: 2000-11-22.
$3,470, same as above.Signed on 2000-08-02. Completion date: 2000-04-28.
T BAR M, INC (2549 HIGHWAY 46 WEST; small business) : $26,540 in 4 contractsfrom 2003 to 2004
$10,480 with Army for Lease or Rental of Facilities -- Recreational Buildings. Signed on 2004-06-08. Completion date: 2004-08-27.
$9,040 with Army for Construction of Structures and Facilities -- Conference Space and Facilities. Signed on 2003-06-13. Completion date: 2003-08-22.
$7,760 with Army for Lodging - Hotel/Motel. Signed on 2003-02-14. Completion date: 2003-05-16.
-$740 with Army for Construction of Structures and Facilities -- Conference Space and Facilities. Signed on 2003-09-12. Completion date: 2003-08-22.
ROBIN LANE-STONE BLUFF INVESTM (341 ROBIN LN; small business) : $15,830 in 2 contractsfrom 2005 to 2006
$8,075 with Air Force for Jewelry. Signed on 2005-05-02. Completion date: 2005-06-13.
$7,755, same as above.Signed on 2006-02-16. Completion date: 2006-03-31.
MIDTEX OIL L P (3455 I H 35 S; small business) : $15,213 in 2 contractsfrom 2003 to 2006
$9,344 with Army for Fuel Oils. Signed on 2006-05-31. Completion date: 2006-05-31.
$5,869 with Army for Petroleum -- Basic Research (R&D). Signed on 2003-04-03. Completion date: 2003-04-03.
FRITZ, ROBERT (1154 PINNACLE PARKWAY; small business) : $13,212 in 3 contractsfrom 2003 to 2006
$5,880 with Army for Food Services. Signed on 2004-04-30. Completion date: 2004-05-15.
$4,160 with Army for Condiments and Related Products. Signed on 2006-01-05. Completion date: 2006-01-08.
$3,172, same as above.Signed on 2003-05-15. Completion date: 2003-05-18.
SEEGER TRUCKING (133 MOBILE DR; small business)
$9,639 with Army for Miscellaneous Construction Materials. Signed on 2005-09-21. Completion date: 2005-09-30.
GUADALUPE VALLEY TELEPHONE COO (36101 FM 3159) : $7,555 in 2 contractsin 2005
$5,700 with Air Force for ADP Telecommunications and Transmission Services. Taking place in OK. Signed on 2005-09-23. Completion date: 2005-09-30.
$1,855, same as above.Signed on 2005-09-23. Completion date: 2005-09-30.
Top industries in this zip code by the number of employees in 2005:
Mining: Other Crushed and Broken Stone Mining and Quarrying (100-249 employees: 1 establishment)
2002 - 2018 National Fire Incident Reporting System (NFIRS) incidents
Based on the data from the years 2002 - 2018 the average number of fires per year is 41. The highest number of reported fire incidents - 169 took place in 2008, and the least - 4 in 2002. The data has a rising trend.
When looking into fire subcategories, the most reports belonged to: Outside Fires (65.9%), and Structure Fires (18.0%).
Fire incident types reported to NFIRS in Zip Code 78132


 Nearest zip codes: 78130, 78133, 78266, 78108, 78124, 78123.


 Based on the data from the years 2002 - 2018 the average number of fires per year is 41. The highest number of reported fire incidents - 169 took place in 2008, and the least - 4 in 2002. The data has a rising trend.
 When looking into fire subcategories, the most reports belonged to: Outside Fires (65.9%), and Structure Fires (18.0%).