Estimated zip code population in 2022: 93,728 Zip code population in 2010: 59,546 Zip code population in 2000: 44,014
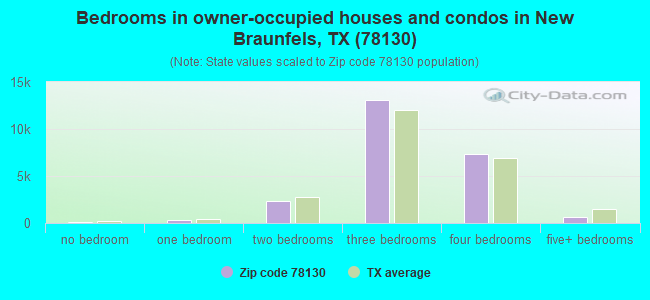
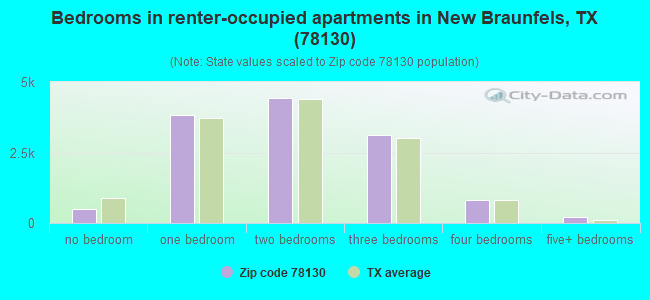
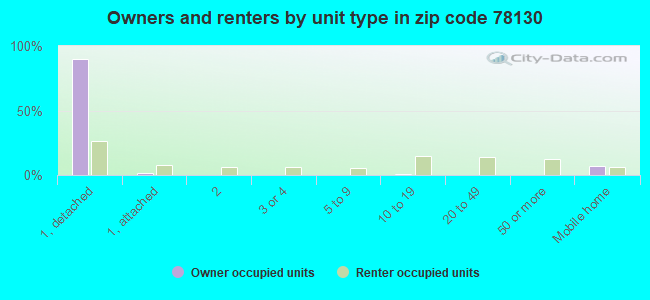
Houses and condos: 39,883 Renter-occupied apartments: 13,008
% of renters here:
35%
State:
38%
March 2022 cost of living index in zip code 78130: 88.6 (less than average, U.S. average is 100)
Land area: 92.3 sq. mi. Water area: 1.2 sq. mi.
Population density: 1,015 people per square mile
(low).
OSM Map
General Map
Google Map
MSN Map
OSM Map
General Map
Google Map
MSN Map
OSM Map
General Map
Google Map
MSN Map
OSM Map
General Map
Google Map
MSN Map
Please wait while loading the map...
Real estate property taxes paid for housing units in 2022:
This zip code:
1.3% ($4,242)
Texas:
1.5% ($4,050)
Median real estate property taxes paid for housing units with mortgages in 2022: $4,658 (1.4%) Median real estate property taxes paid for housing units with no mortgage in 2022: $3,625 (1.2%)
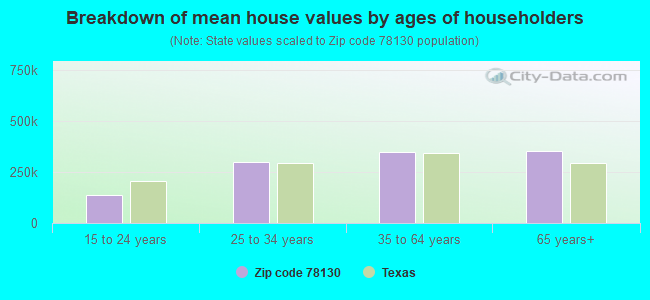
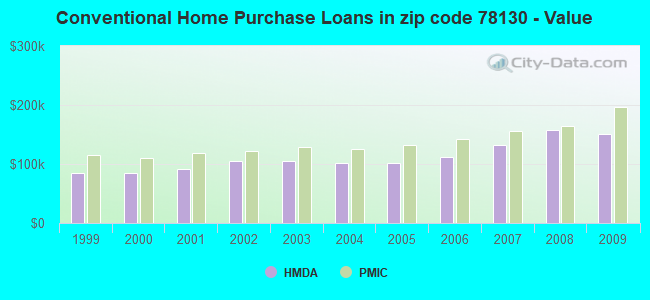
Estimated median house/condo value in 2022: $319,603
78130:
$319,603
Texas:
$275,400
According to our research of Texas and other state lists, there were 109 registered sex offenders living in 78130 zip code as of April 26, 2024. The ratio of all residents to sex offenders in zip code 78130 is 630 to 1. The ratio of registered sex offenders to all residents in this zip code is lower than the state average.
Median resident age:
This zip code:
35.5 years
Texas median age:
35.6 years
Average household size:
This zip code:
2.5 people
Texas:
2.6 people
Averages for the 2020 tax year for zip code 78130, filed in 2021:
Average Adjusted Gross Income (AGI) in 2020: $66,672 (Individual Income Tax Returns)
Here:
$66,672
State:
$77,054
Salary/wage: $55,950 (reported on 83.7% of returns)
Here:
$55,950
State:
$62,766
(% of AGI for various income ranges: 1150.7% for AGIs below $25k, 3502.1% for AGIs $25k-50k, 6293.3% for AGIs $50k-75k, 9257.0% for AGIs $75k-100k, 17275.0% for AGIs $100k-200k, 60179.2% for AGIs over 200k)
Taxable interest for individuals: $1,735 (reported on 26.9% of returns)
This zip code:
$1,735
Texas:
$2,665
(% of AGI for various income ranges: 14.7% for AGIs below $25k, 20.6% for AGIs $25k-50k, 30.5% for AGIs $50k-75k, 54.4% for AGIs $75k-100k, 89.4% for AGIs $100k-200k, 2060.8% for AGIs over 200k)
Ordinary dividends: $5,724 (reported on 15.0% of returns)
Here:
$5,724
State:
$10,044
(% of AGI for various income ranges: 19.2% for AGIs below $25k, 30.5% for AGIs $25k-50k, 59.6% for AGIs $50k-75k, 111.4% for AGIs $75k-100k, 219.2% for AGIs $100k-200k, 3519.0% for AGIs over 200k)
Net capital gain/loss in AGI: +$20,454 (reported on 14.3% of returns)
Here:
+$20,454
State:
+$39,590
(% of AGI for various income ranges: 9.6% for AGIs below $25k, 20.4% for AGIs $25k-50k, 58.3% for AGIs $50k-75k, 144.3% for AGIs $75k-100k, 428.2% for AGIs $100k-200k, 20418.4% for AGIs over 200k)
Profit/loss from business: +$13,166 (reported on 17.5% of returns)
Here:
+$13,166
State:
+$10,888
(% of AGI for various income ranges: 123.0% for AGIs below $25k, 166.0% for AGIs $25k-50k, 211.6% for AGIs $50k-75k, 351.0% for AGIs $75k-100k, 671.5% for AGIs $100k-200k, 4838.6% for AGIs over 200k)
Taxable individual retirement arrangement distribution: $20,481 (reported on 7.6% of returns)
78130:
$20,481
Texas:
$24,740
(% of AGI for various income ranges: 44.0% for AGIs below $25k, 72.7% for AGIs $25k-50k, 145.8% for AGIs $50k-75k, 263.4% for AGIs $75k-100k, 597.7% for AGIs $100k-200k, 3512.2% for AGIs over 200k)
Self-employed (Keogh) retirement plans: $19,433 (reported on 0.3% of returns)
78130:
$19,433
Texas:
$29,298
(% of AGI for various income ranges: 2.1% for AGIs $25k-50k, 21.6% for AGIs $100k-200k, 385.9% for AGIs over 200k)
Total itemized deductions: $30,743 (reported on 6.3% of returns)
Here:
$30,743
State:
$40,428
(% of AGI for various income ranges: 35.7% for AGIs below $25k, 88.7% for AGIs $25k-50k, 223.6% for AGIs $50k-75k, 372.1% for AGIs $75k-100k, 576.4% for AGIs $100k-200k, 5258.4% for AGIs over 200k)
Charity contributions: $10,963 (reported on 4.6% of returns)
Here:
$10,963
State:
$18,201
(% of AGI for various income ranges: 3.2% for AGIs below $25k, 9.8% for AGIs $25k-50k, 30.9% for AGIs $50k-75k, 61.5% for AGIs $75k-100k, 152.8% for AGIs $100k-200k, 2252.0% for AGIs over 200k)
Taxes paid: $6,579 (reported on 6.1% of returns)
78130:
$6,579
State:
$7,821
(% of AGI for various income ranges: 5.7% for AGIs below $25k, 17.1% for AGIs $25k-50k, 49.3% for AGIs $50k-75k, 83.1% for AGIs $75k-100k, 143.1% for AGIs $100k-200k, 925.5% for AGIs over 200k)
Earned income credit: $2,331 (reported on 14.9% of returns)
Here:
$2,331
State:
$2,584
(% of AGI for various income ranges: 89.3% for AGIs below $25k, 66.6% for AGIs $25k-50k, 1.2% for AGIs $50k-75k)
Percentage of individuals using paid preparers for their 2020 taxes: 92.7%
Here:
93%
State:
92%
(% for various income ranges: 91.1% for AGIs below $25k, 93.7% for AGIs $25k-50k, 92.9% for AGIs $50k-75k, 93.2% for AGIs $75k-100k, 93.8% for AGIs $100k-200k, 92.6% for AGIs over 200k)
Averages for the 2012 tax year for zip code 78130, filed in 2013:
Average Adjusted Gross Income (AGI) in 2012: $51,662 (Individual Income Tax Returns)
Here:
$51,662
State:
$65,384
Salary/wage: $43,861 (reported on 84.7% of returns)
Here:
$43,861
State:
$52,524
(% of AGI for various income ranges: 79.0% for AGIs below $25k, 81.0% for AGIs $25k-50k, 76.9% for AGIs $50k-75k, 78.2% for AGIs $75k-100k, 74.0% for AGIs $100k-200k, 42.7% for AGIs over 200k)
Taxable interest for individuals: $1,480 (reported on 28.5% of returns)
This zip code:
$1,480
Texas:
$2,372
(% of AGI for various income ranges: 1.2% for AGIs below $25k, 0.6% for AGIs $25k-50k, 0.7% for AGIs $50k-75k, 0.6% for AGIs $75k-100k, 0.9% for AGIs $100k-200k, 1.1% for AGIs over 200k)
Ordinary dividends: $4,848 (reported on 14.7% of returns)
Here:
$4,848
State:
$9,721
(% of AGI for various income ranges: 1.2% for AGIs below $25k, 0.7% for AGIs $25k-50k, 1.0% for AGIs $50k-75k, 0.8% for AGIs $75k-100k, 1.4% for AGIs $100k-200k, 3.1% for AGIs over 200k)
Net capital gain/loss in AGI: +$11,850 (reported on 12.6% of returns)
Here:
+$11,850
State:
+$35,319
(% of AGI for various income ranges: 0.2% for AGIs $25k-50k, 0.4% for AGIs $50k-75k, 0.8% for AGIs $75k-100k, 1.9% for AGIs $100k-200k, 14.0% for AGIs over 200k)
Profit/loss from business: +$14,220 (reported on 16.0% of returns)
Here:
+$14,220
State:
+$13,732
(% of AGI for various income ranges: 7.3% for AGIs below $25k, 3.8% for AGIs $25k-50k, 3.9% for AGIs $50k-75k, 3.1% for AGIs $75k-100k, 3.8% for AGIs $100k-200k, 6.1% for AGIs over 200k)
Taxable individual retirement arrangement distribution: $13,978 (reported on 8.9% of returns)
78130:
$13,978
Texas:
$19,511
(% of AGI for various income ranges: 2.6% for AGIs below $25k, 2.0% for AGIs $25k-50k, 2.2% for AGIs $50k-75k, 2.4% for AGIs $75k-100k, 3.0% for AGIs $100k-200k, 2.1% for AGIs over 200k)
Self-employment retirement plans: $18,575 (reported on 0.4% of returns)
78130:
$18,575
Texas:
$23,938
(% of AGI for various income ranges: 0.2% for AGIs $50k-75k, 0.2% for AGIs $100k-200k, 0.5% for AGIs over 200k)
Total itemized deductions: $19,872 (20% of AGI, reported on 23.6% of returns)
Here:
$19,872
State:
$24,724
Here:
19.7% of AGI
State:
15.9% of AGI
(% of AGI for various income ranges: 6.6% for AGIs below $25k, 7.6% for AGIs $25k-50k, 8.9% for AGIs $50k-75k, 10.1% for AGIs $75k-100k, 10.6% for AGIs $100k-200k, 9.3% for AGIs over 200k)
Charity contributions: $4,072 (reported on 17.4% of returns)
Here:
$4,072
State:
$6,808
(% of AGI for various income ranges: 0.6% for AGIs below $25k, 0.8% for AGIs $25k-50k, 1.1% for AGIs $50k-75k, 1.5% for AGIs $75k-100k, 1.8% for AGIs $100k-200k, 2.2% for AGIs over 200k)
Taxes paid: $5,226 (reported on 23.2% of returns)
78130:
$5,226
State:
$6,921
(% of AGI for various income ranges: 1.6% for AGIs below $25k, 1.8% for AGIs $25k-50k, 2.2% for AGIs $50k-75k, 2.7% for AGIs $75k-100k, 3.0% for AGIs $100k-200k, 2.3% for AGIs over 200k)
Earned income credit: $2,361 (reported on 19.7% of returns)
Here:
$2,361
State:
$2,570
(% of AGI for various income ranges: 7.1% for AGIs below $25k, 1.3% for AGIs $25k-50k)
Percentage of individuals using paid preparers for their 2012 taxes: 43.5%
Here:
43%
State:
51%
(% for various income ranges: 39.8% for AGIs below $25k, 41.3% for AGIs $25k-50k, 45.1% for AGIs $50k-75k, 46.6% for AGIs $75k-100k, 51.8% for AGIs $100k-200k, 77.6% for AGIs over 200k)
Averages for the 2004 tax year for zip code 78130, filed in 2005:
Average Adjusted Gross Income (AGI) in 2004: $40,126 (Individual Income Tax Returns)
Here:
$40,126
State:
$47,881
Salary/wage: $35,535 (reported on 84.0% of returns)
Here:
$35,535
State:
$41,947
(% of AGI for various income ranges: 130.8% for AGIs below $10k, 79.1% for AGIs $10k-25k, 80.4% for AGIs $25k-50k, 78.6% for AGIs $50k-75k, 77.2% for AGIs $75k-100k, 58.6% for AGIs over 100k)
Taxable interest for individuals: $1,971 (reported on 38.0% of returns)
This zip code:
$1,971
Texas:
$2,255
(% of AGI for various income ranges: 7.2% for AGIs below $10k, 2.3% for AGIs $10k-25k, 1.5% for AGIs $25k-50k, 1.5% for AGIs $50k-75k, 1.4% for AGIs $75k-100k, 2.2% for AGIs over 100k)
Taxable dividends: $2,649 (reported on 19.2% of returns)
Here:
$2,649
State:
$4,261
(% of AGI for various income ranges: 3.3% for AGIs below $10k, 0.9% for AGIs $10k-25k, 0.8% for AGIs $25k-50k, 0.9% for AGIs $50k-75k, 1.0% for AGIs $75k-100k, 2.1% for AGIs over 100k)
Net capital gain/loss: +$6,905 (reported on 16.7% of returns)
Here:
+$6,905
State:
+$16,110
(% of AGI for various income ranges: -2.3% for AGIs below $10k, 0.2% for AGIs $10k-25k, 0.3% for AGIs $25k-50k, 0.9% for AGIs $50k-75k, 1.5% for AGIs $75k-100k, 8.9% for AGIs over 100k)
Profit/loss from business: +$10,072 (reported on 16.1% of returns)
Here:
+$10,072
State:
+$11,013
(% of AGI for various income ranges: 1.1% for AGIs below $10k, 4.5% for AGIs $10k-25k, 3.6% for AGIs $25k-50k, 3.2% for AGIs $50k-75k, 3.7% for AGIs $75k-100k, 5.3% for AGIs over 100k)
IRA payment deduction: $3,141 (reported on 2.4% of returns)
78130:
$3,141
Texas:
$3,120
(% of AGI for various income ranges: 0.2% for AGIs below $10k, 0.1% for AGIs $10k-25k, 0.3% for AGIs $25k-50k, 0.2% for AGIs $50k-75k, 0.2% for AGIs $75k-100k, 0.1% for AGIs over 100k)
Self-employed pension: $12,992 (reported on 0.6% of returns)
Here:
$12,992
Texas:
$16,401
(% of AGI for various income ranges: 0.1% for AGIs $25k-50k, 0.1% for AGIs $50k-75k, 0.2% for AGIs $75k-100k, 0.5% for AGIs over 100k)
Total itemized deductions: $16,427 (22% of AGI, reported on 24.3% of returns)
Here:
$16,427
State:
$19,631
Here:
22.1% of AGI
State:
18.9% of AGI
(% of AGI for various income ranges: 13.6% for AGIs below $10k, 6.3% for AGIs $10k-25k, 8.8% for AGIs $25k-50k, 10.5% for AGIs $50k-75k, 11.9% for AGIs $75k-100k, 10.7% for AGIs over 100k)
Charity contributions deductions: $3,300 (4% of AGI, reported on 19.7% of returns)
Here:
$3,300
State:
$4,753
Here:
4.2% of AGI
State:
4.2% of AGI
(% of AGI for various income ranges: 0.7% for AGIs below $10k, 0.8% for AGIs $10k-25k, 1.1% for AGIs $25k-50k, 1.4% for AGIs $50k-75k, 1.9% for AGIs $75k-100k, 2.5% for AGIs over 100k)
Total tax: $5,886 (reported on 71.9% of returns)
78130:
$5,886
State:
$9,058
(% of AGI for various income ranges: 3.4% for AGIs below $10k, 3.8% for AGIs $10k-25k, 6.5% for AGIs $25k-50k, 8.8% for AGIs $50k-75k, 10.8% for AGIs $75k-100k, 18.7% for AGIs over 100k)
Earned income credit: $1,909 (reported on 18.8% of returns)
Here:
$1,909
State:
$2,024
Percentage of individuals using paid preparers for their 2004 taxes: 52.1%
Here:
52%
State:
57%
(% for various income ranges: 46.2% for AGIs below $10k, 54.7% for AGIs $10k-25k, 53.0% for AGIs $25k-50k, 51.1% for AGIs $50k-75k, 49.3% for AGIs $75k-100k, 63.3% for AGIs over 100k)
Likely homosexual households (counted as self-reported same-sex unmarried-partner households)
Lesbian couples: 0.0% of all households
Gay men: 0.0% of all households
Household received Food Stamps/SNAP in the past 12 months: 1,758 Household did not receive Food Stamps/SNAP in the past 12 months: 34,957
Women who had a birth in the past 12 months: 1,612 (1,420 now married, 210 unmarried) Women who did not have a birth in the past 12 months: 21,575 (10,354 now married, 11,194 unmarried)
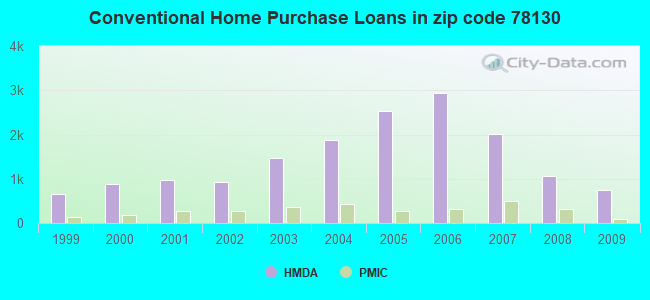
Housing units in zip code 78130 with a mortgage: 14,886 (469 second mortgage, 379 both second mortgage and home equity loan) Houses without a mortgage: 261
Median monthly owner costs for units with a mortgage: $1,799 Median monthly owner costs for units without a mortgage: $649
Residents with income below the poverty level in 2022:
This zip code:
6.4%
Whole state:
14.0%
Residents with income below 50% of the poverty level in 2022:
This zip code:
3.7%
Whole state:
7.4%
Median number of rooms in houses and condos:
Here:
6.2
State:
6.3
Median number of rooms in apartments:
Here:
4.1
State:
4.0
Notable locations in this zip code not listed on our city pages
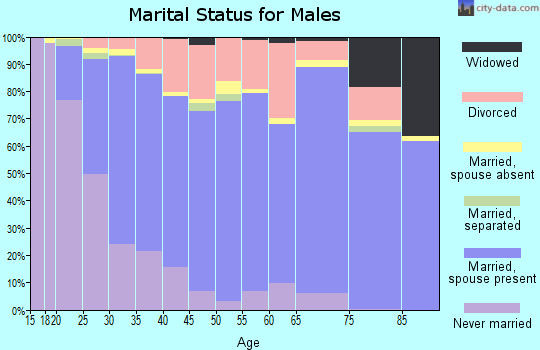
14,834 married couples with children.
4,957 single-parent households (1,703 men, 3,254 women).
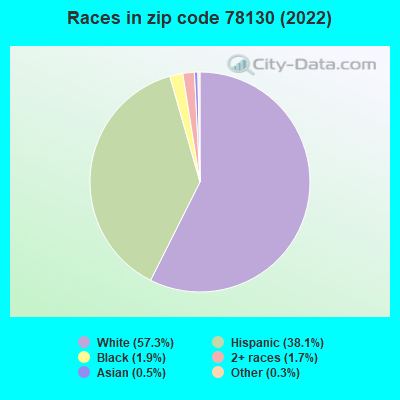
77.4% of residents of 78130 zip code speak English at home.
20.8% of residents speak Spanish at home (74% very well, 12% well, 11% not well, 2% not at all).
1.3% of residents speak other Indo-European language at home (91% very well, 9% well).
0.3% of residents speak Asian or Pacific Island language at home (81% very well, 19% well).
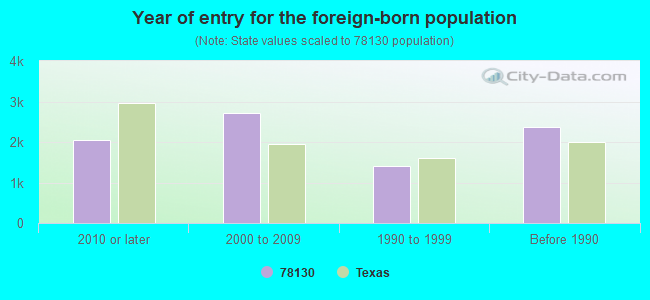
Foreign born population: 6,782 (7.2%) (44.1% of them are naturalized citizens)
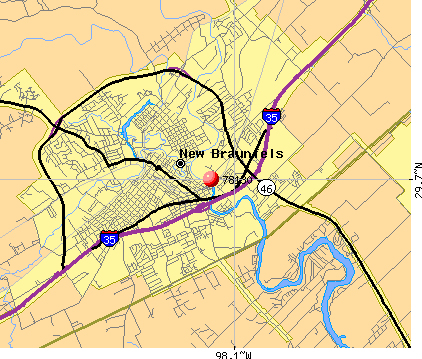
AVION REFINISHING SYSTEMS (MUNICIPAL AIRPORT BLDG 2 in NEW BRAUNFELS, TX)
(Resource Conservation and Recovery Act (tracking hazardous waste))
ABC TRUCK SALES, INC. (IN TOWN OF in NEW BRAUNFELS, TX)
National Pollutant Discharge Elimination System NON-MAJOR (Tracking pollutant discharge elimination systems) - permit
ADM (355 E MILL ST in NEW BRAUNFELS, TX)
(Resource Conservation and Recovery Act (tracking hazardous waste)) Alternative names: ADM TRUCKING
Housing units lacking complete plumbing facilities: 0.8% Housing units lacking complete kitchen facilities: 2.4%
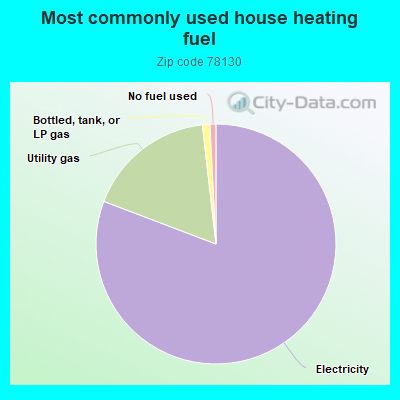
80.7%Electricity
17.4%Utility gas
1.0%Bottled, tank, or LP gas
0.8%No fuel used
Population in 1990: 32,975. Population change in the 1990s: +11,039 (+33.5%).
Place of birth for U.S.-born residents:
This state: 59,146
Northeast: 2,376
Midwest: 6,190
South: 7,392
West: 9,972
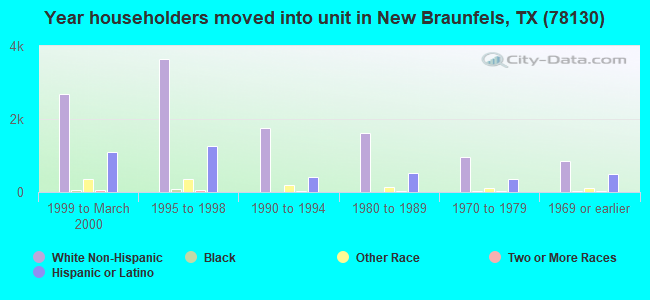
50% of the 78130 zip code residents lived in the same house 5 years ago. Out of people who lived in different houses, 40% lived in this county. Out of people who lived in different counties, 50% lived in Texas.
84% of the 78130 zip code residents lived in the same house 1 year ago. Out of people who lived in different houses, 20% moved from this county. Out of people who lived in different houses, 50% moved from different county within same state. Out of people who lived in different houses, 32% moved from different state. Out of people who lived in different houses, 2% moved from abroad.
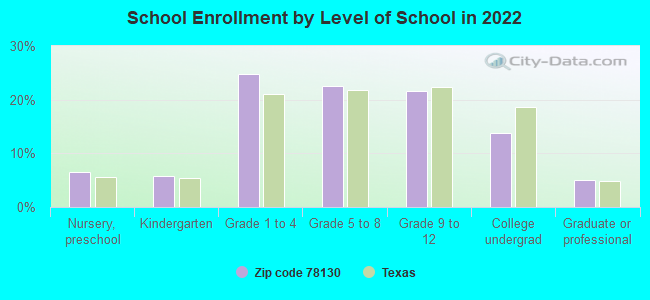
Private vs. public school enrollment:
Students in private schools in grades 1 to 8 (elementary and middle school): 1,061
Here:
10.5%
Texas:
8.8%
Students in private schools in grades 9 to 12 (high school): 819
Here:
17.7%
Texas:
8.0%
Students in private undergraduate colleges: 521
Here:
17.8%
Texas:
16.2%
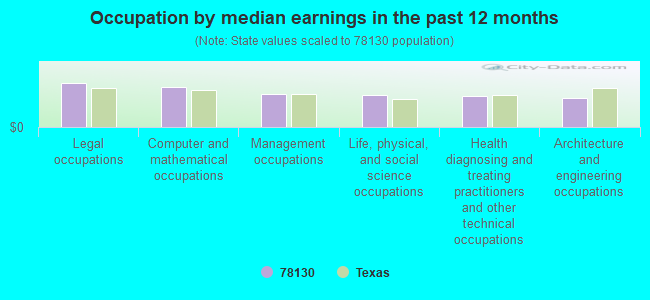
Occupation by median earnings in the past 12 months ($)
106,254Legal occupations
96,791Computer and mathematical occupations
80,666Management occupations
77,679Life, physical, and social science occupations
75,058Health diagnosing and treating practitioners and other technical occupations
69,878Architecture and engineering occupations
Companies with biggest federal contracts located in this zip code (NEW BRAUNFELS, TX):
REFINERY ASSOCIATES OF TEXAS, (256 MERRIWEATHER ST; small business) : $152,444,010 in 3 contractsfrom 1999 to 2006
$124,152,364 with Defense Logistics Agency for Liquid Propellants and Fuels, Petroleum Base. Signed on 2006-03-22. Completion date: 2007-04-30.
$23,283,146 with Defense Logistics Agency for Fuel Oils. Signed on 2006-03-03. Completion date: 2006-04-30.
$5,008,500 with Defense Logistics Agency for Liquid Propellants and Fuels, Petroleum Base. Signed on 1999-12-29. Completion date: 2000-01-30.
MERIDIAN CONTRACTING, INC (1308 EAST COMMON STREET; small business) : $6,567,006 in 87 contractsfrom 2000 to 2003
Contracts for Construction of Structures and Facilities -- Miscellaneous Buildings, Maintenance, Repair or Alteration of Real Property -- Other Industrial Buildings, Construction of Structures and Facilities -- Office Buildings, Maintenance, Repair or Alteration of Real Property -- Miscellaneous Buildings, and moreby Army, Air Force, Public Buildings Service Signed by year:2000: $100,000; 2001: $7,070,608; 2002: -$531,607; 2003: -$71,995; 2004: $0; 2005: $0; 2006: $0.
Biggest contracts:
$3,800,000 with Army for Construction of Structures and Facilities -- Miscellaneous Buildings. Taking place in MO. Signed on 2001-09-26. Completion date: 2002-12-31.
$946,905 with Army for Maintenance, Repair or Alteration of Real Property -- Other Industrial Buildings. Signed on 2001-09-25. Completion date: 2002-04-23.
$316,680, same as above.Signed on 2001-08-09. Completion date: 2001-12-28.
$302,660 with Army for Construction of Structures and Facilities -- Office Buildings. Taking place in MO. Signed on 2001-09-30. Completion date: 2002-10-04.
HEALTHCARE TECHNOLOGY SOLUTION (1323 MARYS COVE; small business) : $2,657,921 in 8 contractsfrom 2001 to 2004
Contracts for Technical Assistance, ADPE System Configuration, Other Professional Services by Department of Veterans Affairs, Navy Signed by year:2000: $0; 2001: $469,000; 2002: $562,000; 2003: $1,529,032; 2004: $97,889; 2005: $0; 2006: $0.
Biggest contracts:
$717,337 with Department of Veterans Affairs for Technical Assistance. Taking place in PA. Signed on 2003-09-15. Completion date: 2006-03-15.
$717,337, same as above.Signed on 2003-09-15. Completion date: 2006-03-15.
$562,000, same as above.Signed on 2002-09-15. Completion date: 2006-03-15.
$206,000, same as above.Signed on 2001-12-15. Completion date: 2006-03-15.
EDWARD CAVANAUGH, DBA AVIAM SE (1308 COMMON ST STE 205; small business) : $1,728,000 in 3 contractsfrom 2005 to 2006
$864,000 with Army for Lease or Rental of Facilities -- Troop Housing Facilities. Taking place in AR. Signed on 2005-11-10. Completion date: 2006-05-15.
$864,000, same as above.Signed on 2006-04-26. Completion date: 2006-05-15.
$0, same as above.Signed on 2005-11-22. Effective on 2005-11-21. Completion date: 2006-05-15.
HIGH SIERRA TOILET COMPANY, IN (7 MOSS ROCK DR; small business) : $1,367,904 in 79 contractsfrom 2000 to 2006
Contracts for Maintenance, Repair and Rebuilding of Equipment -- Miscellaneous, Waste Treatment and Storage, Other Housekeeping Services, Maintenance, Repair or Alteration of Real Property -- Restoration of real property, and moreby Air Force, Army Signed by year:2000: $62,700; 2001: $0; 2002: $369,007; 2003: $214,310; 2004: $320,717; 2005: $398,067; 2006: $3,103.
Biggest contracts:
$112,552 with Air Force for Maintenance, Repair and Rebuilding of Equipment -- Miscellaneous. Signed on 2002-10-01. Completion date: 2003-09-30.
$110,082, same as above.Signed on 2003-10-01. Completion date: 2004-09-30.
$110,082, same as above.Signed on 2004-10-01. Completion date: 2005-09-30.
$107,532 with Army for Waste Treatment and Storage. Signed on 2004-02-12. Completion date: 2006-09-30.
SENIOR FLEXONICS INC (DEL) (2400 LONGHORN INDUSTRIAL D) : $1,264,306 in 23 contractsfrom 1999 to 2006
Contracts for Maintenance, Repair and Rebuilding of Equipment -- Pipe, Tubing, Hose, and Fittings, Belting, Drive Belts, Fan Belts, and Accessories, Hose, Pipe, Tube, Lubrication, and Railing Fittings, Structural Shapes, and moreby Tennessee Valley Authority, Navy, Air Force, Defense Logistics Agency, and others Signed by year:2000: $743,133; 2001: $95,664; 2002: -$55,440; 2003: $81,621; 2004: $27,404; 2005: $39,426; 2006: $54,623.
Biggest contracts:
$271,000 with Tennessee Valley Authority for Maintenance, Repair and Rebuilding of Equipment -- Pipe, Tubing, Hose, and Fittings. Taking place in TN. Signed on 2000-06-15. Completion date: 2000-11-15.
$214,875 with Navy for Belting, Drive Belts, Fan Belts, and Accessories. Signed on 1999-11-17. Completion date: 2000-08-18.
$130,340, same as above.Signed on 2000-03-16. Completion date: 2001-01-21.
$96,060 with Navy for Hose, Pipe, Tube, Lubrication, and Railing Fittings. Signed on 2000-09-02. Completion date: 2001-06-12.
TEAM HOUSING SOLUTIONS, INC (339 MAIN PLAZA; small business) : $516,625 in 13 contractsfrom 2002 to 2004
Contracts for Lease or Rental of Facilities -- Other Residential Buildings, Lease or Rental of Facilities -- Troop Housing Facilities, Miscellaneous Items, Lodging - Hotel/Motel by Army, Air Force, Navy Signed by year:2000: $0; 2001: $0; 2002: $0; 2003: $394,950; 2004: $121,675; 2005: $0; 2006: $0.
Biggest contracts:
$171,000 with Army for Lease or Rental of Facilities -- Other Residential Buildings. Signed on 2003-02-28. Completion date: 2003-03-07.
$118,800 with Army for Lease or Rental of Facilities -- Troop Housing Facilities. Signed on 2004-02-18. Completion date: 2005-01-31.
$99,000 with Army for Miscellaneous Items. Signed on 2003-03-26. Completion date: 2003-10-31.
$80,850 with Army for Lease or Rental of Facilities -- Troop Housing Facilities. Taking place in MS. Signed on 2003-03-10. Completion date: 2004-02-11.
KBEE SOLUTIONS INC (224 LONG CREEK BLVD; small business) : $271,763 in 2 contractsfrom 2004 to 2005
$163,582 with Air Force for Environmental Studies and Assessments. Signed on 2004-09-30. Completion date: 2005-09-29.
$108,181, same as above.Signed on 2005-06-01. Completion date: 2005-09-29.
FLOATING DOCK SUPPLY, INC (931 WOOD MDWS; small business) : $180,071 in 5 contractsin 2005
Contracts for Floating Drydocks by Army, U.S. Army Corps of Engineers - civil program financing only Signed by year:2000: $0; 2001: $0; 2002: $0; 2003: $0; 2004: $0; 2005: $180,071; 2006: $0.
Biggest contracts:
$167,441 with Army for Floating Drydocks. Signed on 2005-02-15. Completion date: 2005-04-29.
$4,015, same as above.Signed on 2005-07-15. Completion date: 2005-07-29.
$4,015 with U.S. Army Corps of Engineers - civil program financing only for Floating Drydocks. Signed on 2005-07-15. Completion date: 2005-07-29.
$2,300, same as above.Signed on 2005-06-09. Completion date: 2005-06-30.
COMAL, COUNTY OF (150 N SEGUIN AVE STE 201) : $113,228 in 3 contractsfrom 2005 to 2006
$45,696 with Army for Other Professional Services. Signed on 2006-04-04. Completion date: 2006-09-04.
$33,766 with U.S. Army Corps of Engineers - civil program financing only for Other Professional Services. Signed on 2005-03-16. Completion date: 2005-03-25.
$33,766 with Army for Other Professional Services. Signed on 2005-03-16. Completion date: 2005-03-25.
Top industries in this zip code by the number of employees in 2005:
2002 - 2018 National Fire Incident Reporting System (NFIRS) incidents
According to the data from the years 2002 - 2018 the average number of fire incidents per year is 254. The highest number of fire incidents - 371 took place in 2008, and the least - 155 in 2018. The data has a dropping trend.
When looking into fire subcategories, the most incidents belonged to: Outside Fires (52.1%), and Structure Fires (26.4%).
Fire incident types reported to NFIRS in Zip Code 78130

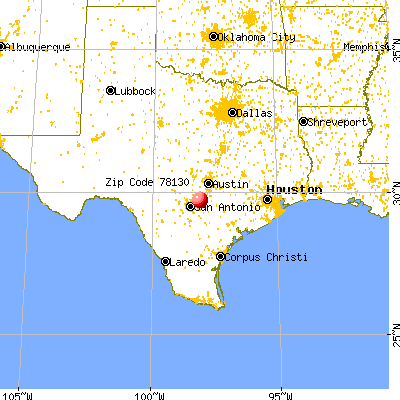


 Nearest zip codes: 78123, 78132, 78124, 78108, 78155, 78666.
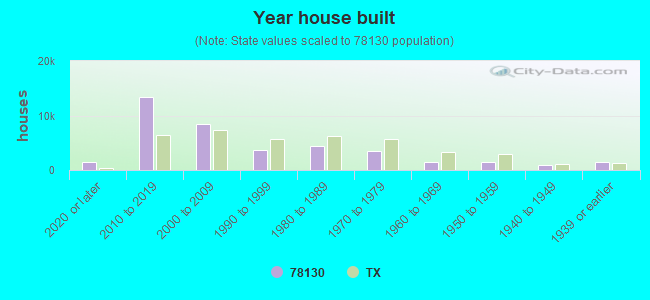


 According to the data from the years 2002 - 2018 the average number of fire incidents per year is 254. The highest number of fire incidents - 371 took place in 2008, and the least - 155 in 2018. The data has a dropping trend.
 When looking into fire subcategories, the most incidents belonged to: Outside Fires (52.1%), and Structure Fires (26.4%).