Estimated zip code population in 2022: 88,856 Zip code population in 2010: 63,836 Zip code population in 2000: 51,452
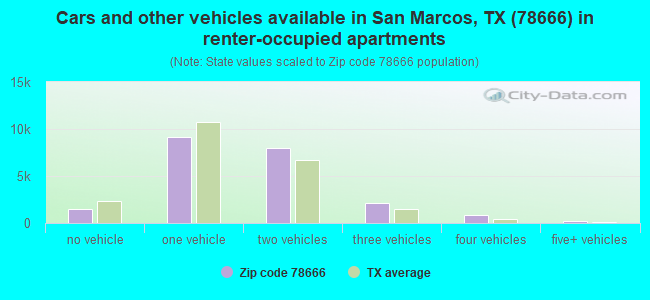
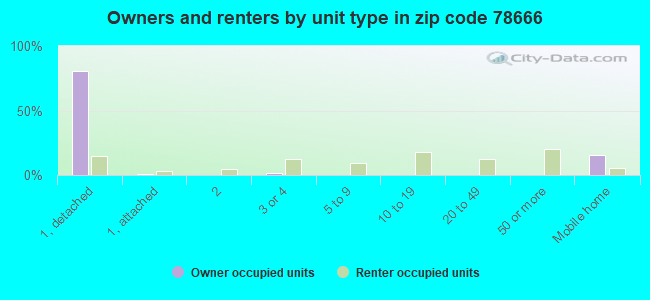
Houses and condos: 37,403 Renter-occupied apartments: 21,911
% of renters here:
63%
State:
38%
March 2022 cost of living index in zip code 78666: 93.9 (less than average, U.S. average is 100)
Land area: 176.6 sq. mi. Water area: 0.9 sq. mi.
Population density: 503 people per square mile
(low).
OSM Map
General Map
Google Map
MSN Map
OSM Map
General Map
Google Map
MSN Map
OSM Map
General Map
Google Map
MSN Map
OSM Map
General Map
Google Map
MSN Map
Please wait while loading the map...
Real estate property taxes paid for housing units in 2022:
This zip code:
1.4% ($3,966)
Texas:
1.5% ($4,050)
Median real estate property taxes paid for housing units with mortgages in 2022: $4,481 (1.5%) Median real estate property taxes paid for housing units with no mortgage in 2022: $3,204 (1.2%)
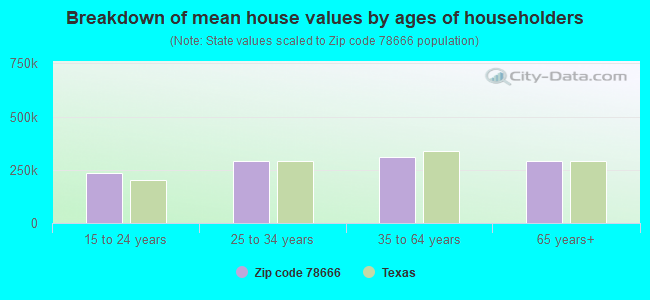
Estimated median house/condo value in 2022: $287,781
78666:
$287,781
Texas:
$275,400
According to our research of Texas and other state lists, there were 136 registered sex offenders living in 78666 zip code as of April 27, 2024. The ratio of all residents to sex offenders in zip code 78666 is 567 to 1. The ratio of registered sex offenders to all residents in this zip code is lower than the state average.
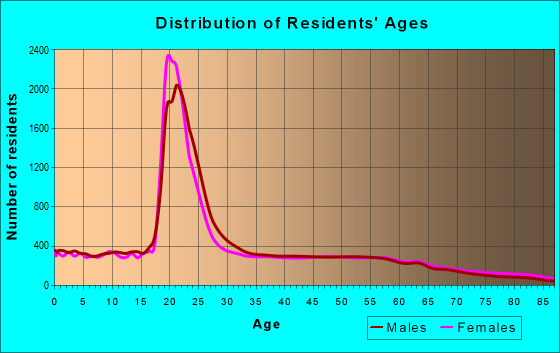
Median resident age:
This zip code:
26.8 years
Texas median age:
35.6 years
Average household size:
This zip code:
2.3 people
Texas:
2.6 people
Averages for the 2020 tax year for zip code 78666, filed in 2021:
Average Adjusted Gross Income (AGI) in 2020: $51,008 (Individual Income Tax Returns)
Here:
$51,008
State:
$77,054
Salary/wage: $40,804 (reported on 86.2% of returns)
Here:
$40,804
State:
$62,766
(% of AGI for various income ranges: 1171.1% for AGIs below $25k, 3612.8% for AGIs $25k-50k, 6528.3% for AGIs $50k-75k, 9382.7% for AGIs $75k-100k, 17103.2% for AGIs $100k-200k, 69372.5% for AGIs over 200k)
Taxable interest for individuals: $1,601 (reported on 19.2% of returns)
This zip code:
$1,601
Texas:
$2,665
(% of AGI for various income ranges: 6.0% for AGIs below $25k, 8.7% for AGIs $25k-50k, 31.0% for AGIs $50k-75k, 57.2% for AGIs $75k-100k, 141.2% for AGIs $100k-200k, 2155.0% for AGIs over 200k)
Ordinary dividends: $7,706 (reported on 11.1% of returns)
Here:
$7,706
State:
$10,044
(% of AGI for various income ranges: 10.1% for AGIs below $25k, 18.9% for AGIs $25k-50k, 69.4% for AGIs $50k-75k, 155.8% for AGIs $75k-100k, 393.1% for AGIs $100k-200k, 6737.5% for AGIs over 200k)
Net capital gain/loss in AGI: +$19,711 (reported on 11.1% of returns)
Here:
+$19,711
State:
+$39,590
(% of AGI for various income ranges: 7.6% for AGIs below $25k, 19.6% for AGIs $25k-50k, 74.2% for AGIs $50k-75k, 146.9% for AGIs $75k-100k, 770.6% for AGIs $100k-200k, 23612.9% for AGIs over 200k)
Profit/loss from business: +$11,917 (reported on 15.3% of returns)
Here:
+$11,917
State:
+$10,888
(% of AGI for various income ranges: 95.5% for AGIs below $25k, 127.5% for AGIs $25k-50k, 262.2% for AGIs $50k-75k, 370.1% for AGIs $75k-100k, 697.8% for AGIs $100k-200k, 6943.8% for AGIs over 200k)
Taxable individual retirement arrangement distribution: $24,029 (reported on 5.2% of returns)
78666:
$24,029
Texas:
$24,740
(% of AGI for various income ranges: 17.1% for AGIs below $25k, 35.7% for AGIs $25k-50k, 136.4% for AGIs $50k-75k, 354.3% for AGIs $75k-100k, 930.6% for AGIs $100k-200k, 5932.1% for AGIs over 200k)
Self-employed (Keogh) retirement plans: $18,033 (reported on 0.2% of returns)
78666:
$18,033
Texas:
$29,298
(% of AGI for various income ranges: 13.4% for AGIs $50k-75k, 283.3% for AGIs over 200k)
Total itemized deductions: $35,225 (reported on 4.4% of returns)
Here:
$35,225
State:
$40,428
(% of AGI for various income ranges: 19.6% for AGIs below $25k, 65.8% for AGIs $25k-50k, 231.3% for AGIs $50k-75k, 395.7% for AGIs $75k-100k, 759.4% for AGIs $100k-200k, 8839.6% for AGIs over 200k)
Charity contributions: $12,350 (reported on 3.4% of returns)
Here:
$12,350
State:
$18,201
(% of AGI for various income ranges: 1.7% for AGIs below $25k, 10.8% for AGIs $25k-50k, 37.4% for AGIs $50k-75k, 81.8% for AGIs $75k-100k, 206.5% for AGIs $100k-200k, 3189.2% for AGIs over 200k)
Taxes paid: $7,251 (reported on 4.3% of returns)
78666:
$7,251
State:
$7,821
(% of AGI for various income ranges: 3.4% for AGIs below $25k, 13.6% for AGIs $25k-50k, 53.7% for AGIs $50k-75k, 100.9% for AGIs $75k-100k, 193.4% for AGIs $100k-200k, 1250.4% for AGIs over 200k)
Earned income credit: $2,171 (reported on 17.4% of returns)
Here:
$2,171
State:
$2,584
(% of AGI for various income ranges: 67.6% for AGIs below $25k, 59.5% for AGIs $25k-50k, 1.4% for AGIs $50k-75k)
Percentage of individuals using paid preparers for their 2020 taxes: 93.6%
Here:
94%
State:
92%
(% for various income ranges: 94.0% for AGIs below $25k, 94.2% for AGIs $25k-50k, 92.4% for AGIs $50k-75k, 92.5% for AGIs $75k-100k, 91.6% for AGIs $100k-200k, 93.3% for AGIs over 200k)
Averages for the 2012 tax year for zip code 78666, filed in 2013:
Average Adjusted Gross Income (AGI) in 2012: $38,859 (Individual Income Tax Returns)
Here:
$38,859
State:
$65,384
Salary/wage: $31,752 (reported on 88.8% of returns)
Here:
$31,752
State:
$52,524
(% of AGI for various income ranges: 87.3% for AGIs below $25k, 86.1% for AGIs $25k-50k, 78.4% for AGIs $50k-75k, 72.9% for AGIs $75k-100k, 70.7% for AGIs $100k-200k, 34.5% for AGIs over 200k)
Taxable interest for individuals: $1,452 (reported on 19.4% of returns)
This zip code:
$1,452
Texas:
$2,372
(% of AGI for various income ranges: 0.4% for AGIs below $25k, 0.3% for AGIs $25k-50k, 0.5% for AGIs $50k-75k, 0.7% for AGIs $75k-100k, 0.7% for AGIs $100k-200k, 1.8% for AGIs over 200k)
Ordinary dividends: $6,535 (reported on 10.6% of returns)
Here:
$6,535
State:
$9,721
(% of AGI for various income ranges: 0.7% for AGIs below $25k, 0.6% for AGIs $25k-50k, 1.0% for AGIs $50k-75k, 1.2% for AGIs $75k-100k, 1.7% for AGIs $100k-200k, 5.9% for AGIs over 200k)
Net capital gain/loss in AGI: +$15,637 (reported on 8.5% of returns)
Here:
+$15,637
State:
+$35,319
(% of AGI for various income ranges: 0.2% for AGIs below $25k, 0.5% for AGIs $50k-75k, 0.9% for AGIs $75k-100k, 2.1% for AGIs $100k-200k, 17.8% for AGIs over 200k)
Profit/loss from business: +$13,665 (reported on 13.4% of returns)
Here:
+$13,665
State:
+$13,732
(% of AGI for various income ranges: 5.8% for AGIs below $25k, 2.9% for AGIs $25k-50k, 4.3% for AGIs $50k-75k, 4.4% for AGIs $75k-100k, 5.4% for AGIs $100k-200k, 5.8% for AGIs over 200k)
Taxable individual retirement arrangement distribution: $14,478 (reported on 5.4% of returns)
78666:
$14,478
Texas:
$19,511
(% of AGI for various income ranges: 1.1% for AGIs below $25k, 1.2% for AGIs $25k-50k, 1.9% for AGIs $50k-75k, 2.9% for AGIs $75k-100k, 3.2% for AGIs $100k-200k, 2.0% for AGIs over 200k)
Self-employment retirement plans: $12,857 (reported on 0.3% of returns)
78666:
$12,857
Texas:
$23,938
Total itemized deductions: $20,474 (20% of AGI, reported on 14.3% of returns)
Here:
$20,474
State:
$24,724
Here:
19.6% of AGI
State:
15.9% of AGI
(% of AGI for various income ranges: 3.3% for AGIs below $25k, 5.6% for AGIs $25k-50k, 8.1% for AGIs $50k-75k, 10.1% for AGIs $75k-100k, 9.9% for AGIs $100k-200k, 9.4% for AGIs over 200k)
Charity contributions: $6,084 (reported on 10.7% of returns)
Here:
$6,084
State:
$6,808
(% of AGI for various income ranges: 0.3% for AGIs below $25k, 0.6% for AGIs $25k-50k, 1.0% for AGIs $50k-75k, 1.8% for AGIs $75k-100k, 2.1% for AGIs $100k-200k, 4.7% for AGIs over 200k)
Taxes paid: $5,527 (reported on 14.0% of returns)
78666:
$5,527
State:
$6,921
(% of AGI for various income ranges: 0.6% for AGIs below $25k, 1.3% for AGIs $25k-50k, 2.2% for AGIs $50k-75k, 2.8% for AGIs $75k-100k, 3.2% for AGIs $100k-200k, 2.2% for AGIs over 200k)
Earned income credit: $2,228 (reported on 22.1% of returns)
Here:
$2,228
State:
$2,570
(% of AGI for various income ranges: 5.9% for AGIs below $25k, 1.3% for AGIs $25k-50k)
Percentage of individuals using paid preparers for their 2012 taxes: 37.4%
Here:
37%
State:
51%
(% for various income ranges: 32.5% for AGIs below $25k, 39.3% for AGIs $25k-50k, 41.5% for AGIs $50k-75k, 46.2% for AGIs $75k-100k, 50.0% for AGIs $100k-200k, 77.8% for AGIs over 200k)
Averages for the 2004 tax year for zip code 78666, filed in 2005:
Average Adjusted Gross Income (AGI) in 2004: $32,947 (Individual Income Tax Returns)
Here:
$32,947
State:
$47,881
Salary/wage: $27,994 (reported on 89.1% of returns)
Here:
$27,994
State:
$41,947
(% of AGI for various income ranges: 110.4% for AGIs below $10k, 87.2% for AGIs $10k-25k, 87.3% for AGIs $25k-50k, 81.0% for AGIs $50k-75k, 76.1% for AGIs $75k-100k, 51.0% for AGIs over 100k)
Taxable interest for individuals: $1,743 (reported on 26.1% of returns)
This zip code:
$1,743
Texas:
$2,255
(% of AGI for various income ranges: 2.5% for AGIs below $10k, 0.9% for AGIs $10k-25k, 0.8% for AGIs $25k-50k, 0.9% for AGIs $50k-75k, 1.2% for AGIs $75k-100k, 2.3% for AGIs over 100k)
Taxable dividends: $3,158 (reported on 13.1% of returns)
Here:
$3,158
State:
$4,261
(% of AGI for various income ranges: 2.1% for AGIs below $10k, 0.5% for AGIs $10k-25k, 0.5% for AGIs $25k-50k, 0.8% for AGIs $50k-75k, 1.1% for AGIs $75k-100k, 2.5% for AGIs over 100k)
Net capital gain/loss: +$9,929 (reported on 11.5% of returns)
Here:
+$9,929
State:
+$16,110
(% of AGI for various income ranges: -0.2% for AGIs below $10k, 0.4% for AGIs $10k-25k, 0.4% for AGIs $25k-50k, 0.6% for AGIs $50k-75k, 1.9% for AGIs $75k-100k, 10.8% for AGIs over 100k)
Profit/loss from business: +$11,172 (reported on 13.7% of returns)
Here:
+$11,172
State:
+$11,013
(% of AGI for various income ranges: 6.5% for AGIs below $10k, 4.6% for AGIs $10k-25k, 3.3% for AGIs $25k-50k, 3.0% for AGIs $50k-75k, 3.0% for AGIs $75k-100k, 7.3% for AGIs over 100k)
IRA payment deduction: $3,015 (reported on 1.7% of returns)
78666:
$3,015
Texas:
$3,120
(% of AGI for various income ranges: 0.1% for AGIs below $10k, 0.1% for AGIs $10k-25k, 0.2% for AGIs $25k-50k, 0.2% for AGIs $50k-75k, 0.2% for AGIs $75k-100k, 0.1% for AGIs over 100k)
Self-employed pension: $12,133 (reported on 0.5% of returns)
Here:
$12,133
Texas:
$16,401
(% of AGI for various income ranges: 0.1% for AGIs $25k-50k, 0.1% for AGIs $50k-75k, 0.1% for AGIs $75k-100k, 0.5% for AGIs over 100k)
Total itemized deductions: $17,082 (21% of AGI, reported on 17.0% of returns)
Here:
$17,082
State:
$19,631
Here:
21.5% of AGI
State:
18.9% of AGI
(% of AGI for various income ranges: 4.8% for AGIs below $10k, 4.0% for AGIs $10k-25k, 7.5% for AGIs $25k-50k, 10.5% for AGIs $50k-75k, 12.6% for AGIs $75k-100k, 10.6% for AGIs over 100k)
Charity contributions deductions: $4,890 (6% of AGI, reported on 13.2% of returns)
Here:
$4,890
State:
$4,753
Here:
5.5% of AGI
State:
4.2% of AGI
(% of AGI for various income ranges: 0.2% for AGIs below $10k, 0.4% for AGIs $10k-25k, 0.8% for AGIs $25k-50k, 1.5% for AGIs $50k-75k, 2.3% for AGIs $75k-100k, 4.2% for AGIs over 100k)
Total tax: $5,158 (reported on 66.5% of returns)
78666:
$5,158
State:
$9,058
(% of AGI for various income ranges: 2.6% for AGIs below $10k, 3.8% for AGIs $10k-25k, 6.8% for AGIs $25k-50k, 9.1% for AGIs $50k-75k, 10.8% for AGIs $75k-100k, 19.0% for AGIs over 100k)
Earned income credit: $1,809 (reported on 22.3% of returns)
Here:
$1,809
State:
$2,024
Percentage of individuals using paid preparers for their 2004 taxes: 46.6%
Here:
47%
State:
57%
(% for various income ranges: 38.3% for AGIs below $10k, 50.4% for AGIs $10k-25k, 48.0% for AGIs $25k-50k, 48.0% for AGIs $50k-75k, 45.8% for AGIs $75k-100k, 61.8% for AGIs over 100k)
Likely homosexual households (counted as self-reported same-sex unmarried-partner households)
Lesbian couples: 0.2% of all households
Gay men: 0.1% of all households
Household received Food Stamps/SNAP in the past 12 months: 2,947 Household did not receive Food Stamps/SNAP in the past 12 months: 32,052
Women who had a birth in the past 12 months: 745 (314 now married, 419 unmarried) Women who did not have a birth in the past 12 months: 28,919 (7,279 now married, 21,812 unmarried)
Housing units in zip code 78666 with a mortgage: 7,629 (348 second mortgage, 312 both second mortgage and home equity loan) Houses without a mortgage: 128
Median monthly owner costs for units with a mortgage: $1,691 Median monthly owner costs for units without a mortgage: $618
Residents with income below the poverty level in 2022:
This zip code:
24.7%
Whole state:
14.0%
Residents with income below 50% of the poverty level in 2022:
This zip code:
9.9%
Whole state:
7.4%
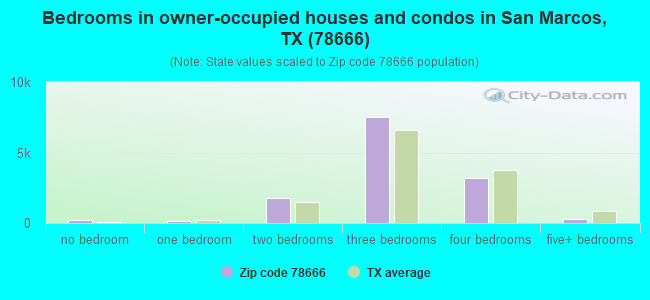
Median number of rooms in houses and condos:
Here:
5.7
State:
6.3
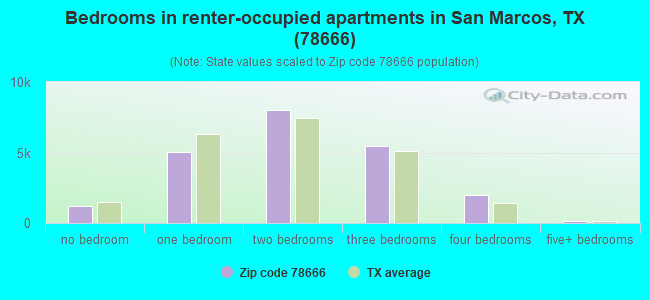
Median number of rooms in apartments:
Here:
4.0
State:
4.0
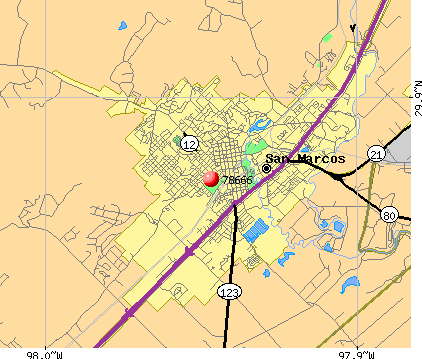
Notable locations in this zip code not listed on our city pages
Notable locations in zip code 78666: Centerpoint (A), Wood State Fish Hatchery (B), Prime Outlets at San Marcos (C), B Bar Ranch (D), Cowan Ranch (E), Freeman Ranch (F), Belvin Street Historic District (G), Hays County Courthouse Historic District (H), Belger-Cahill Lime Kiln (I), Marton Ranch (J), Scrutchin Ranch (K), Williams Ranch (L), Episcopalian Rectory (M), Farmers Union Gin Company (N), Fisher Hall (O), South Hays Fire Department Company 1 (P), Green and Faris Buildings (Q), Goforth-Harris House (R), Heard House (S), Hays County Jail (T). Display/hide their locations on the map
Churches in zip code 78666 include: First United Methodist Church (A), Fort Street Presbyterian Church (B), Cemetery Chapel (C), Seventh Day Adventist Church (D), Community Baptist Church (E), Wesley Chapel African Methodist Episcopal Church (F), First Presbyterian Church (G), Pentecostal Temple Church of God in Christ (H), First United Pentecostal Church (I). Display/hide their locations on the map
Cemeteries: Crayton Cemetery (1), Memory Lawn Memorial Park (2), Guadalupe Cemetery (3), York Creek Cemetery (4), Hugo Cemetery (5), Redwood Cemetery (6), Garden of the Cross Cemetery (7). Display/hide their locations on the map
Reservoirs: Spring Lake (A), Soil Conservation Service Site 10 Reservoir (B), Soil Conservation Service Site 7 Reservoir (C), Webster Lake (D), Scrutchin Lake (E), John F Baugh Reservoir (F), Soil Conservation Service Site 5 Reservoir (G), Soil Conservation Service Site 14 Reservoir (H). Display/hide their locations on the map
Rivers and creeks: Blanco River (A), Sycamore Creek (B), Willow Springs Creek (C), Sink Creek (D), Purgatory Creek (E), Caney Creek (F). Display/hide their locations on the map
Parks in zip code 78666 include: John Stokes Park (1), San Marcos City Park (2), Rio Vista Park (3), Ramon Lucio Memorial Park (4), Bobcat Soccer Complex (5), Redwood Arena (6), Baptist Academy San Marocs Football Field (7), Bobcat Baseball Field (8), Bobcat Softball Field (9). Display/hide their locations on the map
6,245 married couples with children.
4,120 single-parent households (1,055 men, 3,065 women).
70.9% of residents of 78666 zip code speak English at home.
25.3% of residents speak Spanish at home (83% very well, 8% well, 6% not well, 2% not at all).
2.4% of residents speak other Indo-European language at home (72% very well, 20% well, 8% not well, 1% not at all).
1.1% of residents speak Asian or Pacific Island language at home (74% very well, 22% well, 2% not well, 2% not at all).
0.4% of residents speak other language at home (80% very well, 20% well).
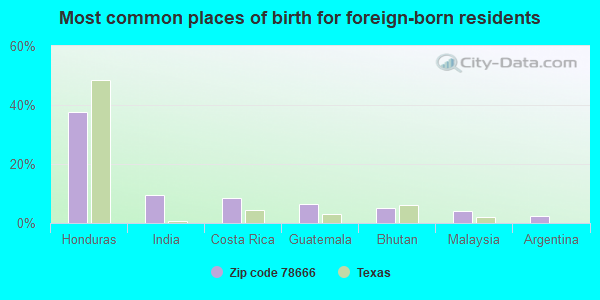
Foreign born population: 7,288 (8.2%) (33.2% of them are naturalized citizens)
Facilities with environmental interests located in this zip code:
AAMCO TRANSMISSIONS (1206 HWY 123 in SAN MARCOS, TX)
(Resource Conservation and Recovery Act (tracking hazardous waste)) Business NAICS classification: ALL OTHER AUTOMOTIVE REPAIR AND MAINTENANCE.
ABBOTT (1510 S I H 35 in SAN MARCOS, TX)
(Resource Conservation and Recovery Act (tracking hazardous waste)) Alternative names: ABBOT CPO
ADMIRAL LINEN & UNIFORM SERVICE INC (209 N EDWARD GRAY ST in SAN MARCOS, TX)
(Resource Conservation and Recovery Act (tracking hazardous waste)) Alternative names: SUNSHINE LAUNDRY AND CLEANERS
A E WOOD FISH HATCHERY (507 STAPLES RD in SAN MARCOS, TX)
National Pollutant Discharge Elimination System NON-MAJOR (Tracking pollutant discharge elimination systems) - permit Business SIC classification: FISH HATCHERIES AND PRESERVES Organizations: TEXAS PARKS & WILDLIFE DEPT (CONTACT/OWNER)
Alternative names: TEXAS PARKS AND WILDLIFE DEPT
AIR BASE REFURBISHMENT (1807 AIRPORT DRIVE in SAN MARCOS, TX)
(Resource Conservation and Recovery Act (tracking hazardous waste))
ATP BUILDING (749 NORTH COMANCHE in SAN MARCOS, TX)
National Pollutant Discharge Elimination System NON-MAJOR (Tracking pollutant discharge elimination systems) - permit Alternative names: SPAWGLASS CONSTRUCTORS, INC.
Housing units lacking complete plumbing facilities: 0.2% Housing units lacking complete kitchen facilities: 0.8%
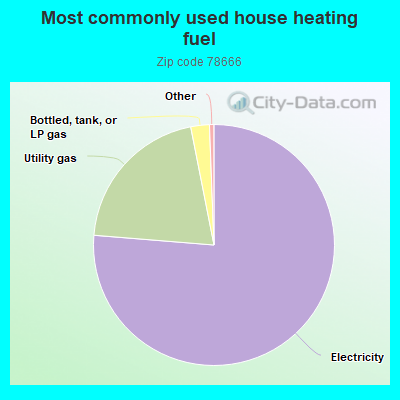
76.3%Electricity
20.6%Utility gas
2.5%Bottled, tank, or LP gas
Population in 1990: 39,087. Population change in the 1990s: +12,365 (+31.6%).
Place of birth for U.S.-born residents:
This state: 61,576
Northeast: 2,552
Midwest: 4,985
South: 5,491
West: 5,594
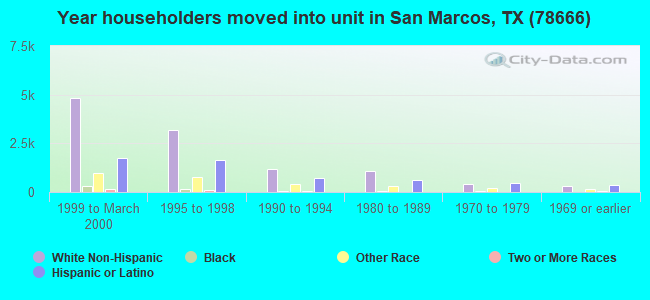
37% of the 78666 zip code residents lived in the same house 5 years ago. Out of people who lived in different houses, 29% lived in this county. Out of people who lived in different counties, 50% lived in Texas.
82% of the 78666 zip code residents lived in the same house 1 year ago. Out of people who lived in different houses, 45% moved from this county. Out of people who lived in different houses, 43% moved from different county within same state. Out of people who lived in different houses, 8% moved from different state. Out of people who lived in different houses, 2% moved from abroad.
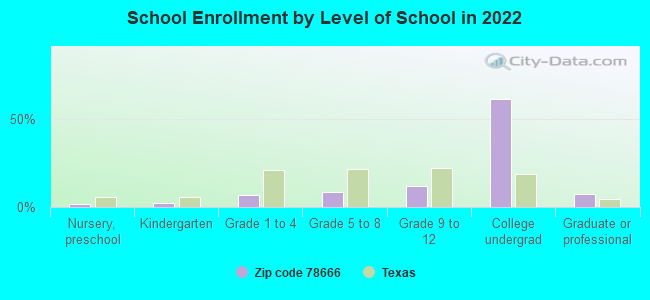
Private vs. public school enrollment:
Students in private schools in grades 1 to 8 (elementary and middle school): 254
Here:
5.1%
Texas:
8.8%
Students in private schools in grades 9 to 12 (high school): 505
Here:
12.8%
Texas:
8.0%
Students in private undergraduate colleges: 1,645
Here:
8.1%
Texas:
16.2%
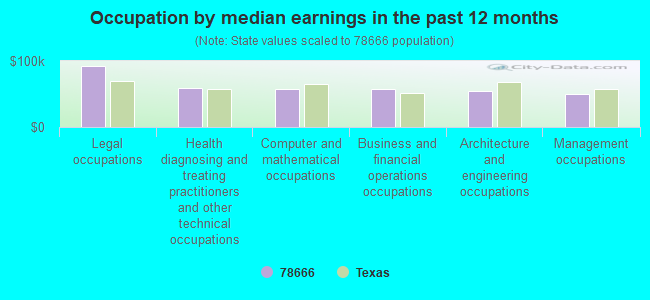
Occupation by median earnings in the past 12 months ($)
92,168Legal occupations
58,712Health diagnosing and treating practitioners and other technical occupations
58,295Computer and mathematical occupations
57,181Business and financial operations occupations
53,858Architecture and engineering occupations
50,523Management occupations
Companies with biggest federal contracts located in this zip code (SAN MARCOS, TX):
BERRY AVIATION, INC (1807 AIRPORT DRIVE; small business) : $24,300,378 in 75 contractsfrom 1999 to 2006
Contracts for Air Charter for Things, Other Professional Services, Passenger Air Charter Service, Liquid Propellants and Fuels, Petroleum Base by Air Force, Navy, Defense Logistics Agency Signed by year:2000: $3,203,138; 2001: $2,986,692; 2002: $3,948,039; 2003: $3,456,840; 2004: $3,351,431; 2005: $4,465,504; 2006: $866,372.
Biggest contracts:
$3,214,217 with Air Force for Air Charter for Things. Signed on 2005-10-01. Completion date: 2008-09-30.
$3,214,216, same as above.Signed on 2004-10-04. Completion date: 2008-09-30.
$3,161,522, same as above.Signed on 2002-10-01. Completion date: 2003-09-30.
$3,161,522, same as above.Signed on 2003-10-01. Completion date: 2003-09-30.
TEXAS STATE UNIVERSITY-SAN MAR (601 UNIVERSITY DR) : $866,630 in 14 contractsfrom 2000 to 2006
Contracts for Tuition, Registration, and Membership Fees, Aeronautics and Space Technology -- Basic Research (R&D), Defense Missile and Space Systems -- Applied Research and Exploratory Development (R&D), Education Services, and moreby Air Force, NASA, Army, National Labor Relations Board, and others Signed by year:2000: $52,246; 2001: $125,235; 2002: $183,896; 2003: $197,973; 2004: $257,280; 2005: $0; 2006: $50,000.
Biggest contracts:
$197,973 with Air Force for Tuition, Registration, and Membership Fees. Signed on 2003-09-12. Completion date: 2003-09-30.
$113,379 with NASA for Aeronautics and Space Technology -- Basic Research (R&D). Signed on 2004-03-12. Effective on 2004-05-13. Completion date: 2005-05-12.
$95,616 with Air Force for Tuition, Registration, and Membership Fees. Signed on 2002-07-22. Completion date: 2002-03-13.
$88,280, same as above.Signed on 2002-03-01. Completion date: 2002-09-30.
JEWELL TRIGGERS INC (3620 HIGHWAY 123; small business)
$44,886 with Navy for Miscellaneous Weapons. Taking place in VA. Signed on 2001-04-06. Completion date: 2001-05-07.
J J STOKES CO USA LC (1122 SEGUIN HWY; small business) 18 employees, $4942073 revenue. Woman Owned Business: $43,000 in 3 contractsfrom 1999 to 2000
$39,000 with U.S. Fish and Wildlife Service for Construction of Structures and Facilities -- Miscellaneous Buildings. Signed on 2000-05-15. Completion date: 2000-05-15.
$3,000, same as above.Signed on 1999-11-15. Completion date: 1999-12-15.
$1,000, same as above.Signed on 2000-02-15. Completion date: 2000-05-15.
MANAGEMENT AND TRAINING CORPOR (2800 AIRPORT HWY 21; small business) : $38,880 in 3 contractsfrom 2002 to 2003
$31,812 with Army for Food Services. Signed on 2002-07-24. Completion date: 2002-08-15.
$6,840, same as above.Signed on 2003-01-09. Completion date: 2003-01-08.
$228, same as above.Signed on 2003-04-10. Completion date: 2003-01-08.
USA ELECTRIC VEHICLES (1900 N I H 35)
$25,980 with Defense Logistics Agency for Miscellaneous Items. Taking place in VA. Signed on 2005-02-08. Completion date: 2005-02-21.
JOHN BACCUS ECOLOGICAL CONSULT (1805 PALOMINO LN; small business) : $21,998 in 2 contractsfrom 2003 to 2004
$15,068 with Army for Environmental Sciences -- Basic Research (R&D). Signed on 2004-02-25. Completion date: 2004-07-31.
$6,930 with Army for Other Environmental Services, Studies, and Analytical Support. Signed on 2003-09-04. Completion date: 2003-10-08.
CENTURYTEL OF NORTHWEST LOUISI (208 S GUADALUPE ST) : $17,450 in 12 contractsfrom 2002 to 2005
Contracts for Telephone and/or Communications Services (includes Telegraph, Telex, and Cablevision Services), Maintenance, Repair and Rebuilding of Equipment -- Communication, Detection, and Coherent Radiation Equipment, Communications Services, Personal Care Services (includes such services as barber and beauty shop, shoe repairs, tailoring, etc.) by Navy, U.S. Army Corps of Engineers - civil program financing only, Army, Indian Affairs (Assistant Secretary), and others Signed by year:2000: $0; 2001: $0; 2002: $500; 2003: $7,450; 2004: $8,000; 2005: $1,500; 2006: $0.
Biggest contracts:
$4,650 with Navy for Telephone and/or Communications Services (includes Telegraph, Telex, and Cablevision Services). Taking place in LA. Signed on 2003-01-10. Completion date: 2003-09-30.
$2,500 with U.S. Army Corps of Engineers - civil program financing only for Telephone and/or Communications Services (includes Telegraph, Telex, and Cablevision Services). Taking place in LA. Signed on 2004-03-26. Completion date: 2004-09-29.
$2,500 with Army for Telephone and/or Communications Services (includes Telegraph, Telex, and Cablevision Services). Taking place in LA. Signed on 2004-03-26. Completion date: 2004-09-29.
$1,500 with Army for Telephone and/or Communications Services (includes Telegraph, Telex, and Cablevision Services). Taking place in GA. Signed on 2004-12-01. Completion date: 2005-09-30.
2003 - 2018 National Fire Incident Reporting System (NFIRS) incidents
Based on the data from the years 2003 - 2018 the average number of fires per year is 230. The highest number of reported fire incidents - 342 took place in 2011, and the least - 142 in 2004. The data has an increasing trend.
When looking into fire subcategories, the most incidents belonged to: Outside Fires (53.6%), and Structure Fires (27.8%).
Fire incident types reported to NFIRS in Zip Code 78666
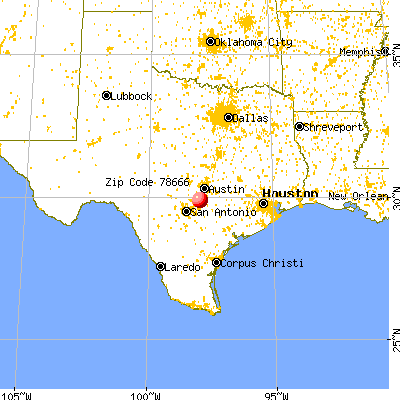


 Nearest zip codes: 78655, 78656, 78640, 78670, 78130, 78622.
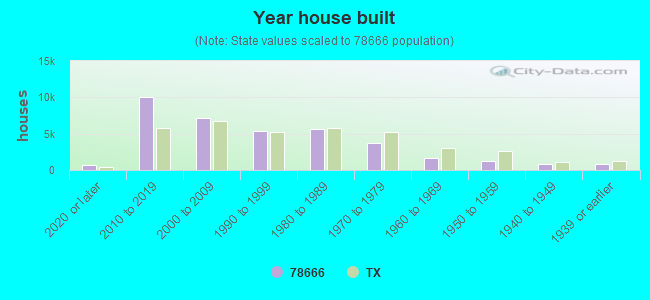


 Based on the data from the years 2003 - 2018 the average number of fires per year is 230. The highest number of reported fire incidents - 342 took place in 2011, and the least - 142 in 2004. The data has an increasing trend.
 When looking into fire subcategories, the most incidents belonged to: Outside Fires (53.6%), and Structure Fires (27.8%).