San Marcos, Texas
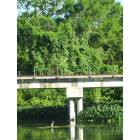
San Marcos: a blue heron perched in the san marcos river under the railroad bridge

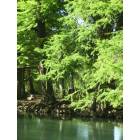
San Marcos: guadalupe river

San Marcos: Flock of ducks in san marcos river
San Marcos: riverbanks of the san marcos river
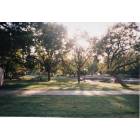
San Marcos: Sewel Park in San Marcos, TX

San Marcos: a blue heron perched in the san marcos river under the railroad bridge
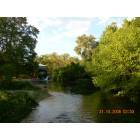
San Marcos: San Marcos River
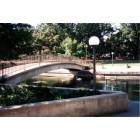
San Marcos: San Marcos River at Sewel Park
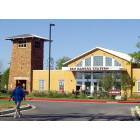
San Marcos: San Marcos Station - Amtrac and Greyhound
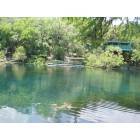
San Marcos: Aquarena Springs
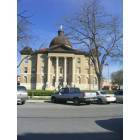
San Marcos: Hays County Courthouse
- see
16
more - add
your
Submit your own pictures of this city and show them to the world
- OSM Map
- General Map
- Google Map
- MSN Map
Population change since 2000: +102.4%
| Males: 32,503 | |
| Females: 37,798 |
| Median resident age: | 25.2 years |
| Texas median age: | 35.6 years |
Zip codes: 78656.
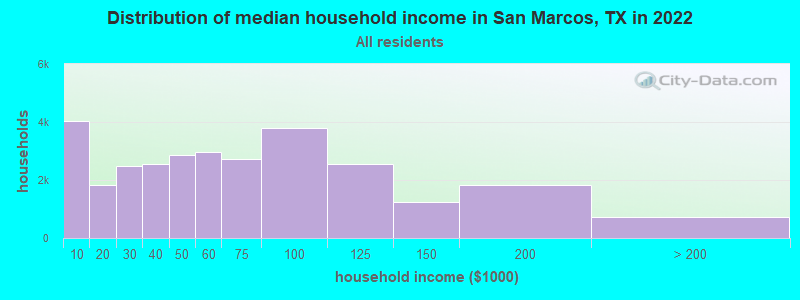
| San Marcos: | $52,040 |
| TX: | $72,284 |
Estimated per capita income in 2022: $26,985 (it was $13,468 in 2000)
San Marcos city income, earnings, and wages data
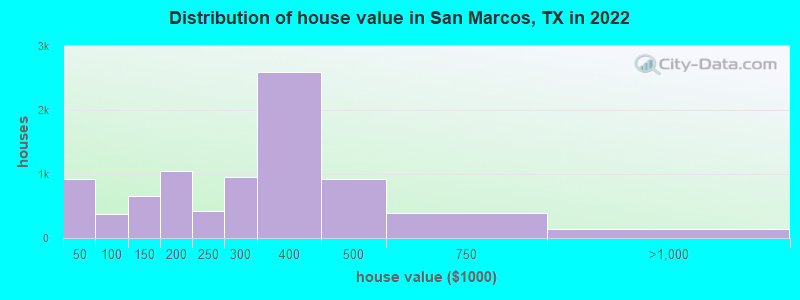
Estimated median house or condo value in 2022: $285,400 (it was $76,000 in 2000)
| San Marcos: | $285,400 |
| TX: | $275,400 |
Mean prices in 2022: all housing units: $292,582; detached houses: $316,037; townhouses or other attached units: $258,322; in 2-unit structures: $277,340; in 5-or-more-unit structures: $245,185; mobile homes: $36,157
Median gross rent in 2022: $1,112.
(30.9% for White Non-Hispanic residents, 42.0% for Black residents, 21.7% for Hispanic or Latino residents, 2.8% for American Indian residents, 19.5% for other race residents, 15.7% for two or more races residents)
Detailed information about poverty and poor residents in San Marcos, TX


Compare current foreclosures in San Marcos, TX:
| Photo | Address | Area | Beds / Baths | Price | Details |
|---|---|---|---|---|---|

|
#1
Pincea Pl
San Marcos, TX 78666
|
2,611 sq. feet
|
2 baths 3 beds |
show details | |

|
#2
E Mimosa Cir
San Marcos, TX 78666
|
2,368 sq. feet
|
2 baths 3 beds |
show details | |

|
#3
Spiny Lizard Ln
San Marcos, TX 78666
|
- sq. feet
|
2 baths 2 beds |
show details | |

|
#4
Frasier Dr
San Marcos, TX 78666
|
- sq. feet
|
2 baths 3 beds |
show details | |

|
#5
Hollys Way
San Marcos, TX 78666
|
1,436 sq. feet
|
2 baths 4 beds |
show details | |

|
#6
Farm To Market 621
San Marcos, TX 78666
|
2,354 sq. feet
|
2 baths 4 beds |
show details | |

|
#7
Dylan Drive
San Marcos, TX 78666
|
1,423 sq. feet
|
- baths - beds |
show details | |

|
#8
Philo St
San Marcos, TX 78666
|
1,938 sq. feet
|
- baths - beds |
show details | |

|
#9
Dreibrodt Rd
San Marcos, TX 78666
|
- sq. feet
|
- baths - beds |
show details | |

|
#10
Aquarena Springs Dr Apt 22203
San Marcos, TX 78666
|
- sq. feet
|
- baths - beds |
show details |
| Photo | Address | Area | Beds / Baths | Price | Details |
|---|---|---|---|---|---|

|
#11
San Marcos Pkwy # 1105d
San Marcos, TX 78666
|
- sq. feet
|
- baths - beds |
show details | |

|
#12
Hunter Ridge Rd
San Marcos, TX 78666
|
1,324 sq. feet
|
- baths - beds |
show details | |

|
#13
Dandelion Trl
San Marcos, TX 78666
|
- sq. feet
|
- baths - beds |
show details | |

|
#14
Rush Hvn
San Marcos, TX 78666
|
1,568 sq. feet
|
- baths - beds |
show details | |

|
#15
Magnolia St
San Marcos, TX 78666
|
1,106 sq. feet
|
- baths - beds |
show details | |

|
#16
Hunter Rd
San Marcos, TX 78666
|
- sq. feet
|
- baths - beds |
show details | |

|
#17
Fm 1978
San Marcos, TX 78666
|
- sq. feet
|
- baths - beds |
show details | |

|
#18
Garden Ct
San Marcos, TX 78666
|
1,529 sq. feet
|
- baths - beds |
show details | |

|
#19
Horseshoe Bend Rd
San Marcos, TX 78666
|
1,456 sq. feet
|
- baths - beds |
show details | |

|
#20
N Interstate 35 Apt 16c
San Marcos, TX 78666
|
- sq. feet
|
- baths - beds |
show details |
| Photo | Address | Area | Beds / Baths | Price | Details |
|---|---|---|---|---|---|

|
#21
Old Martindale Rd # 1601
San Marcos, TX 78666
|
- sq. feet
|
- baths - beds |
show details | |

|
#22
Old Martindale Rd # 603
San Marcos, TX 78666
|
- sq. feet
|
- baths - beds |
show details | |

|
#23
Callado Cir
San Marcos, TX 78666
|
- sq. feet
|
- baths - beds |
show details | |

|
#24
N Interstate 35 Apt 12b
San Marcos, TX 78666
|
- sq. feet
|
- baths - beds |
show details | |

|
#25
Ramona Cir
San Marcos, TX 78666
|
1,704 sq. feet
|
- baths - beds |
show details | |

|
#26
Oak Mdws
San Marcos, TX 78666
|
1,456 sq. feet
|
- baths - beds |
show details | |

|
#27
Barnes Dr # 6107
San Marcos, TX 78666
|
- sq. feet
|
- baths - beds |
show details | |

|
#28
Foxtail Run
San Marcos, TX 78666
|
- sq. feet
|
- baths - beds |
show details | |

|
#29
Escondido Cir
San Marcos, TX 78666
|
- sq. feet
|
- baths - beds |
show details | |

|
#30
Dylan Dr
San Marcos, TX 78666
|
- sq. feet
|
- baths - beds |
show details |
| Photo | Address | Area | Beds / Baths | Price | Details |
|---|---|---|---|---|---|

|
Check over 1 million property listings on Foreclosure.com!
|
browse all offers | |||
| Photo | Address | Area | Beds / Baths | Price | Details |
|---|


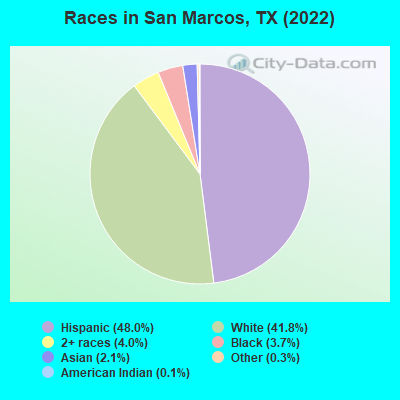
- 33,74448.0%Hispanic
- 29,36041.8%White alone
- 2,7794.0%Two or more races
- 2,5673.7%Black alone
- 1,5042.1%Asian alone
- 2310.3%Other race alone
- 820.1%American Indian alone
- 410.06%Native Hawaiian and Other
Pacific Islander alone
Races in San Marcos detailed stats: ancestries, foreign born residents, place of birth
According to our research of Texas and other state lists, there were 135 registered sex offenders living in San Marcos, Texas as of April 27, 2024.
The ratio of all residents to sex offenders in San Marcos is 471 to 1.
The ratio of registered sex offenders to all residents in this city is near the state average.
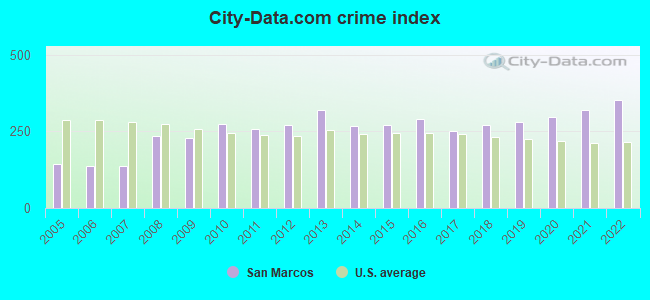
The City-Data.com crime index weighs serious crimes and violent crimes more heavily. Higher means more crime, U.S. average is 246.1. It adjusts for the number of visitors and daily workers commuting into cities.
- means the value is smaller than the state average.- means the value is about the same as the state average.
- means the value is bigger than the state average.
- means the value is much bigger than the state average.
Crime rate in San Marcos detailed stats: murders, rapes, robberies, assaults, burglaries, thefts, arson
Full-time law enforcement employees in 2021, including police officers: 146 (106 officers - 90 male; 16 female).
| Officers per 1,000 residents here: | 1.54 |
| Texas average: | 2.07 |
 Recent articles from our blog. Our writers, many of them Ph.D. graduates or candidates, create easy-to-read articles on a wide variety of topics.

 | Best option to study: San Antonio or San Marcos? (14 replies) |
| San Marcos or Waco??? (54 replies) |
| can you recommend a appliance repair service in San Marcos area (0 replies) |
| San Marcos Insider Info (26 replies) |
| Are San Marcos schools really that bad? (10 replies) |
| San Marcos Amazon (0 replies) |
Latest news from San Marcos, TX collected exclusively by city-data.com from local newspapers, TV, and radio stations
Ancestries: German (6.9%), English (4.1%), Irish (3.6%), American (3.1%), European (1.3%), Scottish (1.3%).
Current Local Time: CST time zone
Elevation: 619 feet
Land area: 18.2 square miles.
Population density: 3,861 people per square mile (average).
6,078 residents are foreign born (4.9% Latin America, 2.8% Asia).
| This city: | 8.2% |
| Texas: | 17.1% |
Median real estate property taxes paid for housing units with mortgages in 2022: $4,522 (1.5%)
Median real estate property taxes paid for housing units with no mortgage in 2022: $4,098 (1.5%)
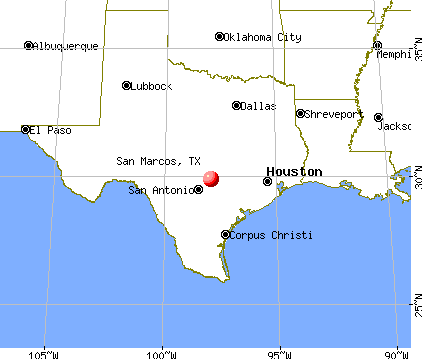
Nearest city with pop. 50,000+: Austin, TX  (31.3 miles , pop. 656,562).
Nearest city with pop. 1,000,000+: San Antonio, TX (45.4 miles , pop. 1,144,646).
Nearest cities:
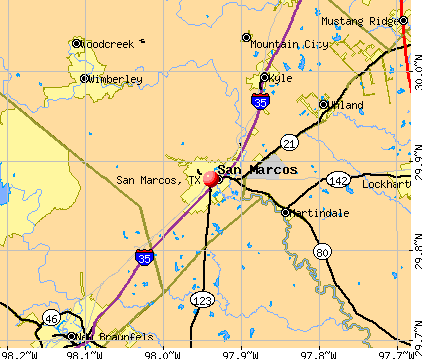
), ), ), ), )Latitude: 29.88 N, Longitude: 97.94 W
Daytime population change due to commuting: +6,571 (+9.3%)
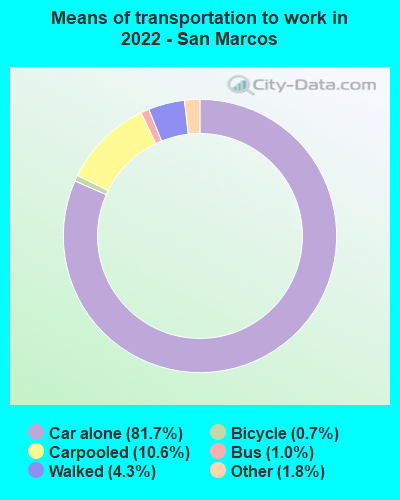
Workers who live and work in this city: 19,116 (47.1%)
Area code: 512
San Marcos tourist attractions:
San Marcos, Texas accommodation & food services, waste management - Economy and Business Data
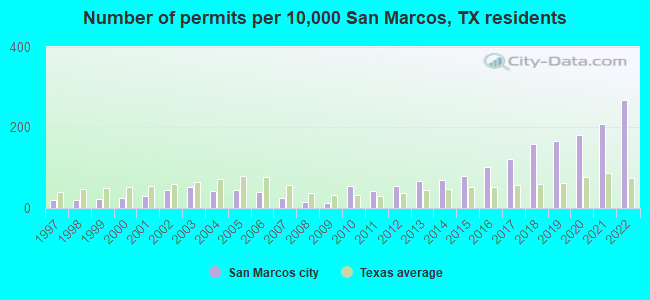
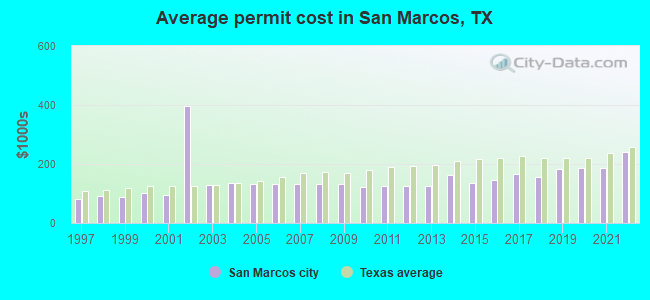
Single-family new house construction building permits:
- 2022: 934 buildings, average cost: $238,600
- 2021: 721 buildings, average cost: $186,600
- 2020: 625 buildings, average cost: $188,100
- 2019: 577 buildings, average cost: $182,700
- 2018: 557 buildings, average cost: $155,200
- 2017: 419 buildings, average cost: $167,000
- 2016: 352 buildings, average cost: $147,200
- 2015: 277 buildings, average cost: $136,100
- 2014: 243 buildings, average cost: $162,500
- 2013: 232 buildings, average cost: $124,800
- 2012: 192 buildings, average cost: $124,400
- 2011: 147 buildings, average cost: $125,000
- 2010: 190 buildings, average cost: $123,000
- 2009: 41 buildings, average cost: $133,200
- 2008: 53 buildings, average cost: $133,200
- 2007: 91 buildings, average cost: $133,200
- 2006: 135 buildings, average cost: $133,200
- 2005: 155 buildings, average cost: $133,000
- 2004: 148 buildings, average cost: $133,900
- 2003: 177 buildings, average cost: $129,900
- 2002: 153 buildings, average cost: $398,300
- 2001: 99 buildings, average cost: $95,900
- 2000: 82 buildings, average cost: $101,800
- 1999: 79 buildings, average cost: $87,400
- 1998: 74 buildings, average cost: $93,000
- 1997: 68 buildings, average cost: $82,900
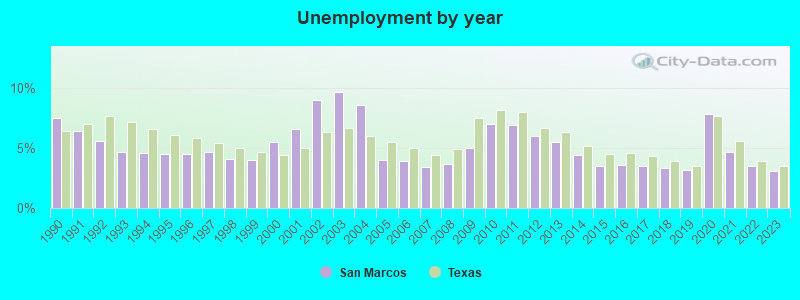
| Here: | 3.1% |
| Texas: | 3.5% |
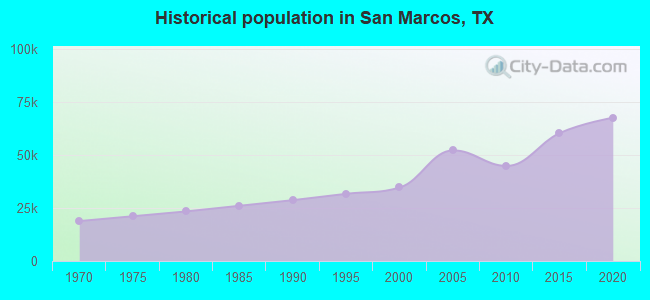
Population change in the 1990s: +5,609 (+19.3%).
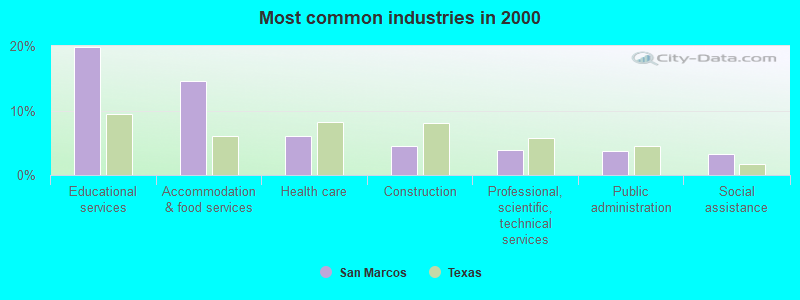
- Educational services (19.9%)
- Accommodation & food services (14.6%)
- Health care (6.1%)
- Construction (4.5%)
- Professional, scientific, technical services (3.9%)
- Public administration (3.8%)
- Social assistance (3.2%)
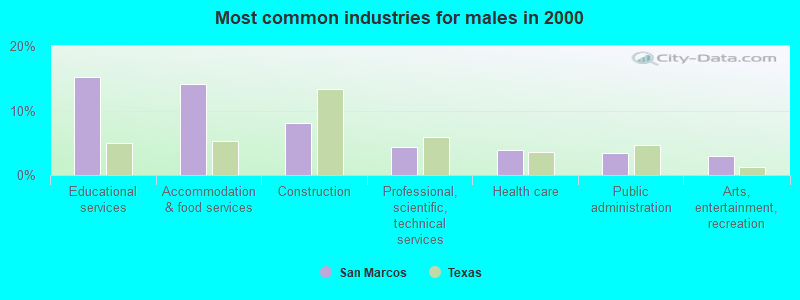
- Educational services (15.3%)
- Accommodation & food services (14.1%)
- Construction (8.1%)
- Professional, scientific, technical services (4.4%)
- Health care (3.8%)
- Public administration (3.4%)
- Arts, entertainment, recreation (2.9%)
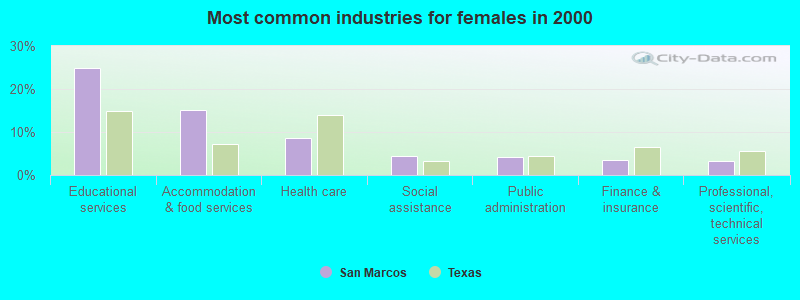
- Educational services (25.0%)
- Accommodation & food services (15.0%)
- Health care (8.6%)
- Social assistance (4.5%)
- Public administration (4.2%)
- Finance & insurance (3.4%)
- Professional, scientific, technical services (3.3%)
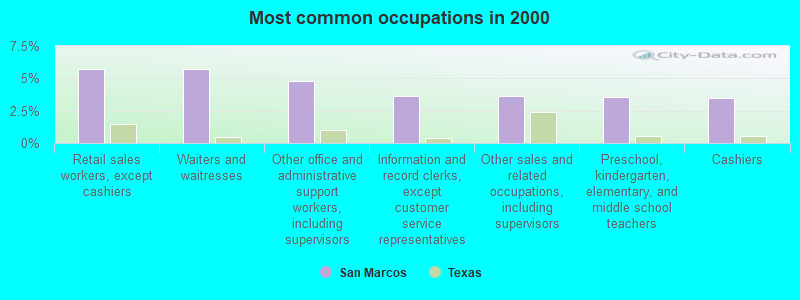
- Retail sales workers, except cashiers (5.7%)
- Waiters and waitresses (5.7%)
- Other office and administrative support workers, including supervisors (4.8%)
- Information and record clerks, except customer service representatives (3.6%)
- Other sales and related occupations, including supervisors (3.6%)
- Preschool, kindergarten, elementary, and middle school teachers (3.6%)
- Cashiers (3.5%)
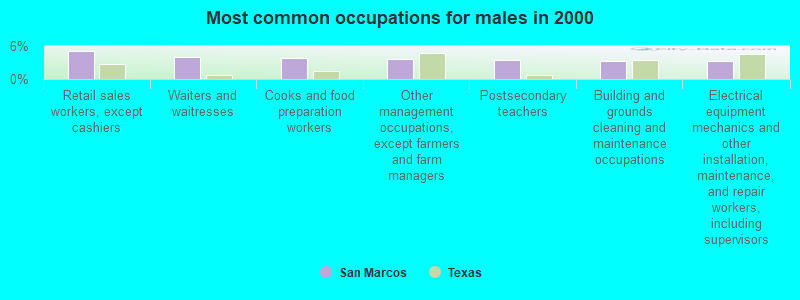
- Retail sales workers, except cashiers (5.2%)
- Waiters and waitresses (4.1%)
- Cooks and food preparation workers (3.8%)
- Other management occupations, except farmers and farm managers (3.6%)
- Postsecondary teachers (3.4%)
- Building and grounds cleaning and maintenance occupations (3.3%)
- Electrical equipment mechanics and other installation, maintenance, and repair workers, including supervisors (3.2%)

- Other office and administrative support workers, including supervisors (7.5%)
- Waiters and waitresses (7.4%)
- Retail sales workers, except cashiers (6.3%)
- Preschool, kindergarten, elementary, and middle school teachers (6.0%)
- Information and record clerks, except customer service representatives (5.4%)
- Secretaries and administrative assistants (4.9%)
- Cashiers (4.7%)
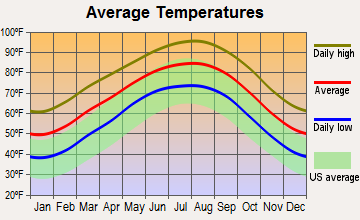
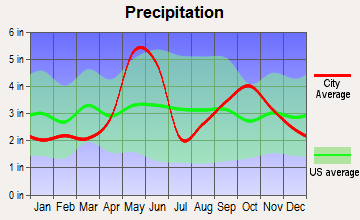
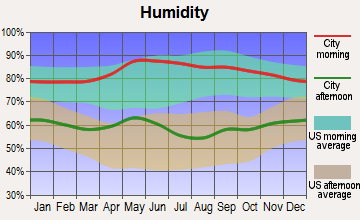
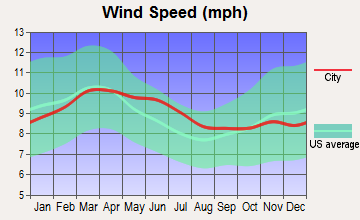
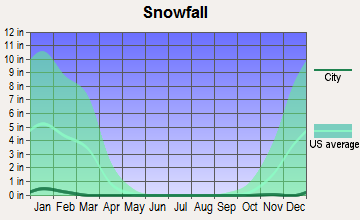
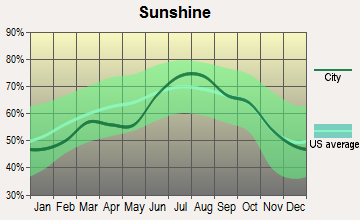
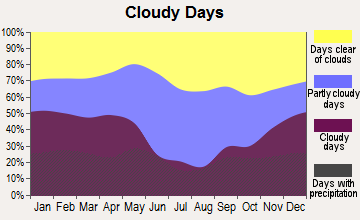
Average climate in San Marcos, Texas
Based on data reported by over 4,000 weather stations
|
|

(lower is better)
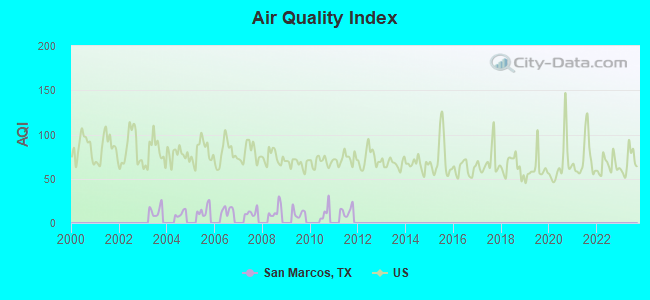
Air Quality Index (AQI) level in 2011 was 13.7. This is significantly better than average.
| City: | 13.7 |
| U.S.: | 72.6 |
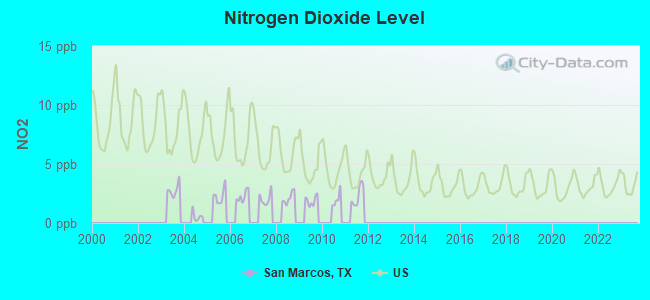
Nitrogen Dioxide (NO2) [ppb] level in 2011 was 2.33. This is significantly better than average. Closest monitor was 0.3 miles away from the city center.
| City: | 2.33 |
| U.S.: | 5.11 |
Tornado activity:
San Marcos-area historical tornado activity is near Texas state average. It is 22% greater than the overall U.S. average.
On 5/27/1997, a category F4 (max. wind speeds 207-260 mph) tornado 31.3 miles away from the San Marcos city center killed one person and injured 5 people and caused $15 million in damages.
On 9/20/1967, a category F3 (max. wind speeds 158-206 mph) tornado 19.2 miles away from the city center caused between $50,000 and $500,000 in damages.
Earthquake activity:
San Marcos-area historical earthquake activity is significantly above Texas state average. It is 24% smaller than the overall U.S. average.On 10/20/2011 at 12:24:41, a magnitude 4.8 (4.8 MW, Depth: 3.1 mi, Class: Light, Intensity: IV - V) earthquake occurred 70.7 miles away from San Marcos center
On 4/14/1995 at 00:32:56, a magnitude 5.7 (5.6 MB, 5.7 MS, 5.7 MW, Depth: 11.1 mi, Class: Moderate, Intensity: VI - VII) earthquake occurred 326.0 miles away from the city center
On 4/9/1993 at 12:29:19, a magnitude 4.3 (4.1 MB, 4.3 LG, Depth: 3.1 mi) earthquake occurred 74.7 miles away from San Marcos center
On 6/16/1978 at 11:46:54, a magnitude 5.3 (4.4 MB, 4.6 UK, 5.3 ML) earthquake occurred 274.4 miles away from San Marcos center
On 5/1/2018 at 16:28:56, a magnitude 4.0 (4.0 MW, Depth: 3.1 mi) earthquake occurred 64.6 miles away from the city center
On 4/7/2008 at 09:51:12, a magnitude 3.9 (3.9 MW, Depth: 3.1 mi, Class: Light, Intensity: II - III) earthquake occurred 66.7 miles away from the city center
Magnitude types: regional Lg-wave magnitude (LG), body-wave magnitude (MB), local magnitude (ML), surface-wave magnitude (MS), moment magnitude (MW)
Natural disasters:
The number of natural disasters in Hays County (20) is greater than the US average (15).Major Disasters (Presidential) Declared: 10
Emergencies Declared: 5
Causes of natural disasters: Storms: 9, Floods: 8, Fires: 7, Tornadoes: 4, Hurricanes: 3, Winds: 3, Other: 1 (Note: some incidents may be assigned to more than one category).
Main business address for: Grande Communications Holdings, Inc. (RADIO TELEPHONE COMMUNICATIONS).
Hospitals in San Marcos:
- BISHOP HOUSE (614 BISHOP ST)
- CENTRAL TEXAS MEDICAL CENTER (Voluntary non-profit - Private, provides emergency services, 1301 WONDER WORLD DRIVE)
- CENTRAL TEXAS MEDICAL CENTER HOSPICE (1315 IH 35 NORTH)
- LAGO VISTA (1129 LAGO VISTA)
- MCCARTY HOUSE (2206 MCCARTY LN)
- MOCKINGBIRD VILLA (1502 MOCKINGBIRD LN)
- RIO BLANCO (1010 E UHLAND RD)
- WALTON HOUSE (110 SUTTLES RD)
Nursing Homes in San Marcos:
- HAYS NURSING AND REHAB CENTER (1900 MEDICAL PKWY)
- REGENT CARE CENTER OF SAN MARCOS (1351 SADLER)
- RIVER CREST NURSING AND REHAB INC (120 WARDEN LN)
- TEXAN NURSING AND REHAB OF SAN MARCOS LLC (1600 N I H 35)
Dialysis Facilities in San Marcos:
Airports and heliports located in San Marcos:
- San Marcos Regional Airport (HYI) (Runways: 3, Air Taxi Ops: 317, Itinerant Ops: 21,160, Local Ops: 32,710, Military Ops: 2,300)
- Alison Air Park Airport (7TS2) (Runways: 1)
- Central Texas Medical Center Hospital Heliport (36XA)
College/University in San Marcos:
Other colleges/universities with over 2000 students near San Marcos:
- Saint Edward's University (about 27 miles; Austin, TX; Full-time enrollment: 4,308)
- The University of Texas at Austin (about 31 miles; Austin, TX; FT enrollment: 45,500)
- Austin Community College District (about 35 miles; Austin, TX; FT enrollment: 25,957)
- Concordia University-Texas (about 38 miles; Austin, TX; FT enrollment: 2,192)
- University of the Incarnate Word (about 43 miles; San Antonio, TX; FT enrollment: 6,875)
- Trinity University (about 44 miles; San Antonio, TX; FT enrollment: 2,467)
- St Philip's College (about 45 miles; San Antonio, TX; FT enrollment: 5,970)
Public high schools in San Marcos:
- SAN MARCOS H S (Students: 2,111, Location: 2601 RATTLER RD MCCARTY LN, Grades: 9-12)
- JOHN H WOOD JR CS HAYS CO JUVENILE RES CENTER (Students: 116, Location: 2250 CLOVIS R BARKER RD, Grades: 6-12, Charter school)
- JOHN H WOOD JR CHARTER SCHOOL AT SAN MARCOS (Location: 120 BERT BROWN RD, Grades: 1-12, Charter school)
Private high schools in San Marcos:
Biggest public elementary/middle schools in San Marcos:
- GOODNIGHT MIDDLE (Students: 894, Location: 1301 HWY 123, Grades: 6-8)
- HERNANDEZ EL (Students: 812, Location: 333 STAGECOACH TRL, Grades: PK-5)
- MILLER MIDDLE (Students: 726, Location: 301 FOXTAIL RUN, Grades: 6-8)
- DEZAVALA EL (Students: 645, Location: 600 FM 621 DEZAVALA DR, Grades: KG-5)
- BLANCO VISTA EL (Students: 611, Location: 2951 BLANCO VISTA BLVD, Grades: PK-5)
- MENDEZ EL (Students: 508, Location: 1805 PETER GARZA, Grades: KG-5)
- TEXAS PREPARATORY SCHOOL (Students: 105, Location: 400 UHLAND RD NO 2, Grades: KG-6, Charter school)
- BOWIE EL (Location: 4020 MONTERREY OAKS, Grades: KG-5)
- CROCKETT EL (Location: 1300 GIRARD AVE, Grades: KG-5)
- TRAVIS EL (Location: 1437 POST RD, Grades: KG-5)
Private elementary/middle schools in San Marcos:
User-submitted facts and corrections:
- There is WOAI-AM Talk Radio 1200 on the dial in San Antonio that I listen to here in Bastrop.
- The name of the university has changed and so has its Web address. It is now Texas State University and the Web site is www.txstate.edu added by Tara
- Southwest Texas U. is now TEXAS STATE UNIVERSITY-SAN MARCOS the new website is www.txstate.edu added by Nabil
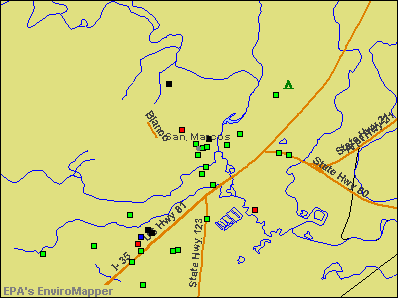
Points of interest:
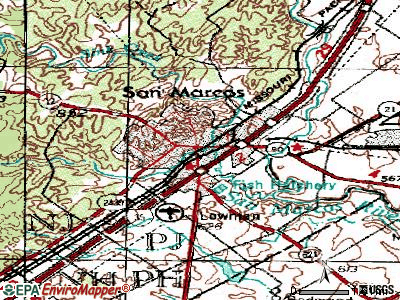
Notable locations in San Marcos: Wood State Fish Hatchery (A), Prime Outlets at San Marcos (B), Belvin Street Historic District (C), Hays County Courthouse Historic District (D), Belger-Cahill Lime Kiln (E), Episcopalian Rectory (F), Farmers Union Gin Company (G), Fisher Hall (H), South Hays Fire Department Company 1 (I), Green and Faris Buildings (J), Goforth-Harris House (K), Heard House (L), Hays County Jail (M), Hardy-Williams Building (N), Hutchison House (O), Johnson House (P), Kone-Cliett House (Q), McKie-Bass Building (R), Moore Grocery Company (S), Hays County Courthouse (T). Display/hide their locations on the map
Main business address in San Marcos: Grande Communications Holdings, Inc. (A). Display/hide its location on the map
Churches in San Marcos include: First United Methodist Church (A), Fort Street Presbyterian Church (B), Cemetery Chapel (C), Seventh Day Adventist Church (D), Community Baptist Church (E), Wesley Chapel African Methodist Episcopal Church (F), First Presbyterian Church (G), Pentecostal Temple Church of God in Christ (H), First United Pentecostal Church (I). Display/hide their locations on the map
Reservoir: Spring Lake (A). Display/hide its location on the map
Creeks: Willow Springs Creek (A), Purgatory Creek (B). Display/hide their locations on the map
Parks in San Marcos include: John Stokes Park (1), San Marcos City Park (2), Rio Vista Park (3), Ramon Lucio Memorial Park (4), Bobcat Soccer Complex (5), Bobcat Baseball Field (6), Bobcat Softball Field (7), Bobcat Stadium (8), Strahan Coliseum (9). Display/hide their locations on the map
Tourist attractions: Charles S Cock House-Museum (400 West Hopkins Street) (1), Cottage Kitchen (Cultural Attractions- Events- & Facilities; 400 West Hopkins Street) (2), Wonder World Park (Caverns; 1000 Prospect Street) (3), Dillinger's (127 East Hopkins Street) (4), American Tourister (3939 South I H 35 Suite 308A) (5), Duece's Wild (423 North L B J Drive Suite H) (6). Display/hide their approximate locations on the map
Hotels: Amerihost Inn - San Marcos (4210 S I H 35) (1), Bed & Breakfast Society of San Marcos (326 West Hopkins Street) (2), Best Budget Inn (903 North I H 35) (3), Best Western San Marcos (917 North Interstate 35) (4), Best Value Inn (1507 North I H 35) (5), Comfort Inn (1611 North I H 35) (6). Display/hide their approximate locations on the map
Birthplace of: Catalina Vasquez Villalpando - Treasurer of the, Albert S. Burleson - Politician, Cleto L. Rodriguez - Army Medal of Honor recipient, Lynda Day George - Film actor, Mike Brisiel - Football player, Ty Detmer - 2005 NFL player (Atlanta Falcons, born: Oct 30, 1967), Lucious Jackson - Basketball player, Jason Colwick - Pole vaulter, Mark Wheeler - Football player, Pete Compton - Baseball player.
Drinking water stations with addresses in San Marcos and their reported violations in the past:
BLANCO RIVER RANCH (Population served: 70, Groundwater):Past monitoring violations:BLUE AGAVE MOBILE HOME PARK (Population served: 57, Groundwater):
- Follow-up Or Routine LCR Tap M/R - In OCT-01-2013, Contaminant: Lead and Copper Rule
- Follow-up Or Routine LCR Tap M/R - In OCT-01-2012, Contaminant: Lead and Copper Rule
- Monitoring and Reporting (DBP) - Between OCT-2008 and DEC-2008, Contaminant: Chlorine. Follow-up actions: St Public Notif requested (MAR-27-2009), St Violation/Reminder Notice (MAR-27-2009), St Compliance achieved (JUL-17-2014)
Past monitoring violations:
- Lead Consumer Notice - In DEC-30-2013, Contaminant: Lead and Copper Rule
- Monitoring and Reporting (DBP) - Between OCT-2012 and DEC-2012, Contaminant: Chlorine. Follow-up actions: St Compliance achieved (JUL-17-2014)
- Monitoring and Reporting (DBP) - Between OCT-2008 and DEC-2008, Contaminant: Chlorine. Follow-up actions: St Public Notif requested (MAR-27-2009), St Violation/Reminder Notice (MAR-27-2009), St Public Notif received (APR-02-2009), St Compliance achieved (2 times from AUG-04-2009 to JAN-24-2011)
- Monitoring and Reporting (DBP) - Between JAN-2007 and MAR-2007, Contaminant: Chlorine. Follow-up actions: St Public Notif requested (JUL-19-2007), St Violation/Reminder Notice (JUL-19-2007), St Compliance achieved (JAN-24-2011)
- Monitoring and Reporting (DBP) - Between OCT-2006 and DEC-2006, Contaminant: Chlorine. Follow-up actions: St Public Notif requested (JUL-19-2007), St Violation/Reminder Notice (JUL-19-2007), St Compliance achieved (JAN-24-2011)
- 10 routine major monitoring violations
- 43 regular monitoring violations
- 7 other older monitoring violations
Drinking water stations with addresses in San Marcos that have no violations reported:
- TEXAS STATE UNIVERSITY - FREEMAN RANCH (Population served: 150, Primary Water Source Type: Groundwater)
| This city: | 2.3 people |
| Texas: | 2.8 people |
| This city: | 38.1% |
| Whole state: | 69.9% |
| This city: | 8.3% |
| Whole state: | 6.0% |
Likely homosexual households (counted as self-reported same-sex unmarried-partner households)
- Lesbian couples: 0.5% of all households
- Gay men: 0.2% of all households
People in group quarters in San Marcos in 2010:
- 5,389 people in college/university student housing
- 300 people in nursing facilities/skilled-nursing facilities
- 259 people in local jails and other municipal confinement facilities
- 157 people in residential treatment centers for juveniles (non-correctional)
- 57 people in other noninstitutional facilities
- 25 people in group homes intended for adults
- 13 people in in-patient hospice facilities
- 2 people in emergency and transitional shelters (with sleeping facilities) for people experiencing homelessness
People in group quarters in San Marcos in 2000:
- 4,405 people in college dormitories (includes college quarters off campus)
- 337 people in nursing homes
- 285 people in local jails and other confinement facilities (including police lockups)
- 200 people in job corps and vocational training facilities
- 171 people in residential treatment centers for emotionally disturbed children
- 70 people in other noninstitutional group quarters
- 53 people in homes for the mentally retarded
- 7 people in religious group quarters
Banks with most branches in San Marcos (2011 data):
- The Frost National Bank: Downtown San Marcos, Guadalupe Drive-In Branch, Highway 80 Branch, Wonder World Branch. Info updated 2006/12/21: Bank assets: $20,372.1 mil, Deposits: $16,846.8 mil, headquarters in San Antonio, TX, positive income, Commercial Lending Specialization, 133 total offices, Holding Company: Cullen/Frost Bankers, Inc.
- Wells Fargo Bank, National Association: San Marcos Downtown Branch, Texas State University Of Cyberbranc, San Marcos Wal-Mart Branch. Info updated 2011/04/05: Bank assets: $1,161,490.0 mil, Deposits: $905,653.0 mil, headquarters in Sioux Falls, SD, positive income, 6395 total offices, Holding Company: Wells Fargo & Company
- International Bank of Commerce: San Marcos Branch at 1081 Wonderworld Drive, branch established on 1998/03/02. Info updated 2007/03/28: Bank assets: $9,621.9 mil, Deposits: $6,548.8 mil, headquarters in Laredo, TX, positive income, Commercial Lending Specialization, 197 total offices, Holding Company: International Bancshares Corporation
- Compass Bank: San Marcos Branch at 300 South Lbj Drive, branch established on 1995/10/19. Info updated 2011/02/24: Bank assets: $63,107.0 mil, Deposits: $46,232.4 mil, headquarters in Birmingham, AL, negative income in the last year, Commercial Lending Specialization, 720 total offices, Holding Company: Banco Bilbao Vizcaya Argentaria, S.A.
- Broadway National Bank: San Marcos Branch at 301 North C M Allen Parkway, branch established on 1978/01/01. Info updated 2006/11/03: Bank assets: $2,465.8 mil, Deposits: $2,085.7 mil, headquarters in San Antonio, TX, positive income, Commercial Lending Specialization, 40 total offices, Holding Company: Broadway Bancshares, Inc.
- The Ozona National Bank: San Marcos Branch at 141 West Hopkins, branch established on 1999/04/12. Info updated 2006/11/03: Bank assets: $213.2 mil, Deposits: $189.9 mil, headquarters in Ozona, TX, positive income, Commercial Lending Specialization, 6 total offices, Holding Company: Onb Bancshares, Inc.
- Sage Capital Bank, National Association: American National Bank at 2106 Hunter Road, branch established on 2003/12/29. Info updated 2010/01/13: Bank assets: $286.7 mil, Deposits: $258.4 mil, headquarters in Gonzales, TX, positive income, Agricultural Specialization, 6 total offices, Holding Company: Anb Bancshares, Inc.
- Schertz Bank & Trust: San Marcos Branch at 1917 Dutton Drive, Suite 210, branch established on 2009/02/17. Info updated 2006/11/03: Bank assets: $189.6 mil, Deposits: $167.2 mil, headquarters in Schertz, TX, positive income, Commercial Lending Specialization, 5 total offices, Holding Company: Schertz Bancshares Corporation
- Bank of America, National Association: San Marcos Branch at 308 East Hopkins Drive, branch established on 1989/06/01. Info updated 2009/11/18: Bank assets: $1,451,969.3 mil, Deposits: $1,077,176.8 mil, headquarters in Charlotte, NC, positive income, 5782 total offices, Holding Company: Bank Of America Corporation
For population 15 years and over in San Marcos:
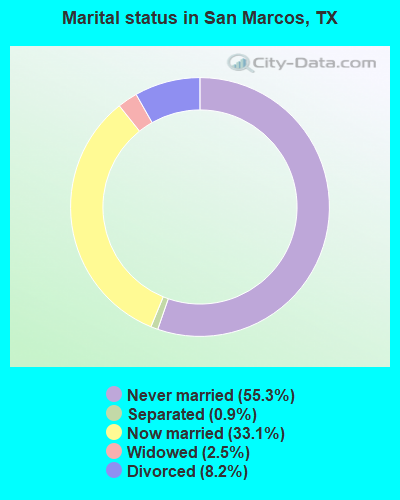
- Never married: 55.3%
- Now married: 33.1%
- Separated: 0.9%
- Widowed: 2.5%
- Divorced: 8.2%
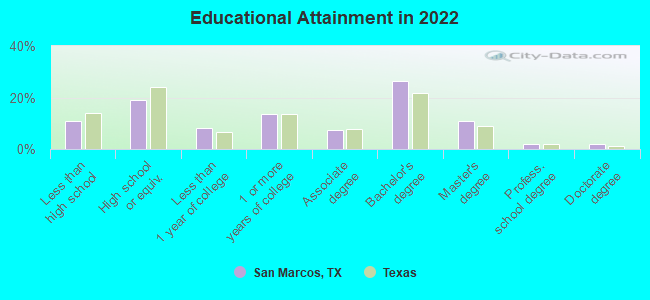
For population 25 years and over in San Marcos:
- High school or higher: 89.1%
- Bachelor's degree or higher: 41.2%
- Graduate or professional degree: 14.9%
- Unemployed: 8.7%
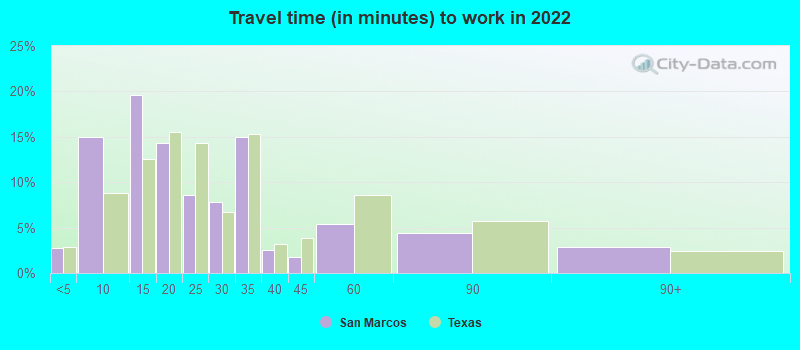
- Mean travel time to work (commute): 22.0 minutes
| Here: | 13.5 |
| Texas average: | 14.0 |
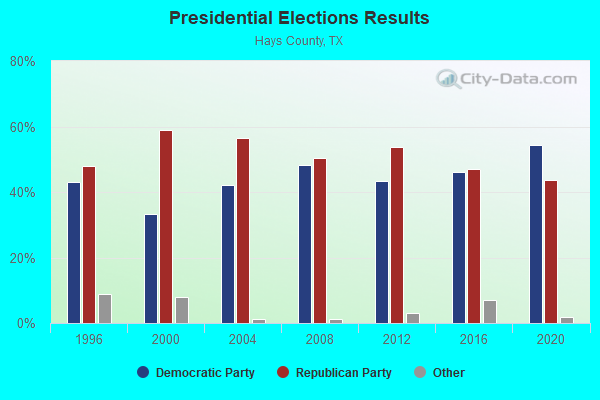
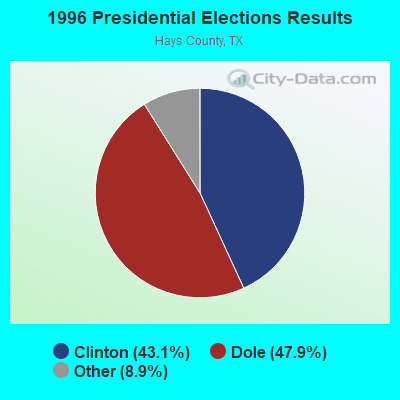
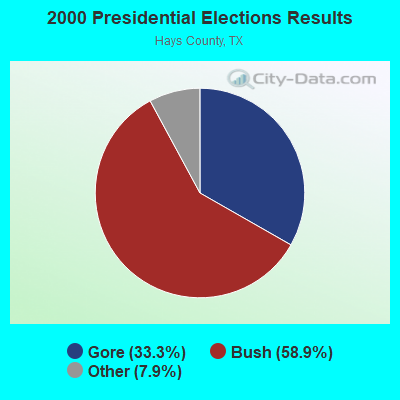
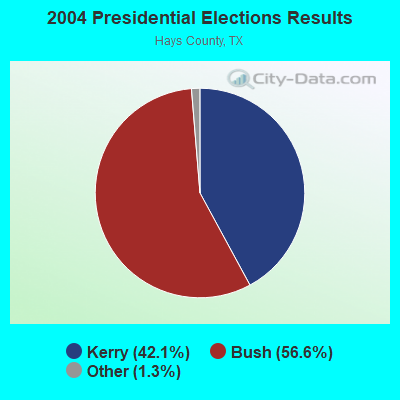
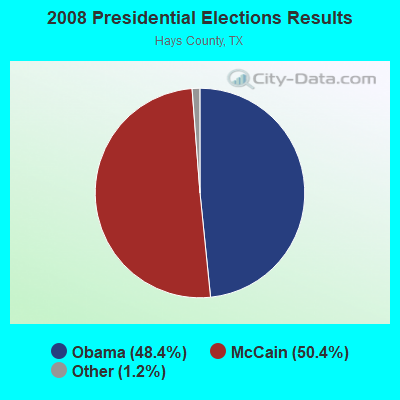
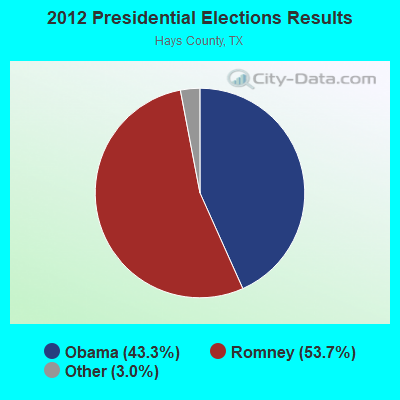
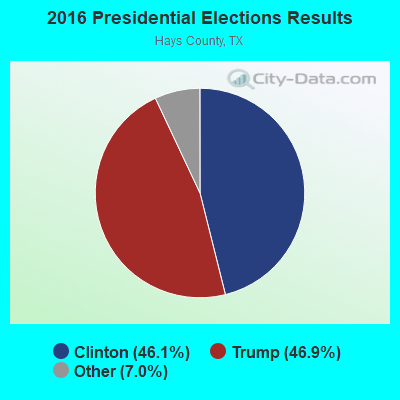
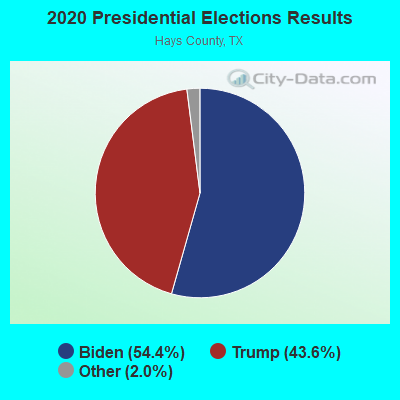
Graphs represent county-level data. Detailed 2008 Election Results
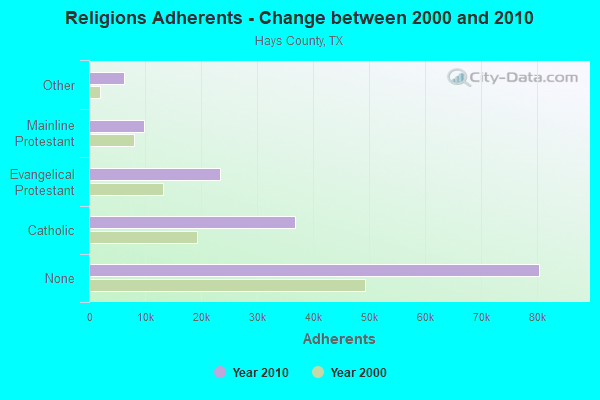
Religion statistics for San Marcos, TX (based on Hays County data)
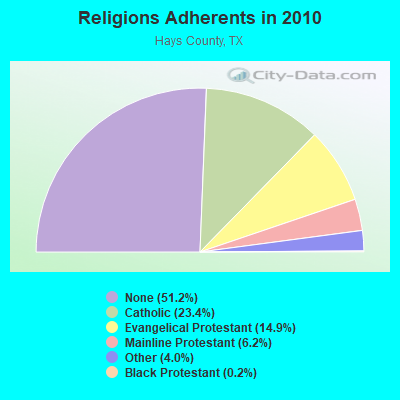
| Religion | Adherents | Congregations |
|---|---|---|
| Catholic | 36,801 | 8 |
| Evangelical Protestant | 23,425 | 76 |
| Mainline Protestant | 9,809 | 22 |
| Other | 6,253 | 14 |
| Black Protestant | 310 | 3 |
| Orthodox | 75 | 1 |
| None | 80,434 | - |
Food Environment Statistics:
| Hays County: | 1.06 / 10,000 pop. |
| Texas: | 1.47 / 10,000 pop. |
| This county: | 0.07 / 10,000 pop. |
| Texas: | 0.14 / 10,000 pop. |
| Here: | 0.49 / 10,000 pop. |
| Texas: | 1.11 / 10,000 pop. |
| Hays County: | 3.10 / 10,000 pop. |
| Texas: | 3.95 / 10,000 pop. |
| Hays County: | 6.48 / 10,000 pop. |
| State: | 6.13 / 10,000 pop. |
| Hays County: | 6.7% |
| Texas: | 8.9% |
| Here: | 24.8% |
| State: | 26.6% |
| Hays County: | 16.0% |
| State: | 15.7% |
Health and Nutrition:
| San Marcos: | 47.3% |
| Texas: | 48.6% |
| San Marcos: | 49.2% |
| Texas: | 47.4% |
| This city: | 27.6 |
| Texas: | 28.5 |
| San Marcos: | 18.0% |
| State: | 20.6% |
| San Marcos: | 10.5% |
| Texas: | 10.3% |
| This city: | 6.8 |
| Texas: | 6.8 |
| San Marcos: | 27.3% |
| State: | 33.1% |
| San Marcos: | 58.9% |
| State: | 56.2% |
| San Marcos: | 83.0% |
| Texas: | 80.7% |
More about Health and Nutrition of San Marcos, TX Residents
| Local government employment and payroll (March 2022) | |||||
| Function | Full-time employees | Monthly full-time payroll | Average yearly full-time wage | Part-time employees | Monthly part-time payroll |
|---|---|---|---|---|---|
| Police Protection - Officers | 130 | $997,241 | $92,053 | 2 | $2,812 |
| Firefighters | 78 | $591,947 | $91,069 | 0 | $0 |
| Streets and Highways | 67 | $385,084 | $68,970 | 1 | $664 |
| Other Government Administration | 61 | $423,433 | $83,298 | 3 | $4,796 |
| Parks and Recreation | 59 | $330,084 | $67,136 | 36 | $45,176 |
| Financial Administration | 54 | $313,811 | $69,736 | 1 | $1,778 |
| Water Supply | 47 | $232,686 | $59,409 | 1 | $438 |
| Electric Power | 44 | $270,103 | $73,664 | 0 | $0 |
| Police - Other | 42 | $206,088 | $58,882 | 3 | $6,025 |
| Health | 33 | $132,937 | $48,341 | 4 | $6,574 |
| Sewerage | 24 | $96,211 | $48,106 | 0 | $0 |
| Judicial and Legal | 16 | $100,112 | $75,084 | 3 | $7,998 |
| Local Libraries | 15 | $84,743 | $67,794 | 13 | $20,050 |
| Transit | 7 | $35,801 | $61,373 | 0 | $0 |
| Solid Waste Management | 3 | $14,081 | $56,324 | 0 | $0 |
| Fire - Other | 2 | $21,067 | $126,402 | 0 | $0 |
| Totals for Government | 682 | $4,235,428 | $74,524 | 67 | $96,312 |
San Marcos government finances - Expenditure in 2021 (per resident):
- Construction - Regular Highways: $22,095,000 ($314.29)
Water Utilities: $12,362,000 ($175.84)
Sewerage: $11,846,000 ($168.50)
General - Other: $6,379,000 ($90.74)
Electric Utilities: $6,137,000 ($87.30)
- Current Operations - Electric Utilities: $49,276,000 ($700.93)
General - Other: $26,504,000 ($377.01)
Police Protection: $19,325,000 ($274.89)
Water Utilities: $13,753,000 ($195.63)
Local Fire Protection: $10,474,000 ($148.99)
Sewerage: $8,495,000 ($120.84)
Parks and Recreation: $6,413,000 ($91.22)
Regular Highways: $5,466,000 ($77.75)
Solid Waste Management: $4,645,000 ($66.07)
Central Staff Services: $4,459,000 ($63.43)
Health - Other: $3,182,000 ($45.26)
Housing and Community Development: $3,161,000 ($44.96)
Financial Administration: $2,877,000 ($40.92)
Libraries: $1,839,000 ($26.16)
Judicial and Legal Services: $991,000 ($14.10)
Protective Inspection and Regulation - Other: $661,000 ($9.40)
Air Transportation: $633,000 ($9.00)
Transit Utilities: $607,000 ($8.63)
Public Welfare - Other: $516,000 ($7.34)
Miscellaneous Commercial Activities - Other: $210,000 ($2.99)
- Electric Utilities - Interest on Debt: $1,152,000 ($16.39)
- General - Interest on Debt: $6,973,000 ($99.19)
- Other Capital Outlay - Police Protection: $107,000 ($1.52)
General - Other: $89,000 ($1.27)
Transit Utilities: $17,000 ($0.24)
Local Fire Protection: $15,000 ($0.21)
- Water Utilities - Interest on Debt: $6,838,000 ($97.27)
San Marcos government finances - Revenue in 2021 (per resident):
- Charges - Sewerage: $27,374,000 ($389.38)
Solid Waste Management: $4,595,000 ($65.36)
Other: $888,000 ($12.63)
Parks and Recreation: $643,000 ($9.15)
Air Transportation: $531,000 ($7.55)
Miscellaneous Commercial Activities: $118,000 ($1.68)
- Miscellaneous - Interest Earnings: $5,193,000 ($73.87)
General Revenue - Other: $3,530,000 ($50.21)
Fines and Forfeits: $1,117,000 ($15.89)
Rents: $118,000 ($1.68)
Donations From Private Sources: $68,000 ($0.97)
- Revenue - Electric Utilities: $62,367,000 ($887.14)
Water Utilities: $25,499,000 ($362.71)
Transit Utilities: $15,000 ($0.21)
- State Intergovernmental - Highways: $5,226,000 ($74.34)
Housing and Community Development: $3,060,000 ($43.53)
Other: $2,622,000 ($37.30)
Health and Hospitals: $1,542,000 ($21.93)
General Local Government Support: $509,000 ($7.24)
- Tax - General Sales and Gross Receipts: $38,328,000 ($545.20)
Property: $32,468,000 ($461.84)
Public Utilities Sales: $9,536,000 ($135.65)
Other Selective Sales: $4,091,000 ($58.19)
Other License: $3,408,000 ($48.48)
Occupation and Business License - Other: $62,000 ($0.88)
San Marcos government finances - Debt in 2021 (per resident):
- Long Term Debt - Beginning Outstanding - Unspecified Public Purpose: $363,030,000 ($5163.94)
Outstanding Unspecified Public Purpose: $342,040,000 ($4865.36)
Retired Unspecified Public Purpose: $20,990,000 ($298.57)
San Marcos government finances - Cash and Securities in 2021 (per resident):
- Bond Funds - Cash and Securities: $42,409,000 ($603.25)
- Other Funds - Cash and Securities: $217,827,000 ($3098.49)
- Sinking Funds - Cash and Securities: $12,922,000 ($183.81)
14.15% of this county's 2021 resident taxpayers lived in other counties in 2020 ($90,711 average adjusted gross income)
| Here: | 14.15% |
| Texas average: | 8.12% |
0.02% of residents moved from foreign countries ($81 average AGI)
Hays County: 0.02% Texas average: 0.04%
Top counties from which taxpayers relocated into this county between 2020 and 2021:
| from Travis County, TX | |
| from Williamson County, TX | |
| from Bexar County, TX |
| Businesses in San Marcos, TX | ||||
| Name | Count | Name | Count | |
|---|---|---|---|---|
| 7-Eleven | 1 | Journeys | 1 | |
| ALDO | 1 | Juicy Couture | 1 | |
| AT&T | 2 | Justice | 2 | |
| Academy Sports + Outdoors | 1 | KFC | 1 | |
| Aeropostale | 2 | Knights Inn | 1 | |
| Aerosoles | 1 | La Quinta | 1 | |
| American Eagle Outfitters | 1 | Lane Bryant | 1 | |
| Ann Taylor | 2 | Lane Furniture | 1 | |
| Arby's | 1 | Levi Strauss & Co. | 1 | |
| AutoZone | 2 | Little Caesars Pizza | 1 | |
| Banana Republic | 2 | Long John Silver's | 1 | |
| Bath & Body Works | 2 | Lowe's | 1 | |
| Baymont Inn | 1 | Marshalls | 1 | |
| Bed Bath & Beyond | 1 | MasterBrand Cabinets | 2 | |
| Best Western | 1 | Maurices | 1 | |
| Blockbuster | 1 | McDonald's | 4 | |
| Brooks Brothers | 1 | Motel 6 | 1 | |
| Burger King | 2 | Motherhood Maternity | 1 | |
| CVS | 2 | New York & Co | 1 | |
| Carl\s Jr. | 1 | Nike | 1 | |
| Casual Male XL | 1 | Nissan | 1 | |
| Charlotte Russe | 1 | Office Depot | 1 | |
| Chevrolet | 1 | Old Navy | 1 | |
| Chick-Fil-A | 2 | Outback | 1 | |
| Chico's | 1 | Outback Steakhouse | 1 | |
| Chipotle | 1 | Pac Sun | 1 | |
| Church's Chicken | 2 | Panda Express | 2 | |
| Clarks | 1 | Papa John's Pizza | 1 | |
| Coldwater Creek | 1 | Payless | 1 | |
| Comfort Suites | 1 | PetSmart | 1 | |
| Cracker Barrel | 1 | Pizza Hut | 1 | |
| Crate & Barrel | 1 | Popeyes | 1 | |
| Cricket Wireless | 4 | Pottery Barn | 1 | |
| Curves | 1 | Pottery Barn Kids | 1 | |
| Days Inn | 1 | Quiznos | 1 | |
| Discount Tire | 1 | RadioShack | 1 | |
| Domino's Pizza | 1 | Ramada | 1 | |
| DressBarn | 2 | Red Lobster | 1 | |
| Dressbarn | 2 | Red Roof Inn | 1 | |
| Econo Lodge | 1 | Rodeway Inn | 1 | |
| Eddie Bauer | 1 | Rue21 | 1 | |
| Express | 1 | SAS Shoes | 1 | |
| Famous Footwear | 2 | SONIC Drive-In | 3 | |
| FedEx | 7 | Sam's Club | 1 | |
| Firestone Complete Auto Care | 1 | Sears | 1 | |
| Ford | 1 | Sephora | 1 | |
| GNC | 2 | Shoe Carnival | 1 | |
| GameStop | 1 | Skechers USA | 1 | |
| Gap | 1 | Soma Intimates | 1 | |
| Goodwill | 1 | Sprint Nextel | 1 | |
| Gymboree | 1 | Starbucks | 4 | |
| H&R Block | 1 | Subway | 6 | |
| Haagen-Dazs | 1 | Super 8 | 1 | |
| Hilton | 1 | T-Mobile | 3 | |
| Hobby Lobby | 1 | Taco Bell | 2 | |
| Holiday Inn | 1 | Talbots | 1 | |
| Honda | 1 | Toyota | 1 | |
| Hot Topic | 1 | Travelodge | 1 | |
| Howard Johnson | 1 | True Value | 1 | |
| IHOP | 1 | U-Haul | 5 | |
| IZOD | 2 | UPS | 11 | |
| J.Crew | 1 | Vans | 5 | |
| JCPenney | 1 | Verizon Wireless | 2 | |
| Jimmy John's | 1 | Victoria's Secret | 1 | |
| JoS. A. Bank | 1 | Walgreens | 2 | |
| Johnny Rockets | 1 | Walmart | 1 | |
| Jones New York | 3 | Wendy's | 2 | |
Strongest AM radio stations in San Marcos:
- KUOL (1470 AM; 0 kW; SAN MARCOS, TX; Owner: SM RADIO, INC.)
- WOAI (1200 AM; 50 kW; SAN ANTONIO, TX; Owner: CCB TEXAS LICENSES, L.P.)
- KTKR (760 AM; 50 kW; SAN ANTONIO, TX; Owner: CCB TEXAS LICENSES, L.P.)
- KKYX (680 AM; 50 kW; SAN ANTONIO, TX; Owner: CXR HOLDINGS, INC.)
- KSAH (720 AM; 10 kW; UNIVERSAL CITY, TX; Owner: KSAH LICENSING, INC.)
- KQQA (1530 AM; 10 kW; CREEDMOOR, TX; Owner: YELLOW ROSE COMMUNICATIONS, INC.)
- KDRY (1100 AM; 11 kW; ALAMO HEIGHTS, TX; Owner: KDRY RADIO, INC.)
- KENS (1160 AM; 25 kW; SAN ANTONIO, TX; Owner: KENS-TV, INC.)
- KLBJ (590 AM; 5 kW; AUSTIN, TX; Owner: EMMIS AUSTIN RADIO BROADCASTING COMPANY, L.P.)
- KTSA (550 AM; 5 kW; SAN ANTONIO, TX; Owner: INFINITY BROADCASTING CORPORATION OF SAN ANTONIO)
- KSLR (630 AM; 5 kW; SAN ANTONIO, TX; Owner: SALEM MEDIA OF TEXAS, INC.)
- KLUP (930 AM; 5 kW; TERRELL HILLS, TX; Owner: SOUTH TEXAS BROADCASTING, INC.)
- WMOP (900 AM; 5 kW; OCALA, FL; Owner: FLORIDA SPORTSTALK, INC.)
Strongest FM radio stations in San Marcos:
- K203CX (88.1 FM; SAN MARCOS, TX; Owner: HOUSTON CHRISTIAN BROADCASTERS, INC.)
- KEYI-FM (103.5 FM; SAN MARCOS, TX; Owner: EMMIS AUSTIN RADIO BROADCASTING COMPANY, L.P.)
- KVET-FM (98.1 FM; AUSTIN, TX; Owner: CAPSTAR TX LIMITED PARTNERSHIP)
- KASE-FM (100.7 FM; AUSTIN, TX; Owner: CAPSTAR TX LIMITED PARTNERSHIP)
- KAMX (94.7 FM; LULING, TX; Owner: TEXAS INFINITY RADIO L.P.)
- KKMJ-FM (95.5 FM; AUSTIN, TX; Owner: TEXAS INFINITY RADIO L.P.)
- KMFA (89.5 FM; AUSTIN, TX; Owner: CAPITOL BROADCASTING ASSOCIATION, INC)
- KLBJ-FM (93.7 FM; AUSTIN, TX; Owner: EMMIS AUSTIN RADIO BROADCASTING COMPANY, L.P.)
- KPEZ (102.3 FM; AUSTIN, TX; Owner: CCB TEXAS LICENSES, L.P.)
- KXXM (96.1 FM; SAN ANTONIO, TX; Owner: CCB TEXAS LICENSES, L.P.)
- KXTN-FM (107.5 FM; SAN ANTONIO, TX; Owner: TICHENOR LICENSE CORPORATION ("TLC"))
- KDHT (93.3 FM; CEDAR PARK, TX; Owner: EMMIS AUSTIN RADIO BROADCASTING COMPANY, L.P.)
- KNBT (92.1 FM; NEW BRAUNFELS, TX; Owner: NEW BRAUNFELS COMMUNICATIONS, INC.)
- KCYY (100.3 FM; SAN ANTONIO, TX; Owner: CXR HOLDINGS, INC.)
- KROM (92.9 FM; SAN ANTONIO, TX; Owner: TICHENOR LICENSE CORPORATION ("TLC"))
- KHHL (98.9 FM; LEANDER, TX; Owner: AMIGO RADIO, LTD.)
- KSMG (105.3 FM; SEGUIN, TX; Owner: CXR HOLDINGS, INC.)
- KQQT (106.3 FM; GONZALES, TX; Owner: CENTRAL TEXAS RADIO, INC.)
- KFMK (105.9 FM; ROUND ROCK, TX; Owner: CAPSTAR TX LIMITED PARTNERSHIP)
- KUT (90.5 FM; AUSTIN, TX; Owner: THE UNIVERSITY OF TEXAS AT AUSTIN)
TV broadcast stations around San Marcos:
- KTXU-LP (Channel 38; SAN MARCOS, TX; Owner: GERALD G. BENAVIDES)
- KHPM-CA (Channel 40; SAN MARCOS, TX; Owner: KXAN, INC.)
- KTDF-LP (Channel 18; SAN ANTONIO, TX; Owner: JOSEPH W. SHAFFER)
- KTBC (Channel 7; AUSTIN, TX; Owner: KTBC LICENSE, INC.)
- KEYE-TV (Channel 42; AUSTIN, TX; Owner: CBS STATIONS GROUP OF TEXAS L.P.)
- KRRT (Channel 35; KERRVILLE, TX; Owner: SAN ANTONIO (KRRT-TV) LICENSEE, INC.)
- KVUE (Channel 24; AUSTIN, TX; Owner: KVUE TELEVISION, INC.)
- KQUX-CA (Channel 11; AUSTIN, TX; Owner: LOUIS MARTINEZ FAMILY GROUP, LLC)
- KLRU (Channel 18; AUSTIN, TX; Owner: CAPITAL OF TEXAS PUBLIC TELECOMMUNICATIONS COUNCIL)
- KXAN-TV (Channel 36; AUSTIN, TX; Owner: KXAN, INC.)
- KNVA (Channel 54; AUSTIN, TX; Owner: 54 BROADCASTING, INC.)
- KENS-TV (Channel 5; SAN ANTONIO, TX; Owner: KENS-TV, INC.)
- KBVO-CA (Channel 49; AUSTIN, TX; Owner: KXAN, INC.)
- KVDA (Channel 60; SAN ANTONIO, TX; Owner: TELEMUNDO OF TEXAS PARTNERSHIP, LP)
- KABB (Channel 29; SAN ANTONIO, TX; Owner: KABB LICENSEE, LLC)
- KBEJ (Channel 2; FREDERICKSBURG, TX; Owner: CORRIDOR TELEVISION, L.L.P.)
- WOAI-TV (Channel 4; SAN ANTONIO, TX; Owner: CCB TEXAS LICENSES, L.P.)
- KNTA-LP (Channel 62; NEW BRAUNFELS, TX; Owner: ARACELIS ORTIZ, EXECUTRIX OF THE ESTATE OF CARLOS ORTIZ)
- KWEX-TV (Channel 41; SAN ANTONIO, TX; Owner: KWEX LICENSE PARTNERSHIP, L.P.)
- KSAT-TV (Channel 12; SAN ANTONIO, TX; Owner: POST-NEWSWEEK STATIONS, SAN ANTONIO, LP)
- KSAA-LP (Channel 28; SAN ANTONIO, TX; Owner: MAKO COMMUNICATIONS, LLC)
- K34FM (Channel 34; AUSTIN, TX; Owner: TRINITY BROADCASTING NETWORK)
- KXTM-LP (Channel 21; SAN ANTONIO, TX; Owner: HUMBERTO LOPEZ)
- KAKW (Channel 62; KILLEEN, TX; Owner: KAKW LICENSE PARTNERSHIP, L.P.)
- KGBS-CA (Channel 65; AUSTIN, TX; Owner: CABALLERO TELEVISION AUSTIN, INC.)
Medal of Honor Recipients
Medal of Honor Recipient born in San Marcos: Cleto Rodriguez.
- National Bridge Inventory (NBI) Statistics
- 121Number of bridges
- 1,942ft / 592mTotal length
- $792,000Total costs
- 3,419,614Total average daily traffic
- 476,444Total average daily truck traffic
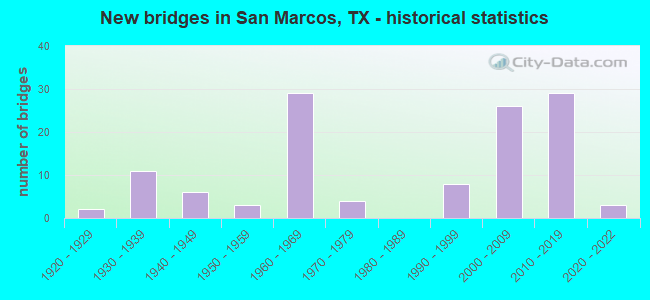
- New bridges - historical statistics
- 21920-1929
- 111930-1939
- 61940-1949
- 31950-1959
- 291960-1969
- 41970-1979
- 81990-1999
- 262000-2009
- 292010-2019
- 32020-2022
FCC Registered Antenna Towers: 243 (See the full list of FCC Registered Antenna Towers)
FCC Registered Private Land Mobile Towers: 10 (See the full list of FCC Registered Private Land Mobile Towers in San Marcos, TX)
FCC Registered Broadcast Land Mobile Towers: 66 (See the full list of FCC Registered Broadcast Land Mobile Towers)
FCC Registered Microwave Towers: 81 (See the full list of FCC Registered Microwave Towers in this town)
FCC Registered Paging Towers: 11 (See the full list of FCC Registered Paging Towers)
FCC Registered Maritime Coast & Aviation Ground Towers: 6 (See the full list of FCC Registered Maritime Coast & Aviation Ground Towers)
FCC Registered Amateur Radio Licenses: 181 (See the full list of FCC Registered Amateur Radio Licenses in San Marcos)
FAA Registered Aircraft Manufacturers and Dealers: 2 (See the full list of FAA Registered Manufacturers and Dealers in San Marcos)
FAA Registered Aircraft: 87 (See the full list of FAA Registered Aircraft)
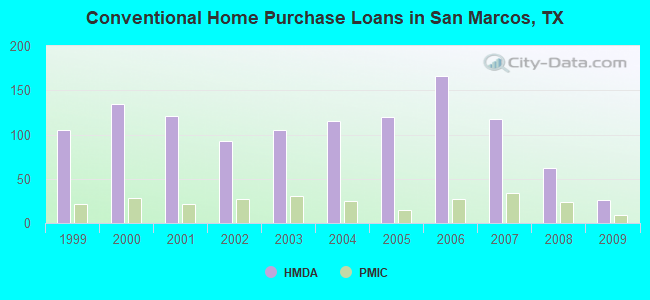
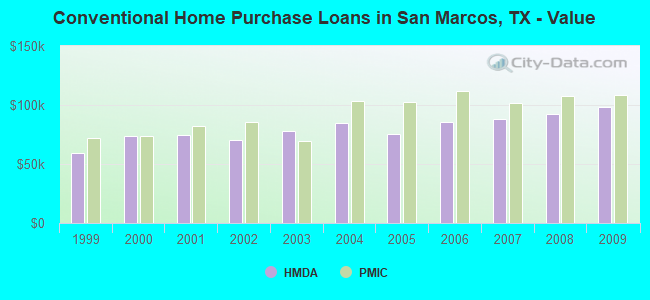
| Home Mortgage Disclosure Act Aggregated Statistics For Year 2009 (Based on 2 full and 4 partial tracts) | ||||||||||||||
| A) FHA, FSA/RHS & VA Home Purchase Loans | B) Conventional Home Purchase Loans | C) Refinancings | D) Home Improvement Loans | E) Loans on Dwellings For 5+ Families | F) Non-occupant Loans on < 5 Family Dwellings (A B C & D) | G) Loans On Manufactured Home Dwelling (A B C & D) | ||||||||
|---|---|---|---|---|---|---|---|---|---|---|---|---|---|---|
| Number | Average Value | Number | Average Value | Number | Average Value | Number | Average Value | Number | Average Value | Number | Average Value | Number | Average Value | |
| LOANS ORIGINATED | 29 | $126,861 | 26 | $98,269 | 44 | $112,973 | 11 | $43,449 | 3 | $297,390 | 21 | $90,870 | 7 | $45,844 |
| APPLICATIONS APPROVED, NOT ACCEPTED | 2 | $120,715 | 7 | $81,177 | 7 | $91,736 | 2 | $26,990 | 0 | $0 | 3 | $83,627 | 5 | $36,344 |
| APPLICATIONS DENIED | 5 | $124,930 | 13 | $77,195 | 20 | $104,646 | 11 | $32,370 | 0 | $0 | 9 | $97,442 | 5 | $49,090 |
| APPLICATIONS WITHDRAWN | 5 | $102,360 | 4 | $97,092 | 7 | $111,861 | 1 | $80,540 | 0 | $0 | 2 | $124,655 | 1 | $31,070 |
| FILES CLOSED FOR INCOMPLETENESS | 4 | $119,750 | 1 | $162,000 | 2 | $129,445 | 1 | $18,730 | 0 | $0 | 0 | $0 | 0 | $0 |
Detailed HMDA statistics for the following Tracts: 0101.00 , 0102.00, 0103.01, 0103.02, 0104.00, 0105.00
| Private Mortgage Insurance Companies Aggregated Statistics For Year 2009 (Based on 2 full and 4 partial tracts) | ||||||
| A) Conventional Home Purchase Loans | B) Refinancings | C) Non-occupant Loans on < 5 Family Dwellings (A & B) | ||||
|---|---|---|---|---|---|---|
| Number | Average Value | Number | Average Value | Number | Average Value | |
| LOANS ORIGINATED | 9 | $108,698 | 1 | $89,850 | 2 | $75,175 |
| APPLICATIONS APPROVED, NOT ACCEPTED | 4 | $143,710 | 0 | $0 | 0 | $0 |
| APPLICATIONS DENIED | 4 | $93,605 | 0 | $0 | 0 | $0 |
| APPLICATIONS WITHDRAWN | 0 | $0 | 0 | $0 | 0 | $0 |
| FILES CLOSED FOR INCOMPLETENESS | 0 | $0 | 0 | $0 | 0 | $0 |
Detailed PMIC statistics for the following Tracts: 0101.00 , 0102.00, 0103.01, 0103.02, 0104.00, 0105.00
2003 - 2018 National Fire Incident Reporting System (NFIRS) incidents
- Fire incident types reported to NFIRS in San Marcos, TX
- 1,98753.6%Outside Fires
- 1,02127.5%Structure Fires
- 65117.6%Mobile Property/Vehicle Fires
- 481.3%Other
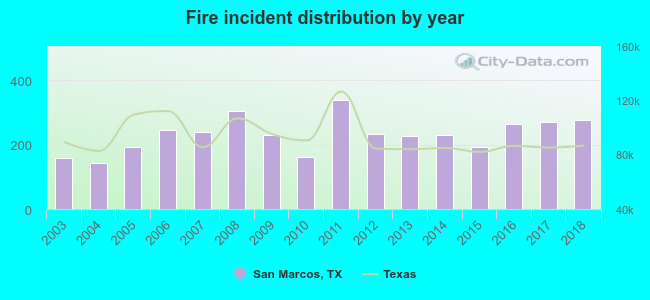 According to the data from the years 2003 - 2018 the average number of fires per year is 232. The highest number of reported fire incidents - 337 took place in 2011, and the least - 143 in 2004. The data has a growing trend.
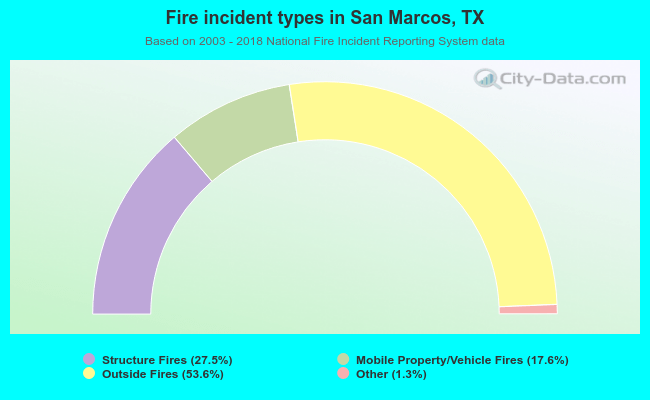 When looking into fire subcategories, the most incidents belonged to: Outside Fires (53.6%), and Structure Fires (27.5%).
Fire-safe hotels and motels in San Marcos, Texas:
- Americas Best Value Inn, 1507 Ih-35 N, San Marcos, Texas 78666 , Phone: (512) 396-6060
- Motel 6 #0334 San Amrcos, 1321 Ih-35, San Marcos, Texas 78666 , Phone: (512) 369-8705, Fax: (512) 396-7162
- La Quinta Inn-San Marcos, 1619 Ih 35, San Marcos, Texas 78666 , Phone: (512) 392-8800, Fax: (512) 392-0324
- Baymont Inn & Suites San Marcos, 4210 Ih-35 S, San Marcos, Texas 78666 , Phone: (512) 392-6800, Fax: (512) 392-6847
- Comfort Inn San Marcos, 1611 I-35 N, San Marcos, Texas 78666 , Phone: (512) 396-5665, Fax: (512) 353-7774
- Ramada Limited, 1701 N I- 35, San Marcos, Texas 78666 , Phone: (512) 395-8000, Fax: (512) 395-8006
- Knights Inn, 801 I H 35 N, San Marcos, Texas 78666 , Phone: (512) 353-1303, Fax: (512) 353-2061
- Rodeway Inn, 1635 Aquarena Springs Dr, San Marcos, Texas 78666 , Phone: (512) 353-8011, Fax: (512) 396-8062
- 17 other hotels and motels
| Most common first names in San Marcos, TX among deceased individuals | ||
| Name | Count | Lived (average) |
|---|---|---|
| Mary | 107 | 77.3 years |
| James | 99 | 71.8 years |
| William | 95 | 78.1 years |
| John | 90 | 72.7 years |
| Maria | 84 | 78.1 years |
| Robert | 75 | 72.3 years |
| Jose | 69 | 76.0 years |
| Juan | 53 | 73.3 years |
| Ruth | 50 | 83.6 years |
| Charles | 45 | 75.7 years |
| Most common last names in San Marcos, TX among deceased individuals | ||
| Last name | Count | Lived (average) |
|---|---|---|
| Rodriguez | 94 | 74.4 years |
| Smith | 64 | 77.6 years |
| Martinez | 59 | 69.1 years |
| Williams | 58 | 78.4 years |
| Garcia | 48 | 72.8 years |
| Hernandez | 45 | 77.2 years |
| Gonzales | 44 | 73.6 years |
| Flores | 41 | 75.9 years |
| Garza | 39 | 74.8 years |
| Perez | 33 | 66.1 years |
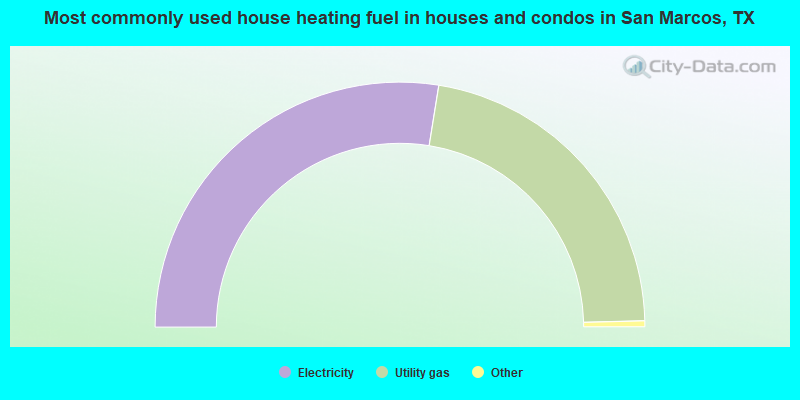
- 55.1%Electricity
- 44.1%Utility gas
- 0.5%Bottled, tank, or LP gas
- 0.2%Wood
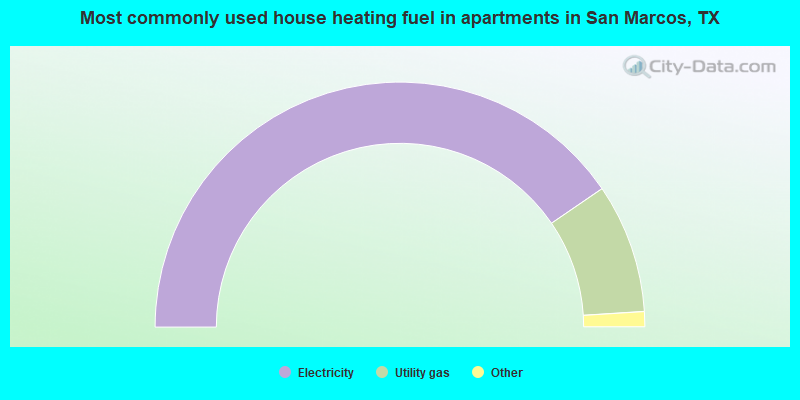
- 80.9%Electricity
- 17.1%Utility gas
- 1.7%Bottled, tank, or LP gas
- 0.2%No fuel used
San Marcos compared to Texas state average:
- Unemployed percentage below state average.
- Hispanic race population percentage above state average.
- Median age below state average.
- Renting percentage above state average.
- Length of stay since moving in below state average.
- Number of rooms per house below state average.
- House age below state average.
- Number of college students significantly above state average.
- Percentage of population with a bachelor's degree or higher above state average.
San Marcos on our top lists:
- #1 on the list of "Top 101 cities with largest percentage of females in occupations: food preparation and serving related occupations (population 50,000+)"
- #1 on the list of "Top 100 cities with highest percentage of college students (pop. 50,000+)"
- #3 on the list of "Top 101 cities with largest percentage of males in occupations: food preparation and serving related occupations (population 50,000+)"
- #4 on the list of "Top 101 cities with largest percentage of females in industries: accommodation and food services (population 50,000+)"
- #4 on the list of "Top 101 cities with largest percentage of females in industries: retail trade (population 50,000+)"
- #7 on the list of "Top 101 cities where the highest percentage of females (15+ years) which never married (with at least 10,000 females in this group)"
- #8 on the list of "Top 101 cities with largest percentage of males in industries: accommodation and food services (population 50,000+)"
- #8 on the list of "Top 101 cities with largest percentage of males in industries: retail trade (population 50,000+)"
- #9 on the list of "Top 101 cities with largest percentage of females in occupations: sales and related occupations (population 50,000+)"
- #9 on the list of "Top 100 cities with highest percentage of renters (pop. 50,000+)"
- #12 on the list of "Top 101 cities where the highest percentage of males (15+ years) which never married (with at least 10,000 males in this group)"
- #12 on the list of "Top 100 cities with youngest residents (pop. 50,000+)"
- #21 on the list of "Top 100 cities with strongest arts, entertainment, recreation, accommodation and food services industries (pop. 50,000+)"
- #24 on the list of "Top 101 cities with largest percentage of males in occupations: arts, design, entertainment, sports, and media occupations (population 50,000+)"
- #26 on the list of "Top 100 cities with smallest houses (pop. 50,000+)"
- #35 on the list of "Top 101 cities with the lowest average wind speeds (population 50,000+)"
- #36 on the list of "Top 101 cities with the lowest percentage of family households, population 10,000+"
- #44 on the list of "Top 101 cities with the largest percentage of people in residential treatment centers for emotionally disturbed children (population 1,000+)"
- #50 on the list of "Top 101 cities with largest percentage of males in industries: educational services (population 50,000+)"
- #51 on the list of "Top 101 cities with the largest percentage of people in job corps and vocational training facilities (population 1,000+)"
- #15 on the list of "Top 101 counties with the lowest surface withdrawal of fresh water for public supply (pop. 50,000+)"
- #19 on the list of "Top 101 counties with the highest percentage of residents relocating from other counties between 2010 and 2011 (pop. 50,000+)"
- #31 on the list of "Top 101 counties with the largest number of people moving in compared to moving out (pop. 50,000+)"
- #32 on the list of "Top 101 counties with the lowest number of deaths per 1000 residents 2007-2013 (pop. 50,000+)"
- #36 on the list of "Top 101 counties with highest percentage of residents voting for 3rd party candidates in the 2012 Presidential Election (pop. 50,000+)"

|
|
Total of 156 patent applications in 2008-2024.