Estimated zip code population in 2022: 3,769 Zip code population in 2010: 2,739 Zip code population in 2000: 2,310
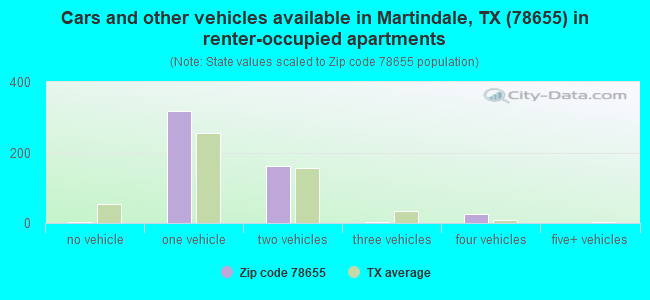
Houses and condos: 1,553 Renter-occupied apartments: 510
% of renters here:
34%
State:
38%
March 2022 cost of living index in zip code 78655: 81.1 (low, U.S. average is 100)
Land area: 35.7 sq. mi. Water area: 0.2 sq. mi.
Population density: 106 people per square mile
(very low).
OSM Map
General Map
Google Map
MSN Map
OSM Map
General Map
Google Map
MSN Map
OSM Map
General Map
Google Map
MSN Map
OSM Map
General Map
Google Map
MSN Map
Please wait while loading the map...
Real estate property taxes paid for housing units in 2022:
This zip code:
1.4% ($3,097)
Texas:
1.5% ($4,050)
Median real estate property taxes paid for housing units with mortgages in 2022: $5,744 (1.7%) Median real estate property taxes paid for housing units with no mortgage in 2022: $2,083 (1.9%)
Averages for the 2020 tax year for zip code 78655, filed in 2021:
Average Adjusted Gross Income (AGI) in 2020: $63,095 (Individual Income Tax Returns)
Here:
$63,095
State:
$77,054
Salary/wage: $49,599 (reported on 81.9% of returns)
Here:
$49,599
State:
$62,766
(% of AGI for various income ranges: 1102.6% for AGIs below $25k, 3732.3% for AGIs $25k-50k, 6568.5% for AGIs $50k-75k, 9151.2% for AGIs $75k-100k, 16477.8% for AGIs $100k-200k)
Taxable interest for individuals: $1,172 (reported on 28.3% of returns)
This zip code:
$1,172
Texas:
$2,665
(% of AGI for various income ranges: 7.4% for AGIs below $25k, 13.0% for AGIs $25k-50k, 19.2% for AGIs $50k-75k, 28.7% for AGIs $75k-100k, 177.8% for AGIs $100k-200k)
Ordinary dividends: $6,871 (reported on 15.2% of returns)
Here:
$6,871
State:
$10,044
(% of AGI for various income ranges: 15.0% for AGIs below $25k, 34.3% for AGIs $25k-50k, 28.5% for AGIs $50k-75k, 181.2% for AGIs $75k-100k, 627.8% for AGIs $100k-200k)
Net capital gain/loss in AGI: +$31,635 (reported on 14.5% of returns)
Here:
+$31,635
State:
+$39,590
(% of AGI for various income ranges: 10.3% for AGIs below $25k, 24.7% for AGIs $25k-50k, 216.9% for AGIs $50k-75k, 123.8% for AGIs $75k-100k, 993.3% for AGIs $100k-200k)
Profit/loss from business: +$13,644 (reported on 18.1% of returns)
Here:
+$13,644
State:
+$10,888
(% of AGI for various income ranges: 170.6% for AGIs below $25k, 225.7% for AGIs $25k-50k, 367.7% for AGIs $50k-75k, 997.8% for AGIs $100k-200k)
Taxable individual retirement arrangement distribution: $26,867 (reported on 6.5% of returns)
78655:
$26,867
Texas:
$24,740
(% of AGI for various income ranges: 70.0% for AGIs $25k-50k, 478.5% for AGIs $50k-75k, 1762.2% for AGIs $100k-200k)
Total itemized deductions: $31,133 (reported on 4.3% of returns)
Here:
$31,133
State:
$40,428
(% of AGI for various income ranges: 593.1% for AGIs $50k-75k, 1218.9% for AGIs $100k-200k)
Charity contributions: $12,825 (reported on 2.9% of returns)
Here:
$12,825
State:
$18,201
(% of AGI for various income ranges: 570.0% for AGIs $100k-200k)
Taxes paid: $6,783 (reported on 4.3% of returns)
78655:
$6,783
State:
$7,821
(% of AGI for various income ranges: 118.5% for AGIs $50k-75k, 281.1% for AGIs $100k-200k)
Earned income credit: $2,454 (reported on 18.8% of returns)
Here:
$2,454
State:
$2,584
(% of AGI for various income ranges: 116.5% for AGIs below $25k, 80.7% for AGIs $25k-50k)
Percentage of individuals using paid preparers for their 2020 taxes: 92.0%
Here:
92%
State:
92%
(% for various income ranges: 93.3% for AGIs below $25k, 92.3% for AGIs $25k-50k, 90.0% for AGIs $50k-75k, 91.7% for AGIs $75k-100k, 93.8% for AGIs $100k-200k, 83.3% for AGIs over 200k)
Averages for the 2012 tax year for zip code 78655, filed in 2013:
Average Adjusted Gross Income (AGI) in 2012: $48,714 (Individual Income Tax Returns)
Here:
$48,714
State:
$65,384
Salary/wage: $40,650 (reported on 84.2% of returns)
Here:
$40,650
State:
$52,524
(% of AGI for various income ranges: 78.3% for AGIs below $25k, 82.2% for AGIs $25k-50k, 81.5% for AGIs $50k-75k, 78.9% for AGIs $75k-100k, 93.6% for AGIs $100k-200k)
Taxable interest for individuals: $1,490 (reported on 25.0% of returns)
This zip code:
$1,490
Texas:
$2,372
(% of AGI for various income ranges: 0.5% for AGIs below $25k, 0.3% for AGIs $25k-50k, 0.4% for AGIs $50k-75k, 2.6% for AGIs $100k-200k)
Ordinary dividends: $5,014 (reported on 11.7% of returns)
Here:
$5,014
State:
$9,721
(% of AGI for various income ranges: 1.0% for AGIs below $25k, 0.8% for AGIs $25k-50k, 0.6% for AGIs $50k-75k, 1.2% for AGIs $75k-100k, 3.0% for AGIs $100k-200k)
Net capital gain/loss in AGI: +$15,842 (reported on 10.0% of returns)
Here:
+$15,842
State:
+$35,319
(% of AGI for various income ranges: 0.3% for AGIs $25k-50k, 14.3% for AGIs $100k-200k)
Profit/loss from business: +$16,613 (reported on 19.2% of returns)
Here:
+$16,613
State:
+$13,732
(% of AGI for various income ranges: 14.3% for AGIs below $25k, 3.8% for AGIs $25k-50k, 6.6% for AGIs $50k-75k, 14.0% for AGIs $100k-200k)
Taxable individual retirement arrangement distribution: $15,575 (reported on 6.7% of returns)
78655:
$15,575
Texas:
$19,511
(% of AGI for various income ranges: 1.2% for AGIs below $25k, 3.1% for AGIs $25k-50k, 6.2% for AGIs $100k-200k)
Total itemized deductions: $18,213 (18% of AGI, reported on 19.2% of returns)
Here:
$18,213
State:
$24,724
Here:
17.5% of AGI
State:
15.9% of AGI
(% of AGI for various income ranges: 9.0% for AGIs $25k-50k, 8.7% for AGIs $50k-75k, 9.0% for AGIs $75k-100k, 8.4% for AGIs $100k-200k, 5.1% for AGIs over 200k)
Charity contributions: $2,959 (reported on 14.2% of returns)
Here:
$2,959
State:
$6,808
(% of AGI for various income ranges: 0.6% for AGIs $25k-50k, 1.0% for AGIs $50k-75k, 1.0% for AGIs $75k-100k, 2.0% for AGIs $100k-200k)
Taxes paid: $5,855 (reported on 18.3% of returns)
78655:
$5,855
State:
$6,921
(% of AGI for various income ranges: 2.4% for AGIs $25k-50k, 2.5% for AGIs $50k-75k, 2.7% for AGIs $75k-100k, 2.8% for AGIs $100k-200k, 1.9% for AGIs over 200k)
Earned income credit: $2,545 (reported on 24.2% of returns)
Here:
$2,545
State:
$2,570
(% of AGI for various income ranges: 9.1% for AGIs below $25k, 1.3% for AGIs $25k-50k)
Percentage of individuals using paid preparers for their 2012 taxes: 44.2%
Here:
44%
State:
51%
(% for various income ranges: 42.0% for AGIs below $25k, 42.4% for AGIs $25k-50k, 37.5% for AGIs $50k-75k, 44.4% for AGIs $75k-100k, 60.0% for AGIs $100k-200k, 100.0% for AGIs over 200k)
Averages for the 2004 tax year for zip code 78655, filed in 2005:
Average Adjusted Gross Income (AGI) in 2004: $35,758 (Individual Income Tax Returns)
Here:
$35,758
State:
$47,881
Salary/wage: $32,059 (reported on 88.7% of returns)
Here:
$32,059
State:
$41,947
(% of AGI for various income ranges: 103.4% for AGIs below $10k, 85.7% for AGIs $10k-25k, 85.3% for AGIs $25k-50k, 85.1% for AGIs $50k-75k, 84.1% for AGIs $75k-100k, 58.1% for AGIs over 100k)
Taxable interest for individuals: $1,453 (reported on 27.5% of returns)
This zip code:
$1,453
Texas:
$2,255
(% of AGI for various income ranges: 3.9% for AGIs below $10k, 0.8% for AGIs $10k-25k, 0.7% for AGIs $25k-50k, 0.5% for AGIs $50k-75k, 0.2% for AGIs $75k-100k, 2.6% for AGIs over 100k)
Taxable dividends: $2,567 (reported on 13.6% of returns)
Here:
$2,567
State:
$4,261
(% of AGI for various income ranges: 0.6% for AGIs below $10k, 0.7% for AGIs $10k-25k, 0.5% for AGIs $25k-50k, 0.4% for AGIs $50k-75k, 0.8% for AGIs $75k-100k, 2.4% for AGIs over 100k)
Net capital gain/loss: +$2,391 (reported on 11.5% of returns)
Here:
+$2,391
State:
+$16,110
(% of AGI for various income ranges: 0.6% for AGIs below $10k, -0.2% for AGIs $10k-25k, -0.0% for AGIs $25k-50k, 1.6% for AGIs $50k-75k, 0.1% for AGIs $75k-100k, 2.0% for AGIs over 100k)
Profit/loss from business: +$10,737 (reported on 15.1% of returns)
Here:
+$10,737
State:
+$11,013
(% of AGI for various income ranges: -7.4% for AGIs below $10k, 6.1% for AGIs $10k-25k, 4.7% for AGIs $25k-50k, 4.0% for AGIs $50k-75k, 0.1% for AGIs $75k-100k, 7.9% for AGIs over 100k)
IRA payment deduction: $2,789 (reported on 1.6% of returns)
78655:
$2,789
Texas:
$3,120
Total itemized deductions: $16,187 (22% of AGI, reported on 18.9% of returns)
Here:
$16,187
State:
$19,631
Here:
21.7% of AGI
State:
18.9% of AGI
(% of AGI for various income ranges: 5.0% for AGIs $10k-25k, 6.2% for AGIs $25k-50k, 9.3% for AGIs $50k-75k, 14.3% for AGIs $75k-100k, 10.4% for AGIs over 100k)
Charity contributions deductions: $2,828 (3% of AGI, reported on 14.1% of returns)
Here:
$2,828
State:
$4,753
Here:
3.4% of AGI
State:
4.2% of AGI
(% of AGI for various income ranges: 1.0% for AGIs $25k-50k, 0.8% for AGIs $50k-75k, 1.5% for AGIs $75k-100k, 2.2% for AGIs over 100k)
Total tax: $5,033 (reported on 68.2% of returns)
78655:
$5,033
State:
$9,058
(% of AGI for various income ranges: 2.3% for AGIs below $10k, 3.6% for AGIs $10k-25k, 6.7% for AGIs $25k-50k, 8.7% for AGIs $50k-75k, 10.6% for AGIs $75k-100k, 17.9% for AGIs over 100k)
Earned income credit: $1,857 (reported on 24.2% of returns)
Here:
$1,857
State:
$2,024
Percentage of individuals using paid preparers for their 2004 taxes: 51.7%
Here:
52%
State:
57%
(% for various income ranges: 42.1% for AGIs below $10k, 51.2% for AGIs $10k-25k, 53.6% for AGIs $25k-50k, 58.4% for AGIs $50k-75k, 55.2% for AGIs $75k-100k, 65.5% for AGIs over 100k)
Household received Food Stamps/SNAP in the past 12 months: 294 Household did not receive Food Stamps/SNAP in the past 12 months: 1,191
Women who had a birth in the past 12 months: 33 (25 now married, 7 unmarried) Women who did not have a birth in the past 12 months: 878 (414 now married, 463 unmarried)
Housing units in zip code 78655 with a mortgage: 366 (7 second mortgage, 8 both second mortgage and home equity loan) Houses without a mortgage: 8
Median monthly owner costs for units with a mortgage: $1,980 Median monthly owner costs for units without a mortgage: $474
Residents with income below the poverty level in 2022:
This zip code:
12.8%
Whole state:
14.0%
Residents with income below 50% of the poverty level in 2022:
This zip code:
5.4%
Whole state:
7.4%
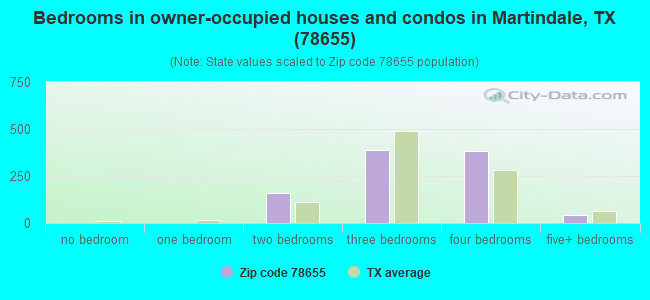
Median number of rooms in houses and condos:
Here:
5.4
State:
6.3
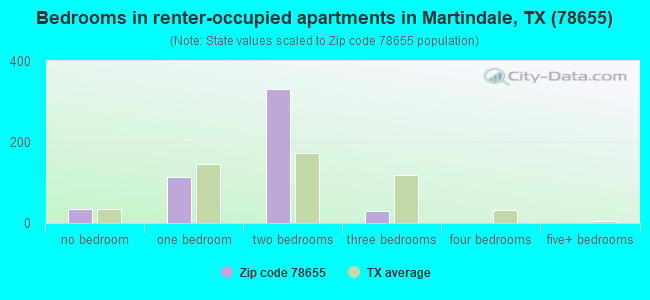
Median number of rooms in apartments:
Here:
5.4
State:
4.0
Notable locations in this zip code not listed on our city pages
Size of family households: 238 2-persons, 307 3-persons, 135 4-persons, 99 5-persons, 83 6-persons
Size of nonfamily households: 341 1-person, 254 2-persons, 28 3-persons
583 married couples with children.
61 single-parent households (61 women).
61.9% of residents of 78655 zip code speak English at home.
35.2% of residents speak Spanish at home (62% very well, 10% well, 28% not well).
1.0% of residents speak other Indo-European language at home (85% very well, 15% not at all).
0.5% of residents speak Asian or Pacific Island language at home (28% well, 72% not well).
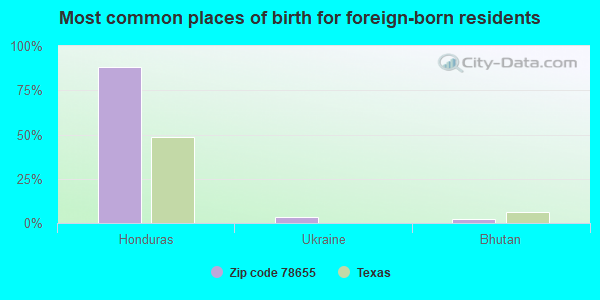
Foreign born population: 599 (15.9%) (22.0% of them are naturalized citizens)
This zip code:
15.9%
Whole state:
17.2%
88%Honduras
3%Ukraine
2%Bhutan
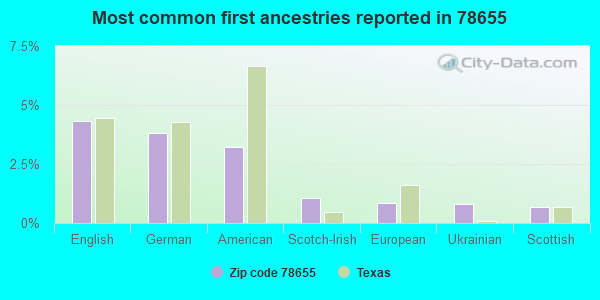
4%English
4%German
3%American
1%Scotch-Irish
1%European
1%Ukrainian
1%Scottish
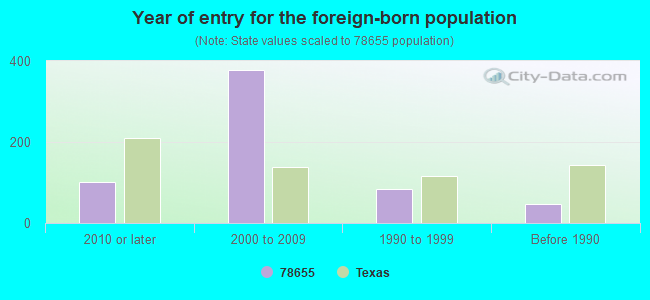
Year of entry for the foreign-born population
1012010 or later
3782000 to 2009
831990 to 1999
46Before 1990
Housing units lacking complete plumbing facilities: 4.2% Housing units lacking complete kitchen facilities: 3.4%
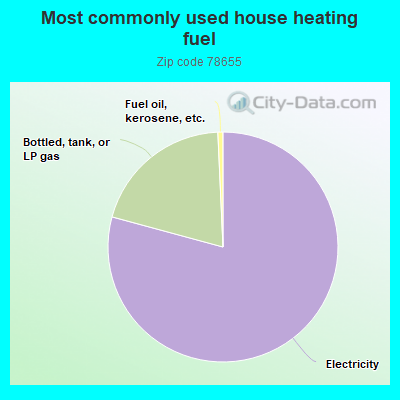
79.3%Electricity
20.1%Bottled, tank, or LP gas
0.7%Fuel oil, kerosene, etc.
Population in 1990: 2,081. Population change in the 1990s: +229 (+11.0%).
Place of birth for U.S.-born residents:
This state: 2,458
Northeast: 24
Midwest: 441
South: 145
West: 49
59% of the 78655 zip code residents lived in the same house 5 years ago. Out of people who lived in different houses, 19% lived in this county. Out of people who lived in different counties, 50% lived in Texas.
93% of the 78655 zip code residents lived in the same house 1 year ago. Out of people who lived in different houses, 6% moved from this county. Out of people who lived in different houses, 90% moved from different county within same state. Out of people who lived in different houses, 10% moved from different state.
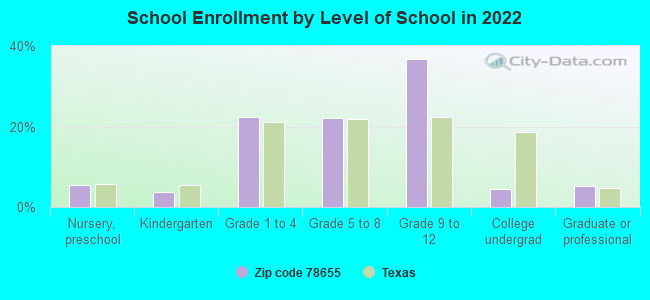
Private vs. public school enrollment:
Students in private schools in grades 1 to 8 (elementary and middle school): 1
Here:
0.9%
Texas:
8.8%
Students in private schools in grades 9 to 12 (high school): 10
Here:
5.6%
Texas:
8.0%
Students in private undergraduate colleges:
Here:
0.0%
Texas:
16.2%
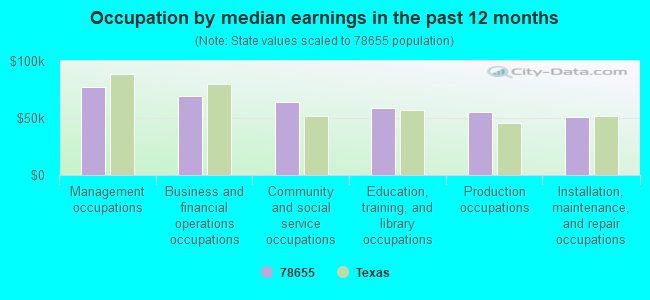
Occupation by median earnings in the past 12 months ($)
77,167Management occupations
69,403Business and financial operations occupations
63,948Community and social service occupations
58,426Education, training, and library occupations
55,267Production occupations
50,780Installation, maintenance, and repair occupations
Companies with federal contracts located in this zip code:
DUSSETSCHLEGER''S AIR CONDITIO (115 HUMPHREY CT in MARTINDALE, TX; small business)
$10,700 with Army for Maintenance, Repair or Alteration of Real Property -- Office Buildings. Signed on 2002-12-19. Completion date: 2002-12-31.
Top industries in this zip code by the number of employees in 2005:
Other Services (except Public Administration): Religious Organizations (10-19 employees: 1 establishment, 1-4 employees: 1 establishment)
Construction: Plumbing, Heating, and Air-Conditioning Contractors (10-19: 1, 1-4: 1)
Arts, Entertainment, and Recreation: Other Gambling Industries (10-19: 1)
Health Care and Social Assistance: Child Day Care Services (10-19: 1)
Health Care and Social Assistance: Other Individual and Family Services (5-9: 1, 1-4: 1)
Construction: Poured Concrete Foundation and Structure Contractors (5-9: 1)
Professional, Scientific, and Technical Services: Drafting Services (1-4: 1)
Arts, Entertainment, and Recreation: All Other Amusement and Recreation Industries (1-4: 1)
Fatal accident statistics in 2013:
Fatal accident count: 1
Vehicles involved in fatal accidents: 2
Fatal accidents caused by drunken drivers: 0
Fatalities: 1
Persons involved in fatal accidents: 3
Pedestrians involved in fatal accidents: 0
Fatal accident statistics in 2011:
Fatal accident count: 1
Vehicles involved in fatal accidents: 2
Fatal accidents caused by drunken drivers: 0
Fatalities: 1
Persons involved in fatal accidents: 2
Pedestrians involved in fatal accidents: 0
Home Mortgage Disclosure Act Aggregated Statistics For Year 2009 (Based on 4 partial tracts)
A) FHA, FSA/RHS & VA Home Purchase Loans
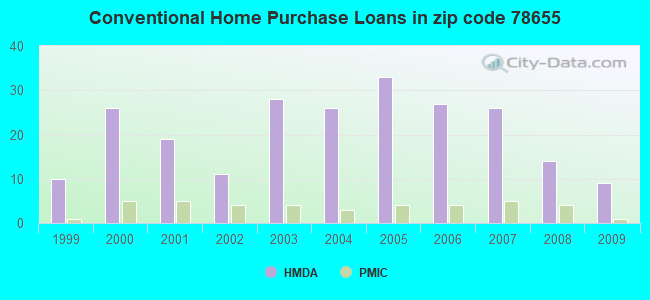
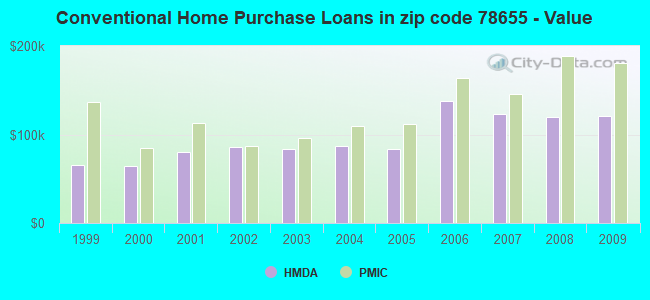
B) Conventional Home Purchase Loans
C) Refinancings
D) Home Improvement Loans
F) Non-occupant Loans on < 5 Family Dwellings (A B C & D)
G) Loans On Manufactured Home Dwelling (A B C & D)
Number
Average Value
Number
Average Value
Number
Average Value
Number
Average Value
Number
Average Value
Number
Average Value
LOANS ORIGINATED
6
$105,652
9
$120,636
18
$148,178
5
$66,976
3
$110,043
6
$70,900
APPLICATIONS APPROVED, NOT ACCEPTED
1
$152,690
4
$71,372
8
$130,632
0
$0
0
$0
3
$73,283
APPLICATIONS DENIED
2
$105,725
5
$54,306
17
$140,375
5
$32,070
0
$0
5
$49,680
APPLICATIONS WITHDRAWN
1
$90,700
1
$160,130
10
$154,096
1
$129,770
0
$0
2
$96,730
FILES CLOSED FOR INCOMPLETENESS
0
$0
0
$0
1
$120,870
0
$0
0
$0
0
$0
Aggregated Statistics For Year 2008 (Based on 4 partial tracts)
A) FHA, FSA/RHS & VA Home Purchase Loans
B) Conventional Home Purchase Loans
C) Refinancings
D) Home Improvement Loans
F) Non-occupant Loans on < 5 Family Dwellings (A B C & D)
G) Loans On Manufactured Home Dwelling (A B C & D)
Number
Average Value
Number
Average Value
Number
Average Value
Number
Average Value
Number
Average Value
Number
Average Value
LOANS ORIGINATED
4
$110,602
14
$119,540
16
$126,309
10
$37,123
5
$99,628
7
$51,747
APPLICATIONS APPROVED, NOT ACCEPTED
0
$0
4
$108,038
5
$92,216
2
$44,950
1
$181,420
5
$67,522
APPLICATIONS DENIED
3
$83,003
12
$101,502
25
$95,644
12
$40,926
3
$57,370
12
$50,544
APPLICATIONS WITHDRAWN
1
$235,450
2
$120,800
7
$117,183
2
$41,545
0
$0
1
$84,870
FILES CLOSED FOR INCOMPLETENESS
0
$0
0
$0
1
$99,230
1
$8,050
0
$0
0
$0
Aggregated Statistics For Year 2007 (Based on 4 partial tracts)
A) FHA, FSA/RHS & VA Home Purchase Loans
B) Conventional Home Purchase Loans
C) Refinancings
D) Home Improvement Loans
F) Non-occupant Loans on < 5 Family Dwellings (A B C & D)
G) Loans On Manufactured Home Dwelling (A B C & D)
Number
Average Value
Number
Average Value
Number
Average Value
Number
Average Value
Number
Average Value
Number
Average Value
LOANS ORIGINATED
5
$106,062
26
$122,972
22
$118,792
9
$29,164
7
$193,061
10
$62,763
APPLICATIONS APPROVED, NOT ACCEPTED
0
$0
5
$85,240
4
$113,672
3
$40,560
0
$0
4
$52,088
APPLICATIONS DENIED
1
$61,590
16
$64,991
31
$96,736
16
$43,124
3
$81,820
19
$53,629
APPLICATIONS WITHDRAWN
0
$0
4
$114,585
18
$116,233
3
$58,647
1
$112,520
2
$68,715
FILES CLOSED FOR INCOMPLETENESS
0
$0
1
$144,920
3
$101,823
0
$0
0
$0
0
$0
Aggregated Statistics For Year 2006 (Based on 4 partial tracts)
A) FHA, FSA/RHS & VA Home Purchase Loans
B) Conventional Home Purchase Loans
C) Refinancings
D) Home Improvement Loans
F) Non-occupant Loans on < 5 Family Dwellings (A B C & D)
G) Loans On Manufactured Home Dwelling (A B C & D)
Number
Average Value
Number
Average Value
Number
Average Value
Number
Average Value
Number
Average Value
Number
Average Value
LOANS ORIGINATED
8
$123,070
27
$137,523
25
$95,029
5
$74,488
6
$250,765
13
$81,005
APPLICATIONS APPROVED, NOT ACCEPTED
1
$46,500
9
$87,940
4
$103,018
3
$27,740
0
$0
5
$58,998
APPLICATIONS DENIED
1
$37,700
19
$69,049
33
$94,988
12
$34,148
4
$71,988
20
$54,430
APPLICATIONS WITHDRAWN
0
$0
5
$96,638
22
$97,764
3
$51,747
0
$0
2
$49,800
FILES CLOSED FOR INCOMPLETENESS
0
$0
2
$119,770
3
$111,767
0
$0
1
$60,410
0
$0
Aggregated Statistics For Year 2005 (Based on 4 partial tracts)
A) FHA, FSA/RHS & VA Home Purchase Loans
B) Conventional Home Purchase Loans
C) Refinancings
D) Home Improvement Loans
F) Non-occupant Loans on < 5 Family Dwellings (A B C & D)
G) Loans On Manufactured Home Dwelling (A B C & D)
Number
Average Value
Number
Average Value
Number
Average Value
Number
Average Value
Number
Average Value
Number
Average Value
LOANS ORIGINATED
8
$90,854
33
$84,041
19
$122,987
11
$53,117
7
$83,809
11
$72,871
APPLICATIONS APPROVED, NOT ACCEPTED
0
$0
19
$60,927
9
$88,444
3
$59,407
0
$0
15
$46,879
APPLICATIONS DENIED
2
$89,800
23
$55,629
49
$81,564
14
$31,766
2
$53,945
25
$48,752
APPLICATIONS WITHDRAWN
0
$0
5
$77,690
26
$104,095
4
$135,990
3
$78,733
3
$50,727
FILES CLOSED FOR INCOMPLETENESS
0
$0
2
$100,025
9
$109,841
0
$0
1
$74,670
0
$0
Aggregated Statistics For Year 2004 (Based on 4 partial tracts)
A) FHA, FSA/RHS & VA Home Purchase Loans
B) Conventional Home Purchase Loans
C) Refinancings
D) Home Improvement Loans
F) Non-occupant Loans on < 5 Family Dwellings (A B C & D)
G) Loans On Manufactured Home Dwelling (A B C & D)
Number
Average Value
Number
Average Value
Number
Average Value
Number
Average Value
Number
Average Value
Number
Average Value
LOANS ORIGINATED
4
$97,832
26
$87,024
39
$101,179
9
$35,570
5
$71,560
13
$62,249
APPLICATIONS APPROVED, NOT ACCEPTED
1
$53,080
10
$49,850
9
$83,418
2
$10,415
1
$65,060
11
$42,628
APPLICATIONS DENIED
1
$182,690
32
$43,800
44
$76,105
13
$19,689
4
$64,067
31
$41,500
APPLICATIONS WITHDRAWN
0
$0
4
$71,535
32
$87,390
3
$46,803
1
$159,900
4
$67,012
FILES CLOSED FOR INCOMPLETENESS
0
$0
0
$0
12
$98,097
0
$0
0
$0
0
$0
Aggregated Statistics For Year 2003 (Based on 4 partial tracts)
A) FHA, FSA/RHS & VA Home Purchase Loans
B) Conventional Home Purchase Loans
C) Refinancings
D) Home Improvement Loans
F) Non-occupant Loans on < 5 Family Dwellings (A B C & D)
Number
Average Value
Number
Average Value
Number
Average Value
Number
Average Value
Number
Average Value
LOANS ORIGINATED
8
$101,430
28
$83,133
56
$101,028
7
$16,984
7
$80,019
APPLICATIONS APPROVED, NOT ACCEPTED
0
$0
9
$71,056
11
$89,054
1
$12,170
1
$80,500
APPLICATIONS DENIED
2
$77,010
24
$46,453
46
$78,938
8
$18,362
5
$95,506
APPLICATIONS WITHDRAWN
2
$106,680
4
$96,082
30
$87,043
0
$0
1
$131,010
FILES CLOSED FOR INCOMPLETENESS
0
$0
1
$97,880
4
$90,705
0
$0
0
$0
Aggregated Statistics For Year 2002 (Based on 2 partial tracts)
A) FHA, FSA/RHS & VA Home Purchase Loans
B) Conventional Home Purchase Loans
C) Refinancings
D) Home Improvement Loans
F) Non-occupant Loans on < 5 Family Dwellings (A B C & D)
Number
Average Value
Number
Average Value
Number
Average Value
Number
Average Value
Number
Average Value
LOANS ORIGINATED
5
$97,434
11
$86,115
22
$98,857
5
$28,096
2
$48,010
APPLICATIONS APPROVED, NOT ACCEPTED
0
$0
3
$75,180
4
$117,682
1
$19,650
0
$0
APPLICATIONS DENIED
1
$67,660
16
$59,366
14
$58,801
7
$17,353
1
$109,870
APPLICATIONS WITHDRAWN
1
$60,900
1
$116,960
9
$80,013
1
$38,660
0
$0
FILES CLOSED FOR INCOMPLETENESS
0
$0
1
$36,730
2
$52,355
0
$0
0
$0
Aggregated Statistics For Year 2001 (Based on 2 partial tracts)
A) FHA, FSA/RHS & VA Home Purchase Loans
B) Conventional Home Purchase Loans
C) Refinancings
D) Home Improvement Loans
F) Non-occupant Loans on < 5 Family Dwellings (A B C & D)
Number
Average Value
Number
Average Value
Number
Average Value
Number
Average Value
Number
Average Value
LOANS ORIGINATED
4
$93,600
19
$80,482
16
$88,766
6
$16,540
3
$97,520
APPLICATIONS APPROVED, NOT ACCEPTED
0
$0
9
$56,707
1
$84,740
1
$3,870
1
$34,800
APPLICATIONS DENIED
0
$0
47
$44,889
11
$94,815
6
$16,970
2
$48,650
APPLICATIONS WITHDRAWN
1
$95,690
2
$35,765
8
$77,006
1
$12,890
1
$85,380
FILES CLOSED FOR INCOMPLETENESS
0
$0
1
$19,650
1
$67,020
0
$0
0
$0
Aggregated Statistics For Year 2000 (Based on 2 partial tracts)
A) FHA, FSA/RHS & VA Home Purchase Loans
B) Conventional Home Purchase Loans
C) Refinancings
D) Home Improvement Loans
F) Non-occupant Loans on < 5 Family Dwellings (A B C & D)
Number
Average Value
Number
Average Value
Number
Average Value
Number
Average Value
Number
Average Value
LOANS ORIGINATED
9
$83,916
26
$64,229
7
$75,303
5
$10,568
3
$35,227
APPLICATIONS APPROVED, NOT ACCEPTED
2
$47,685
9
$63,760
4
$61,298
2
$12,080
0
$0
APPLICATIONS DENIED
2
$38,505
39
$44,183
5
$92,406
8
$14,298
2
$59,125
APPLICATIONS WITHDRAWN
5
$81,194
3
$82,913
1
$96,660
0
$0
1
$24,810
FILES CLOSED FOR INCOMPLETENESS
0
$0
1
$39,950
1
$62,830
0
$0
0
$0
Aggregated Statistics For Year 1999 (Based on 1 partial tract)
A) FHA, FSA/RHS & VA Home Purchase Loans
B) Conventional Home Purchase Loans
C) Refinancings
D) Home Improvement Loans
F) Non-occupant Loans on < 5 Family Dwellings (A B C & D)
Detailed PMIC statistics for the following Tracts:2105.01
, 9605.00
2003 - 2018 National Fire Incident Reporting System (NFIRS) incidents
Based on the data from the years 2003 - 2018 the average number of fire incidents per year is 7. The highest number of fires - 12 took place in 2010, and the least - 0 in 2017. The data has a dropping trend.
When looking into fire subcategories, the most reports belonged to: Outside Fires (48.1%), and Structure Fires (33.3%).
Fire incident types reported to NFIRS in Zip Code 78655


 Nearest zip codes: 78670, 78622, 78656, 78661, 78666, 78638.
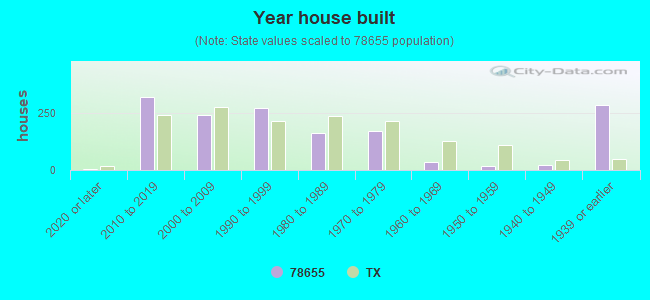


 Based on the data from the years 2003 - 2018 the average number of fire incidents per year is 7. The highest number of fires - 12 took place in 2010, and the least - 0 in 2017. The data has a dropping trend.
 When looking into fire subcategories, the most reports belonged to: Outside Fires (48.1%), and Structure Fires (33.3%).