Races in Carlsbad, New Mexico (NM) Detailed Stats
Data:
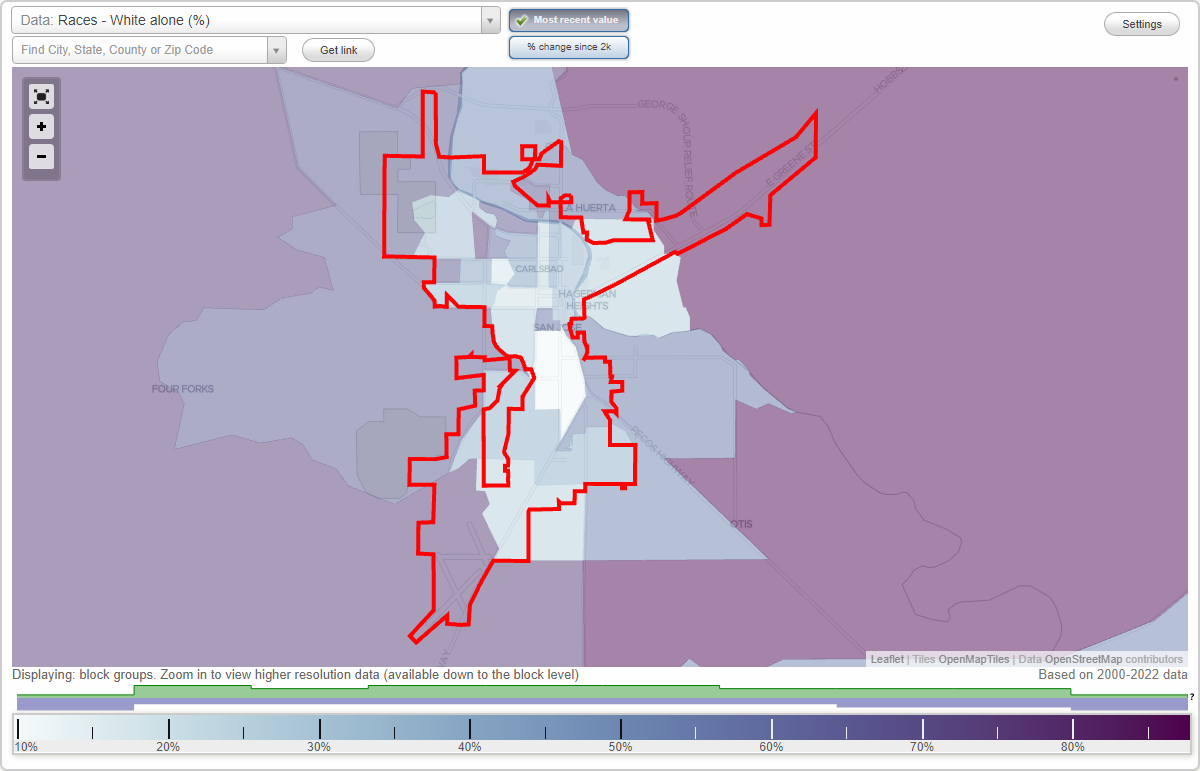
Races - White alone (%)
Races - White alone (% change since 2000)
Races - Black alone (%)
Races - Black alone (% change since 2000)
Races - American Indian alone (%)
Races - American Indian alone (% change since 2000)
Races - Asian alone (%)
Races - Asian alone (% change since 2000)
Races - Hispanic (%)
Races - Hispanic (% change since 2000)
Races - Native Hawaiian and Other Pacific Islander alone (%)
Races - Native Hawaiian and Other Pacific Islander alone (% change since 2000)
Races - Two or more races(%)
Races - Two or more races(% change since 2000)
Races - Other race alone (%)
Races - Other race alone (% change since 2000)
Racial diversity
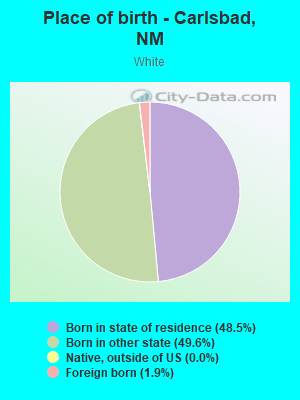
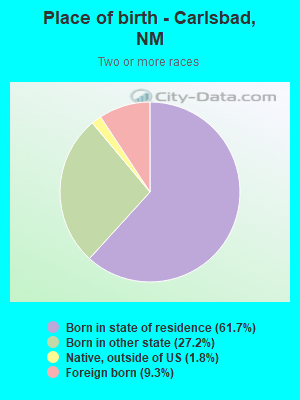
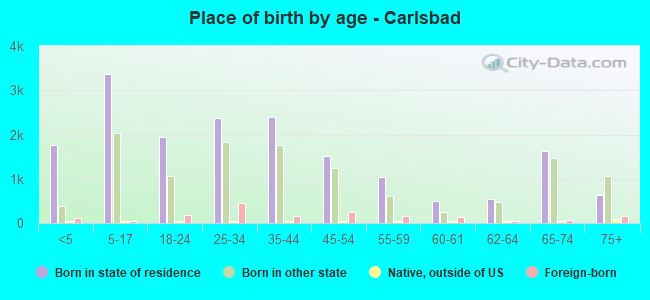
Place of birth - Born in state of residence (%)
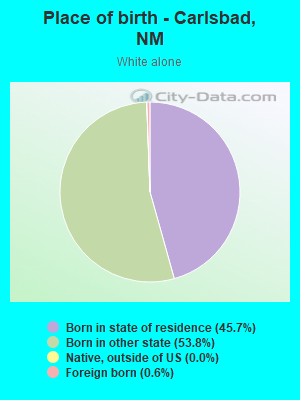
Place of birth - Born in state of residence (%) - White
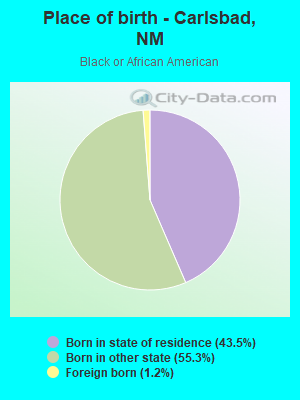
Place of birth - Born in state of residence (%) - Black or African American
Place of birth - Born in state of residence (%) - Asian
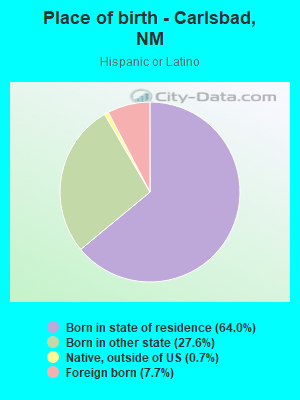
Place of birth - Born in state of residence (%) - Hispanic or Latino
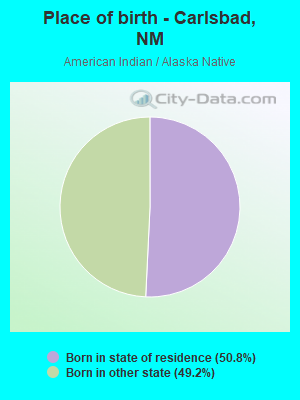
Place of birth - Born in state of residence (%) - American Indian and Alaska Native
Place of birth - Born in state of residence (%) - Multirace
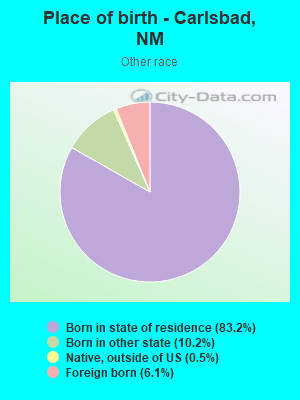
Place of birth - Born in state of residence (%) - Other Race
Place of birth - Born in other state (%)
Place of birth - Born in other state (%) - White
Place of birth - Born in other state (%) - Black or African American
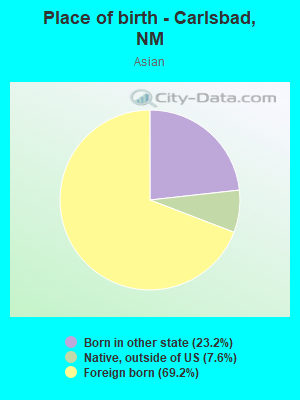
Place of birth - Born in other state (%) - Asian
Place of birth - Born in other state (%) - Hispanic or Latino
Place of birth - Born in other state (%) - American Indian and Alaska Native
Place of birth - Born in other state (%) - Multirace
Place of birth - Born in other state (%) - Other Race
Place of birth - Native, outside of US (%)
Place of birth - Native, outside of US (%) - White
Place of birth - Native, outside of US (%) - Black or African American
Place of birth - Native, outside of US (%) - Asian
Place of birth - Native, outside of US (%) - Hispanic or Latino
Place of birth - Native, outside of US (%) - American Indian and Alaska Native
Place of birth - Native, outside of US (%) - Multirace
Place of birth - Native, outside of US (%) - Other Race
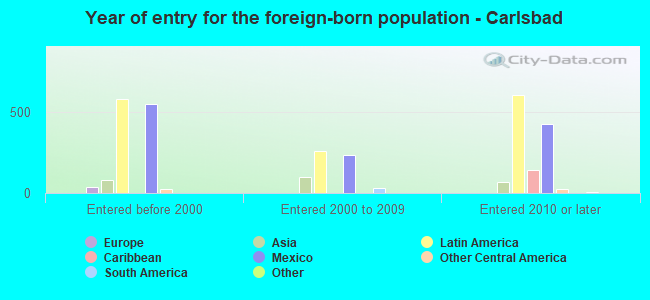
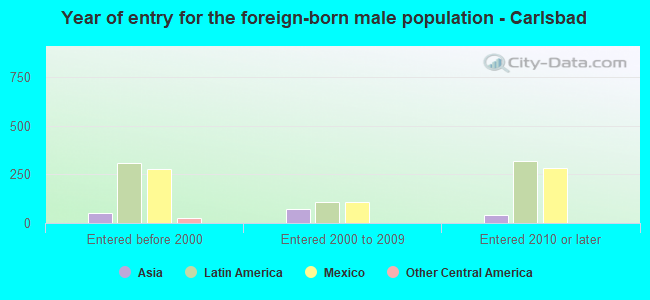
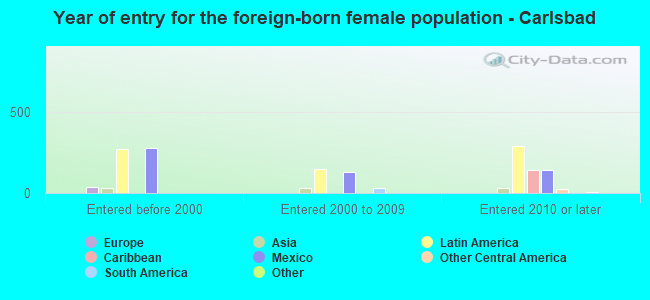
Place of birth - Foreign born (%)
Place of birth - Foreign born (%) - White
Place of birth - Foreign born (%) - Black or African American
Place of birth - Foreign born (%) - Asian
Place of birth - Foreign born (%) - Hispanic or Latino
Place of birth - Foreign born (%) - American Indian and Alaska Native
Place of birth - Foreign born (%) - Multirace
Place of birth - Foreign born (%) - Other Race
Residents speaking English at home (%)
Residents speaking English at home - Born in the United States (%)
Residents speaking English at home - Native, born elsewhere (%)
Residents speaking English at home - Foreign born (%)
Residents speaking Spanish at home (%)
Residents speaking Spanish at home - Born in the United States (%)
Residents speaking Spanish at home - Native, born elsewhere (%)
Residents speaking Spanish at home - Foreign born (%)
Residents speaking other language at home (%)
Residents speaking other language at home - Born in the United States (%)
Residents speaking other language at home - Native, born elsewhere (%)
Residents speaking other language at home - Foreign born (%)
Marital status - Never married (%)
Marital status - Now married (%)
Marital status - Separated (%)
Marital status - Widowed (%)
Marital status - Divorced (%)
Ancestries Reported - Arab (%)
Ancestries Reported - Czech (%)
Ancestries Reported - Danish (%)
Ancestries Reported - Dutch (%)
Ancestries Reported - English (%)
Ancestries Reported - French (%)
Ancestries Reported - French Canadian (%)
Ancestries Reported - German (%)
Ancestries Reported - Greek (%)
Ancestries Reported - Hungarian (%)
Ancestries Reported - Irish (%)
Ancestries Reported - Italian (%)
Ancestries Reported - Lithuanian (%)
Ancestries Reported - Norwegian (%)
Ancestries Reported - Polish (%)
Ancestries Reported - Portuguese (%)
Ancestries Reported - Russian (%)
Ancestries Reported - Scotch-Irish (%)
Ancestries Reported - Scottish (%)
Ancestries Reported - Slovak (%)
Ancestries Reported - Subsaharan African (%)
Ancestries Reported - Swedish (%)
Ancestries Reported - Swiss (%)
Ancestries Reported - Ukrainian (%)
Ancestries Reported - United States (%)
Ancestries Reported - Welsh (%)
Ancestries Reported - West Indian (%)
Ancestries Reported - Other (%)
Geographical mobility - Same house 1 year ago (%)
Geographical mobility - Same house 1 year ago (%) - White
Geographical mobility - Same house 1 year ago (%) - Black or African American
Geographical mobility - Same house 1 year ago (%) - Asian
Geographical mobility - Same house 1 year ago (%) - Hispanic or Latino
Geographical mobility - Same house 1 year ago (%) - American Indian and Alaska Native
Geographical mobility - Same house 1 year ago (%) - Multirace
Geographical mobility - Same house 1 year ago (%) - Other Race
Geographical mobility - Moved within same county (%)
Geographical mobility - Moved within same county (%) - White
Geographical mobility - Moved within same county (%) - Black or African American
Geographical mobility - Moved within same county (%) - Asian
Geographical mobility - Moved within same county (%) - Hispanic or Latino
Geographical mobility - Moved within same county (%) - American Indian and Alaska Native
Geographical mobility - Moved within same county (%) - Multirace
Geographical mobility - Moved within same county (%) - Other Race
Geographical mobility - Moved from different county within same state (%)
Geographical mobility - Moved from different county within same state (%) - White
Geographical mobility - Moved from different county within same state (%) - Black or African American
Geographical mobility - Moved from different county within same state (%) - Asian
Geographical mobility - Moved from different county within same state (%) - Hispanic or Latino
Geographical mobility - Moved from different county within same state (%) - American Indian and Alaska Native
Geographical mobility - Moved from different county within same state (%) - Multirace
Geographical mobility - Moved from different county within same state (%) - Other Race
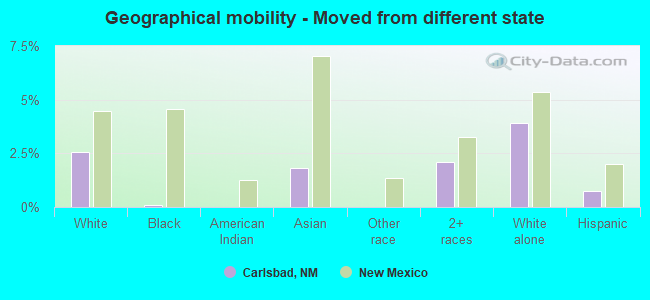
Geographical mobility - Moved from different state (%)
Geographical mobility - Moved from different state (%) - White
Geographical mobility - Moved from different state (%) - Black or African American
Geographical mobility - Moved from different state (%) - Asian
Geographical mobility - Moved from different state (%) - Hispanic or Latino
Geographical mobility - Moved from different state (%) - American Indian and Alaska Native
Geographical mobility - Moved from different state (%) - Multirace
Geographical mobility - Moved from different state (%) - Other Race
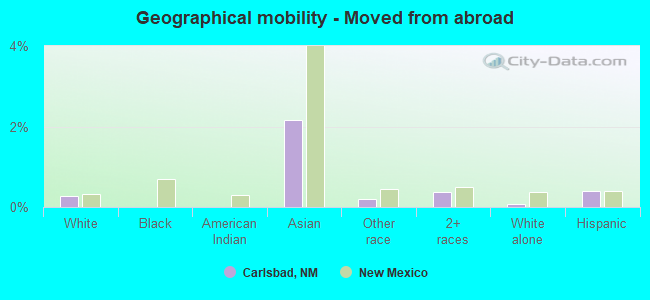
Geographical mobility - Moved from abroad (%)
Geographical mobility - Moved from abroad (%) - White
Geographical mobility - Moved from abroad (%) - Black or African American
Geographical mobility - Moved from abroad (%) - Asian
Geographical mobility - Moved from abroad (%) - Hispanic or Latino
Geographical mobility - Moved from abroad (%) - American Indian and Alaska Native
Geographical mobility - Moved from abroad (%) - Multirace
Geographical mobility - Moved from abroad (%) - Other Race
Place of birth for the foreign-born population - Ireland (%)
Place of birth for the foreign-born population - Denmark (%)
Place of birth for the foreign-born population - Norway (%)
Place of birth for the foreign-born population - Sweden (%)
Place of birth for the foreign-born population - United Kingdom (%)
Place of birth for the foreign-born population - England (%)
Place of birth for the foreign-born population - Scotland (%)
Place of birth for the foreign-born population - Other Northern Europe (%)
Place of birth for the foreign-born population - Austria (%)
Place of birth for the foreign-born population - Belgium (%)
Place of birth for the foreign-born population - France (%)
Place of birth for the foreign-born population - Germany (%)
Place of birth for the foreign-born population - Netherlands (%)
Place of birth for the foreign-born population - Switzerland (%)
Place of birth for the foreign-born population - Other Western Europe (%)
Place of birth for the foreign-born population - Greece (%)
Place of birth for the foreign-born population - Italy (%)
Place of birth for the foreign-born population - Portugal (%)
Place of birth for the foreign-born population - Spain (%)
Place of birth for the foreign-born population - Other Southern Europe (%)
Place of birth for the foreign-born population - Albania (%)
Place of birth for the foreign-born population - Belarus (%)
Place of birth for the foreign-born population - Bosnia and Herzegovina (%)
Place of birth for the foreign-born population - Bulgaria (%)
Place of birth for the foreign-born population - Croatia (%)
Place of birth for the foreign-born population - Czechoslovakia (%)
Place of birth for the foreign-born population - Hungary (%)
Place of birth for the foreign-born population - Latvia (%)
Place of birth for the foreign-born population - Lithuania (%)
Place of birth for the foreign-born population - North Macedonia (Macedonia) (%)
Place of birth for the foreign-born population - Moldova (%)
Place of birth for the foreign-born population - Poland (%)
Place of birth for the foreign-born population - Romania (%)
Place of birth for the foreign-born population - Russia (%)
Place of birth for the foreign-born population - Serbia (%)
Place of birth for the foreign-born population - Ukraine (%)
Place of birth for the foreign-born population - Other Eastern Europe (%)
Place of birth for the foreign-born population - China (%)
Place of birth for the foreign-born population - Hong Kong (%)
Place of birth for the foreign-born population - Taiwan (%)
Place of birth for the foreign-born population - Japan (%)
Place of birth for the foreign-born population - Korea (%)
Place of birth for the foreign-born population - Other Eastern Asia (%)
Place of birth for the foreign-born population - Afghanistan (%)
Place of birth for the foreign-born population - Bangladesh (%)
Place of birth for the foreign-born population - India (%)
Place of birth for the foreign-born population - Iran (%)
Place of birth for the foreign-born population - Kazakhstan (%)
Place of birth for the foreign-born population - Nepal (%)
Place of birth for the foreign-born population - Pakistan (%)
Place of birth for the foreign-born population - Sri Lanka (%)
Place of birth for the foreign-born population - Uzbekistan (%)
Place of birth for the foreign-born population - Other South Central Asia (%)
Place of birth for the foreign-born population - Burma (%)
Place of birth for the foreign-born population - Cambodia (%)
Place of birth for the foreign-born population - Indonesia (%)
Place of birth for the foreign-born population - Laos (%)
Place of birth for the foreign-born population - Malaysia (%)
Place of birth for the foreign-born population - Philippines (%)
Place of birth for the foreign-born population - Singapore (%)
Place of birth for the foreign-born population - Thailand (%)
Place of birth for the foreign-born population - Vietnam (%)
Place of birth for the foreign-born population - Other South Eastern Asia (%)
Place of birth for the foreign-born population - Armenia (%)
Place of birth for the foreign-born population - Iraq (%)
Place of birth for the foreign-born population - Israel (%)
Place of birth for the foreign-born population - Jordan (%)
Place of birth for the foreign-born population - Kuwait (%)
Place of birth for the foreign-born population - Lebanon (%)
Place of birth for the foreign-born population - Saudi Arabia (%)
Place of birth for the foreign-born population - Syria (%)
Place of birth for the foreign-born population - Turkey (%)
Place of birth for the foreign-born population - Yemen (%)
Place of birth for the foreign-born population - Other Western Asia (%)
Place of birth for the foreign-born population - Eritrea (%)
Place of birth for the foreign-born population - Ethiopia (%)
Place of birth for the foreign-born population - Kenya (%)
Place of birth for the foreign-born population - Somalia (%)
Place of birth for the foreign-born population - Uganda (%)
Place of birth for the foreign-born population - Zimbabwe (%)
Place of birth for the foreign-born population - Other Eastern Africa (%)
Place of birth for the foreign-born population - Cameroon (%)
Place of birth for the foreign-born population - Congo (%)
Place of birth for the foreign-born population - Democratic Republic of Congo (Zaire) (%)
Place of birth for the foreign-born population - Other Middle Africa (%)
Place of birth for the foreign-born population - Egypt (%)
Place of birth for the foreign-born population - Morocco (%)
Place of birth for the foreign-born population - Sudan (%)
Place of birth for the foreign-born population - Other Northern Africa (%)
Place of birth for the foreign-born population - South Africa (%)
Place of birth for the foreign-born population - Other Southern Africa (%)
Place of birth for the foreign-born population - Cabo Verde (%)
Place of birth for the foreign-born population - Ghana (%)
Place of birth for the foreign-born population - Liberia (%)
Place of birth for the foreign-born population - Nigeria (%)
Place of birth for the foreign-born population - Senegal (%)
Place of birth for the foreign-born population - Sierra Leone (%)
Place of birth for the foreign-born population - Other Western Africa (%)
Place of birth for the foreign-born population - Australia (%)
Place of birth for the foreign-born population - New Zealand (%)
Place of birth for the foreign-born population - Fiji (%)
Place of birth for the foreign-born population - Micronesia (%)
Place of birth for the foreign-born population - Bahamas (%)
Place of birth for the foreign-born population - Barbados (%)
Place of birth for the foreign-born population - Cuba (%)
Place of birth for the foreign-born population - Dominica (%)
Place of birth for the foreign-born population - Dominican Republic (%)
Place of birth for the foreign-born population - Grenada (%)
Place of birth for the foreign-born population - Haiti (%)
Place of birth for the foreign-born population - Jamaica (%)
Place of birth for the foreign-born population - St. Vincent and the Grenadines (%)
Place of birth for the foreign-born population - Trinidad and Tobago (%)
Place of birth for the foreign-born population - West Indies (%)
Place of birth for the foreign-born population - Other Caribbean (%)
Place of birth for the foreign-born population - Belize (%)
Place of birth for the foreign-born population - Costa Rica (%)
Place of birth for the foreign-born population - El Salvador (%)
Place of birth for the foreign-born population - Guatemala (%)
Place of birth for the foreign-born population - Honduras (%)
Place of birth for the foreign-born population - Mexico (%)
Place of birth for the foreign-born population - Nicaragua (%)
Place of birth for the foreign-born population - Panama (%)
Place of birth for the foreign-born population - Other Central America (%)
Place of birth for the foreign-born population - Argentina (%)
Place of birth for the foreign-born population - Bolivia (%)
Place of birth for the foreign-born population - Brazil (%)
Place of birth for the foreign-born population - Chile (%)
Place of birth for the foreign-born population - Colombia (%)
Place of birth for the foreign-born population - Ecuador (%)
Place of birth for the foreign-born population - Guyana (%)
Place of birth for the foreign-born population - Peru (%)
Place of birth for the foreign-born population - Uruguay (%)
Place of birth for the foreign-born population - Venezuela (%)
Place of birth for the foreign-born population - Other South America (%)
Place of birth for the foreign-born population - Canada (%)
Place of birth for the foreign-born population - Other Northern America (%)
Place of birth for the foreign-born population - Other (%)
Latest news about races in Carlsbad, NM collected exclusively by city-data.com from local newspapers, TV, and radio stations
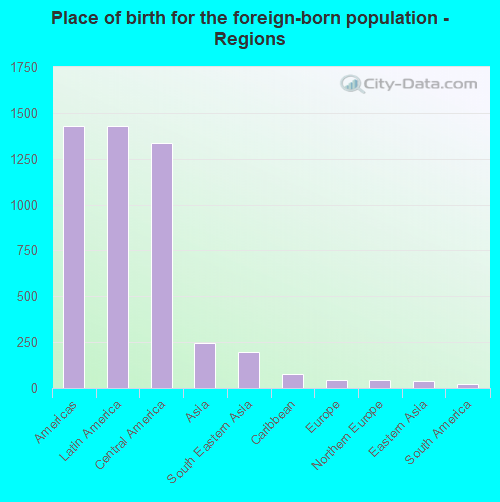
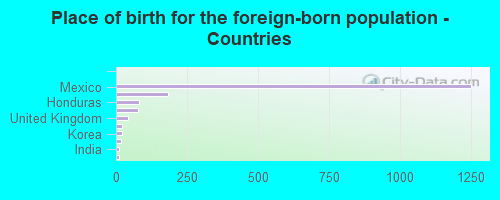
According to 2022 data, the most numerous races in Carlsbad, NM are Hispanic (18,214 residents), White alone (11,669 residents), and American Indian alone (226 residents). 78.2% of Carlsbad residents speak English at home. 5.5% of Carlsbad, NM residents are foreign-born (4.4% born in Latin America, 0.8% born in Asia), which is 65.1% less than the foreign-born rate of 9.0% across the entire state of New Mexico.
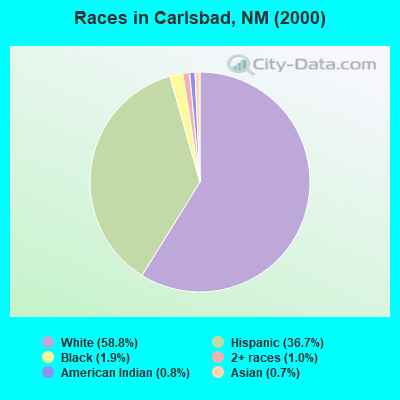
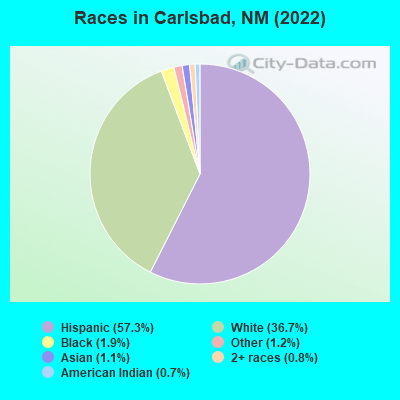
Race distribution in Carlsbad
2000 2022
813,495 44.7% White alone 765,386 42.1% Hispanic 161,460 8.9% American Indian alone 30,654 1.7% Black alone 25,793 1.4% Two or more races 18,257 1.0% Asian alone 3,009 0.2% Other race alone 992 0.05% Native Hawaiian and Other
1,059,867 50.2% Hispanic 735,478 34.8% White alone 171,808 8.1% American Indian alone 65,084 3.1% Two or more races 36,870 1.7% Black alone 35,870 1.7% Asian alone 7,582 0.4% Other race alone 785 0.04% Native Hawaiian and Other
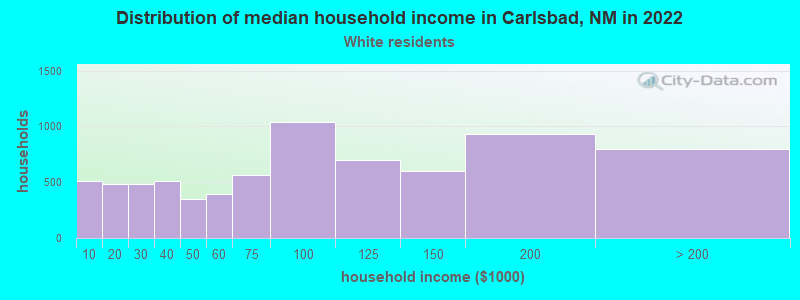
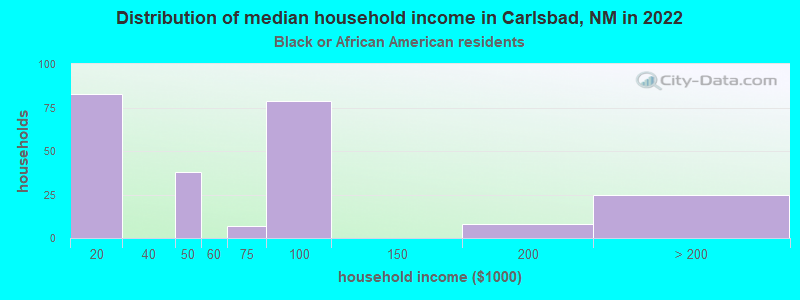
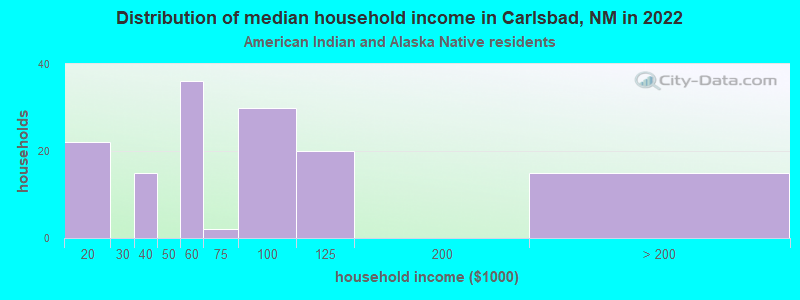
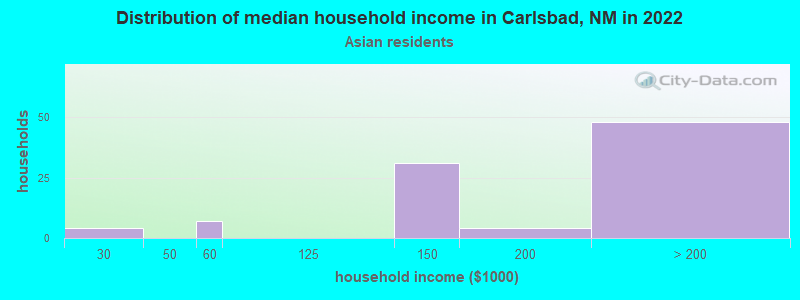
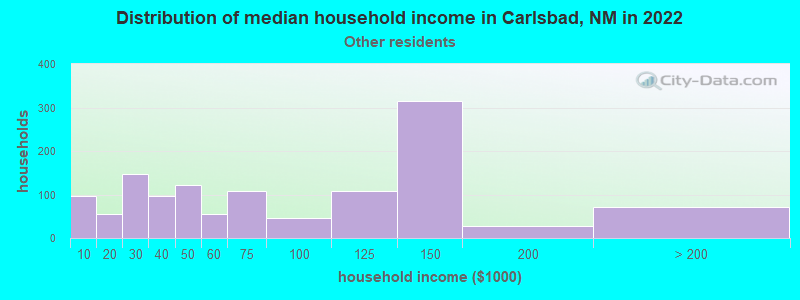
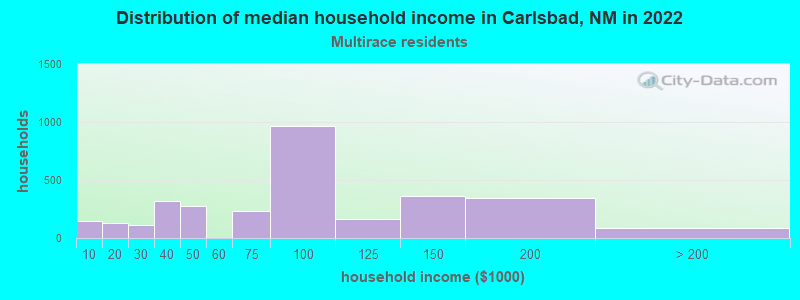
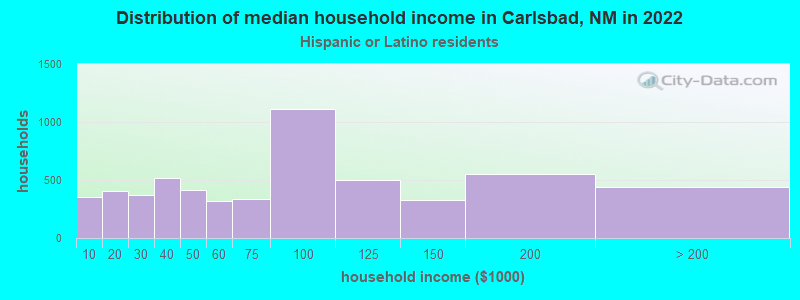
Income and house value in Carlsbad Median household income in 2022 $86,719 White non-Hispanic householders$54,899 Black householders$58,934 American Indian and Alaska Native householders$140,739 Asian householders$63,843 Some other race householders$83,227 Two or more races householders$76,083 Hispanic or Latino race householdersMedian 2022 house value $220,006 White Non-Hispanic householders$146,670 Black or African American householders$176,135 American Indian or Alaska Native householders $375,189 Asian householders$156,165 Some other race householders$300,216 Two or more races householders$161,075 Hispanic or Latino householders
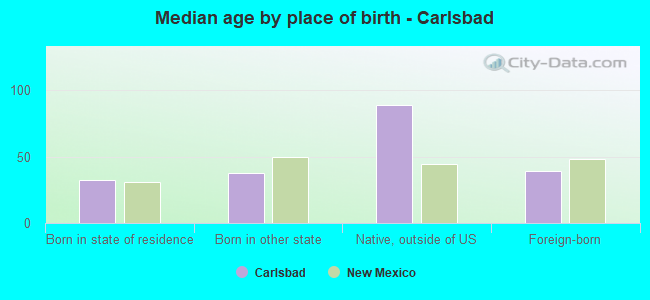
Median age by race in Carlsbad
39.2 Median age for White residents38.3 40.5 42.2 Median age for Black or African American residents35.8 58.1 28.8 Median age for American Indian / Alaska Native residents20.1 42.5 30.5 Median age for Asian residents19.0 40.5 -658,511,722.1 Median age for Native Hawaiian / Pacific Islander residents-685,897,435.2 -659,380,691.5 46.5 Median age for Other race residents46.0 34.2 30.7 Median age for Two or more races residents35.7 27.1 42.7 Median age for White alone residents40.6 44.8 30.0 Median age for Hispanic or Latino residents31.6 29.2
Owner/renter occupied households by race in Carlsbad
House owners and renters - White residents 5,367 73.8% Owner occupied1,902 26.2% Renter occupiedHouse owners and renters - Black or African American residents 152 51.4% Owner occupied143 48.6% Renter occupiedHouse owners and renters - American Indian / Alaska Native residents 111 85.5% Owner occupied19 14.5% Renter occupiedHouse owners and renters - Asian residents 54 56.6% Owner occupied41 43.4% Renter occupiedHouse owners and renters - Other race residents 1,023 78.8% Owner occupied275 21.2% Renter occupiedHouse owners and renters - Two or more races residents 2,216 71.6% Owner occupied878 28.4% Renter occupiedHouse owners and renters - White alone residents 4,789 82.4% Owner occupied1,021 17.6% Renter occupiedHouse owners and renters - Hispanic or Latino residents 3,515 63.5% Owner occupied2,023 36.5% Renter occupied
Language usage in Carlsbad
English speakers - Total 78.2% of residents of Carlsbad speak English at home.
22.5% of residents speak Spanish at home 4,624 69.6% Speak English very well2,020 30.4% Speak English less than very well0.4% of residents speak other language at home 90 68.2% Speak English very well42 31.8% Speak English less than very well
English speakers - Born in the United States 88.0% of residents of Carlsbad speak English at home.
11.9% of residents speak Spanish at home 1,035 74.4% Speak English very well356 25.6% Speak English less than very well0.1% of residents speak other language at home 7 100.0% Speak English very well
English speakers - Native, born elsewhere 21.3% of residents of Carlsbad speak English at home.
78.0% of residents speak Spanish at home 2 1.6% Speak English very well126 98.4% Speak English less than very well
English speakers - Foreign-born 21.0% of residents of Carlsbad speak English at home.
73.6% of residents speak Spanish at home 399 32.8% Speak English very well816 67.2% Speak English less than very well5.8% of residents speak other language at home 84 88.4% Speak English very well11 11.6% Speak English less than very well
White (Caucasian) - Speak only English Native:
93.3% (14,537)Foreign-born:
19.6% (56)
White (Caucasian) - Speak another language Native:
8.3% (1,287)Foreign-born:
100.0% (285)
Black or African American - Speak another language Native:
13.4% (102)Foreign-born:
76.6% (7)
Asian - Speak only English Native:
93.1% (72)Foreign-born:
71.2% (171)
Asian - Speak another language Native:
7.8% (6)Foreign-born:
34.8% (84)
Other race - Speak only English Native:
55.0% (1,872)Foreign-born:
5.2% (13)
Other race - Speak another language Native:
45.2% (1,539)Foreign-born:
94.4% (238)
Two or more races - Speak only English Native:
65.8% (4,855)Foreign-born:
16.4% (139)
Two or more races - Speak another language Native:
34.1% (2,516)Foreign-born:
84.3% (717)
White alone - Speak only English Native:
99.2% (10,898)Foreign-born:
100.0% (65)
Hispanic or Latino - Speak only English Native:
67.4% (10,301)Foreign-born:
8.6% (115)
Hispanic or Latino - Speak another language Native:
32.9% (5,026)Foreign-born:
91.0% (1,215)
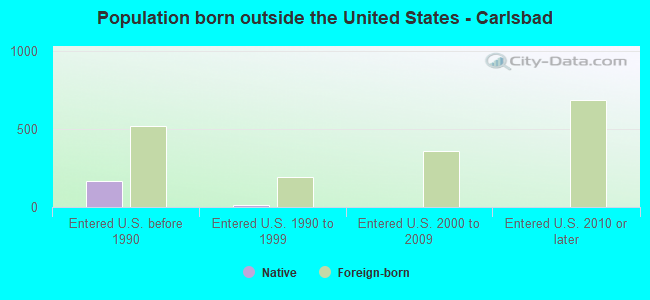
Foreign-born residents in Carlsbad 1,732 residents are foreign born (4.4% Latin America , 0.8% Asia ).
This city:
5.5%New Mexico:
9.2%
Marital status for residents in Carlsbad Marital status - White (Caucasian) population 15 years and over
Males 34.3% Never married50.6% Now married1.6% Separated1.8% Widowed11.7% DivorcedFemales 27.1% Never married45.8% Now married3.2% Separated11.4% Widowed12.4% DivorcedWomen who gave birth in the past 12 months Now married:
25.9% (62)Unmarried:
74.1% (178)
Women who did not give birth in the past 12 months Now married:
48.3% (1,624)Unmarried:
51.7% (1,735)
Marital status - Black or African American population 15 years and over
Males 61.5% Never married31.7% Now married0.0% Separated0.0% Widowed6.7% DivorcedFemales 10.9% Never married28.5% Now married15.5% Separated6.7% Widowed38.5% DivorcedWomen who did not give birth in the past 12 months Now married:
51.9% (28)Unmarried:
48.1% (26)
Marital status - American Indian / Alaska Native population 15 years and over
Males 50.9% Never married41.0% Now married0.0% Separated0.0% Widowed8.1% DivorcedFemales 27.2% Never married55.1% Now married0.0% Separated0.0% Widowed17.7% DivorcedWomen who did not give birth in the past 12 months Now married:
35.2% (32)Unmarried:
64.8% (60)
Marital status - Asian population 15 years and over
Males 27.4% Never married63.2% Now married0.0% Separated0.0% Widowed9.4% DivorcedFemales 24.8% Never married71.4% Now married0.0% Separated0.0% Widowed3.8% DivorcedWomen who gave birth in the past 12 months Now married:
100.0% (20)Unmarried:
0.0% (0)
Women who did not give birth in the past 12 months Now married:
52.7% (35)Unmarried:
47.3% (31)
Marital status - Other race population 15 years and over
Males 19.5% Never married64.4% Now married0.0% Separated5.0% Widowed11.1% DivorcedFemales 12.5% Never married54.9% Now married0.0% Separated4.6% Widowed28.0% DivorcedWomen who gave birth in the past 12 months Now married:
100.0% (141)Unmarried:
0.0% (0)
Women who did not give birth in the past 12 months Now married:
53.2% (309)Unmarried:
46.8% (271)
Marital status - Two or more races population 15 years and over
Males 47.1% Never married28.5% Now married4.6% Separated6.4% Widowed13.5% DivorcedFemales 37.2% Never married40.2% Now married0.0% Separated6.7% Widowed15.9% DivorcedWomen who gave birth in the past 12 months Now married:
100.0% (170)Unmarried:
0.0% (0)
Women who did not give birth in the past 12 months Now married:
33.4% (666)Unmarried:
66.6% (1,331)
Marital status - White alone, not Hispanic / Latino population 15 years and over
Males 29.6% Never married56.4% Now married0.7% Separated2.1% Widowed11.2% DivorcedFemales 18.5% Never married51.7% Now married0.8% Separated16.4% Widowed12.5% DivorcedWomen who gave birth in the past 12 months Now married:
37.9% (35)Unmarried:
62.1% (57)
Women who did not give birth in the past 12 months Now married:
56.0% (1,175)Unmarried:
44.0% (923)
Marital status - Hispanic or Latino population 15 years and over
Males 41.6% Never married38.3% Now married3.2% Separated3.8% Widowed13.1% DivorcedFemales 33.7% Never married40.9% Now married3.5% Separated5.6% Widowed16.4% DivorcedWomen who gave birth in the past 12 months Now married:
59.0% (259)Unmarried:
41.0% (180)
Women who did not give birth in the past 12 months Now married:
39.2% (1,596)Unmarried:
60.8% (2,475)
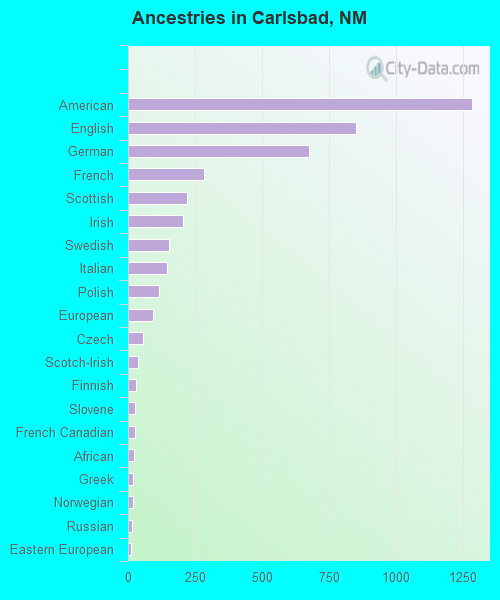
Ancestries in Carlsbad
1,284 6.5% American850 4.3% English677 3.4% German284 1.4% French221 1.1% Scottish207 1.0% Irish153 0.8% Swedish147 0.7% Italian117 0.6% Polish93 0.5% European56 0.3% Czech37 0.2% Scotch-Irish31 0.2% Finnish28 0.1% Slovene26 0.1% French Canadian22 0.1% African19 0.10% Greek17 0.09% Norwegian14 0.07% Russian13 0.07% Eastern European11 0.06% Swiss9 0.05% British6 0.03% Austrian6 0.03% Dutch4 0.02% Portuguese3 0.02% Northern European
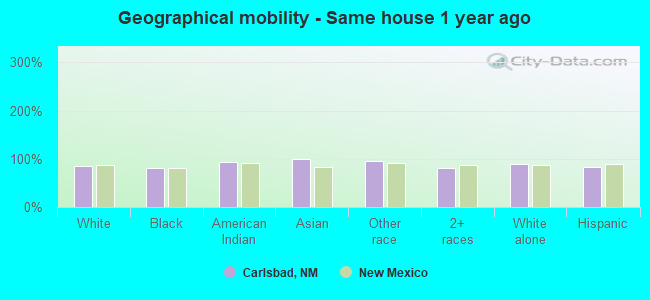
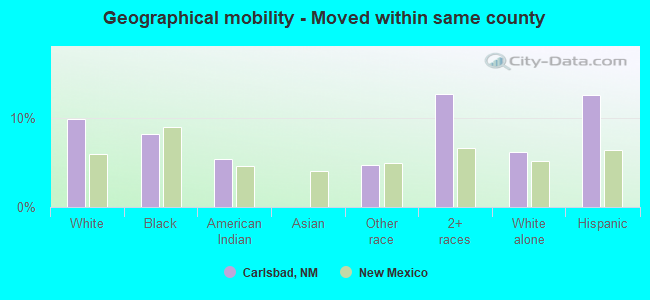
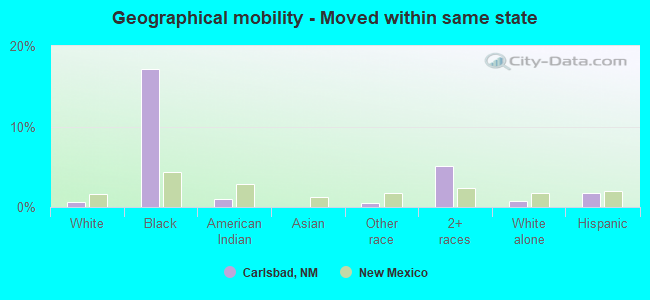
Geographical mobility in Carlsbad Same house 1 year ago 13,993 85.9% White (Caucasian)602 80.6% Black or African American468 93.0% American Indian / Alaska Native318 99.6% Asian3,899 95.7% Other race7,240 80.1% Two or more races10,286 89.0% White alone, not Hispanic / Latino14,921 83.9% Hispanic or LatinoMoved within same county 1,601 9.8% White / Caucasian61 8.2% Black or African American27 5.4% American Indian / Alaska Native193 4.7% Other race1,143 12.6% Two or more races712 6.2% White alone, not Hispanic / Latino2,235 12.6% Hispanic or LatinoMoved within same state 91 0.6% White / Caucasian128 17.1% Black or African American5 0.9% American Indian / Alaska Native19 0.5% Other race466 5.2% Two or more races84 0.7% White alone, not Hispanic / Latino310 1.7% Hispanic or LatinoMoved from different state 415 2.6% White / Caucasian1 0.1% Black or African American6 1.8% Asian190 2.1% Two or more races451 3.9% White alone, not Hispanic / Latino130 0.7% Hispanic or LatinoMoved from abroad 46 0.3% White7 2.2% Asian8 0.2% Other race33 0.4% Two or more races7 0.1% White alone, not Hispanic / Latino70 0.4% Hispanic or Latino
Children Nativity (place of birth) in Carlsbad
Children under 6 years - Living with two parents Both parents native 1,401 100.0% NativeBoth parents foreign-born 34 38.2% Native55 61.8% Foreign-bornOne native, one foreign-born parent 127 100.0% NativeChildren under 6 years - Living with one parent Native parent 870 100.0% NativeForeign-born parent 17 100.0% Foreign-bornChildren 6 to 17 years - Living with two parents Both parents native 2,881 100.0% Native1 0.0% Foreign-bornBoth parents foreign-born 33 100.0% Foreign-bornOne native, one foreign-born parent 120 100.0% NativeChildren 6 to 17 years - Living with one parent Native parent 1,602 100.0% NativeForeign-born parent 59 60.2% Native39 39.8% Foreign-born
Grandparents responsible for own grandchildren in Carlsbad
Grandparents (30 to 59 years) White / Caucasian 125 44.8% Responsible for grandchildren154 55.2% Not responsible for grandchildrenOther race 27 100.0% Not responsible for grandchildrenTwo or more races 7 100.0% Responsible for grandchildrenWhite alone, not Hispanic / Latino 32 46.6% Responsible for grandchildren36 53.4% Not responsible for grandchildrenHispanic or Latino 78 30.6% Responsible for grandchildren178 69.4% Not responsible for grandchildrenGrandparents (60 years and over) White / Caucasian 77 43.0% Responsible for grandchildren103 57.0% Not responsible for grandchildrenOther race 24 100.0% Not responsible for grandchildrenTwo or more races 78 63.9% Responsible for grandchildren44 36.1% Not responsible for grandchildrenWhite alone, not Hispanic / Latino 68 63.8% Responsible for grandchildren39 36.2% Not responsible for grandchildrenHispanic or Latino 63 29.4% Responsible for grandchildren152 70.6% Not responsible for grandchildren