Races in Carrboro, North Carolina (NC) Detailed Stats
Data:
Races - White alone (%)
Races - White alone (% change since 2000)
Races - Black alone (%)
Races - Black alone (% change since 2000)
Races - American Indian alone (%)
Races - American Indian alone (% change since 2000)
Races - Asian alone (%)
Races - Asian alone (% change since 2000)
Races - Hispanic (%)
Races - Hispanic (% change since 2000)
Races - Native Hawaiian and Other Pacific Islander alone (%)
Races - Native Hawaiian and Other Pacific Islander alone (% change since 2000)
Races - Two or more races(%)
Races - Two or more races(% change since 2000)
Races - Other race alone (%)
Races - Other race alone (% change since 2000)
Racial diversity
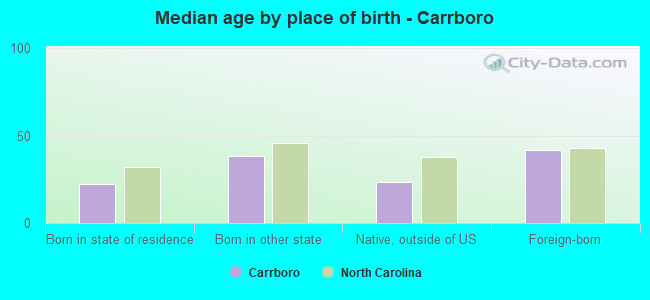
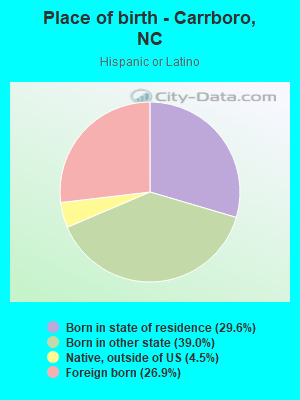
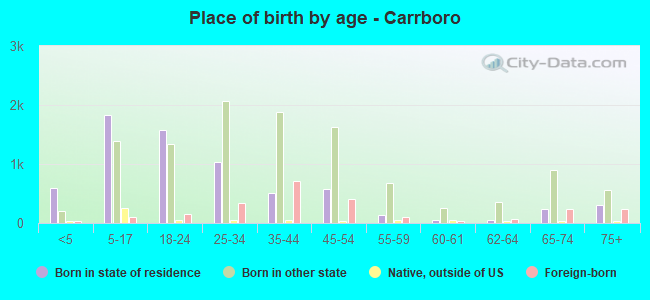
Place of birth - Born in state of residence (%)
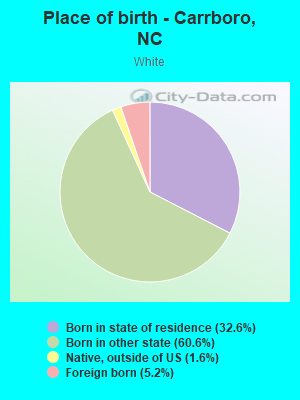
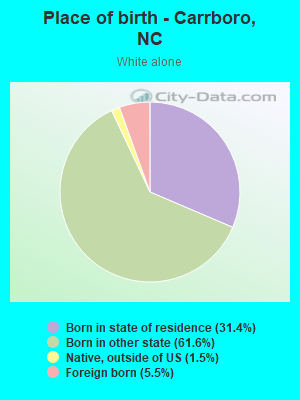
Place of birth - Born in state of residence (%) - White
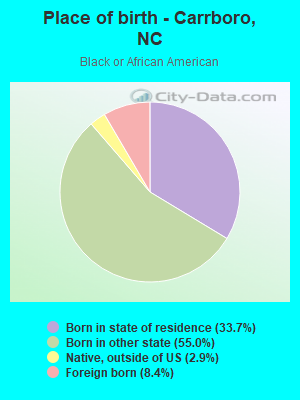
Place of birth - Born in state of residence (%) - Black or African American
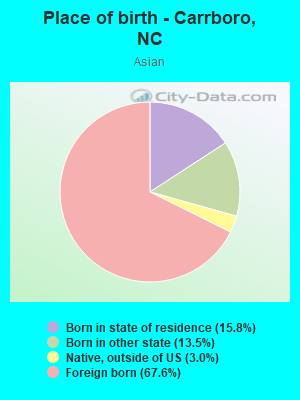
Place of birth - Born in state of residence (%) - Asian
Place of birth - Born in state of residence (%) - Hispanic or Latino
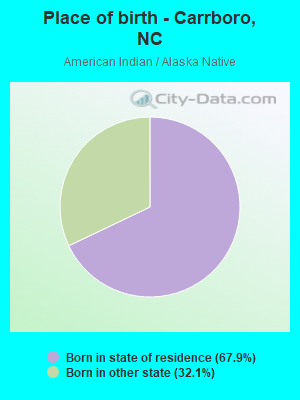
Place of birth - Born in state of residence (%) - American Indian and Alaska Native
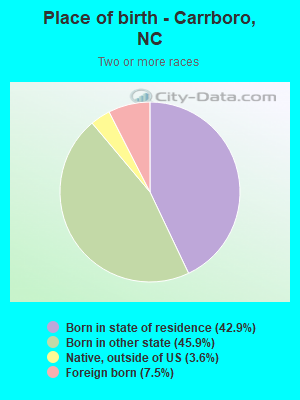
Place of birth - Born in state of residence (%) - Multirace
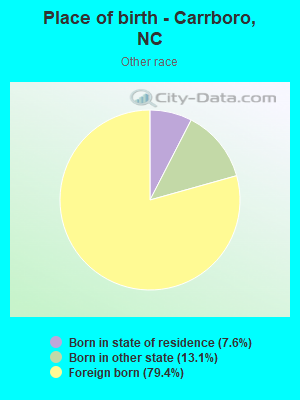
Place of birth - Born in state of residence (%) - Other Race
Place of birth - Born in other state (%)
Place of birth - Born in other state (%) - White
Place of birth - Born in other state (%) - Black or African American
Place of birth - Born in other state (%) - Asian
Place of birth - Born in other state (%) - Hispanic or Latino
Place of birth - Born in other state (%) - American Indian and Alaska Native
Place of birth - Born in other state (%) - Multirace
Place of birth - Born in other state (%) - Other Race
Place of birth - Native, outside of US (%)
Place of birth - Native, outside of US (%) - White
Place of birth - Native, outside of US (%) - Black or African American
Place of birth - Native, outside of US (%) - Asian
Place of birth - Native, outside of US (%) - Hispanic or Latino
Place of birth - Native, outside of US (%) - American Indian and Alaska Native
Place of birth - Native, outside of US (%) - Multirace
Place of birth - Native, outside of US (%) - Other Race
Place of birth - Foreign born (%)
Place of birth - Foreign born (%) - White
Place of birth - Foreign born (%) - Black or African American
Place of birth - Foreign born (%) - Asian
Place of birth - Foreign born (%) - Hispanic or Latino
Place of birth - Foreign born (%) - American Indian and Alaska Native
Place of birth - Foreign born (%) - Multirace
Place of birth - Foreign born (%) - Other Race
Residents speaking English at home (%)
Residents speaking English at home - Born in the United States (%)
Residents speaking English at home - Native, born elsewhere (%)
Residents speaking English at home - Foreign born (%)
Residents speaking Spanish at home (%)
Residents speaking Spanish at home - Born in the United States (%)
Residents speaking Spanish at home - Native, born elsewhere (%)
Residents speaking Spanish at home - Foreign born (%)
Residents speaking other language at home (%)
Residents speaking other language at home - Born in the United States (%)
Residents speaking other language at home - Native, born elsewhere (%)
Residents speaking other language at home - Foreign born (%)
Marital status - Never married (%)
Marital status - Now married (%)
Marital status - Separated (%)
Marital status - Widowed (%)
Marital status - Divorced (%)
Ancestries Reported - Arab (%)
Ancestries Reported - Czech (%)
Ancestries Reported - Danish (%)
Ancestries Reported - Dutch (%)
Ancestries Reported - English (%)
Ancestries Reported - French (%)
Ancestries Reported - French Canadian (%)
Ancestries Reported - German (%)
Ancestries Reported - Greek (%)
Ancestries Reported - Hungarian (%)
Ancestries Reported - Irish (%)
Ancestries Reported - Italian (%)
Ancestries Reported - Lithuanian (%)
Ancestries Reported - Norwegian (%)
Ancestries Reported - Polish (%)
Ancestries Reported - Portuguese (%)
Ancestries Reported - Russian (%)
Ancestries Reported - Scotch-Irish (%)
Ancestries Reported - Scottish (%)
Ancestries Reported - Slovak (%)
Ancestries Reported - Subsaharan African (%)
Ancestries Reported - Swedish (%)
Ancestries Reported - Swiss (%)
Ancestries Reported - Ukrainian (%)
Ancestries Reported - United States (%)
Ancestries Reported - Welsh (%)
Ancestries Reported - West Indian (%)
Ancestries Reported - Other (%)
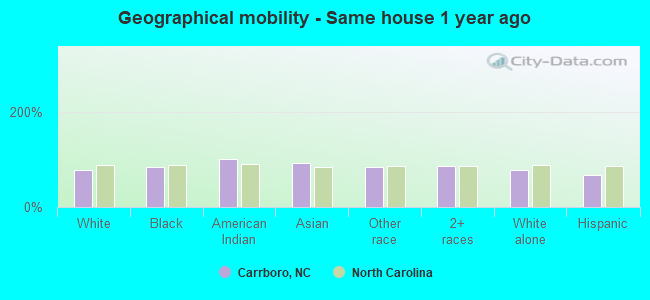
Geographical mobility - Same house 1 year ago (%)
Geographical mobility - Same house 1 year ago (%) - White
Geographical mobility - Same house 1 year ago (%) - Black or African American
Geographical mobility - Same house 1 year ago (%) - Asian
Geographical mobility - Same house 1 year ago (%) - Hispanic or Latino
Geographical mobility - Same house 1 year ago (%) - American Indian and Alaska Native
Geographical mobility - Same house 1 year ago (%) - Multirace
Geographical mobility - Same house 1 year ago (%) - Other Race
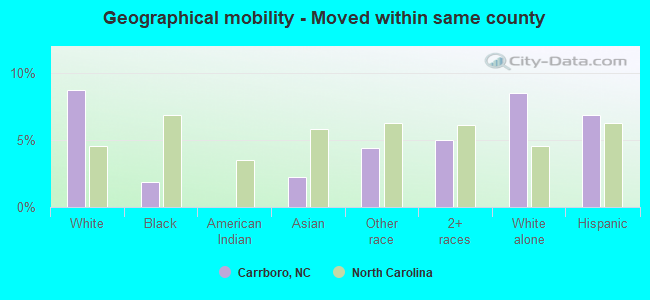
Geographical mobility - Moved within same county (%)
Geographical mobility - Moved within same county (%) - White
Geographical mobility - Moved within same county (%) - Black or African American
Geographical mobility - Moved within same county (%) - Asian
Geographical mobility - Moved within same county (%) - Hispanic or Latino
Geographical mobility - Moved within same county (%) - American Indian and Alaska Native
Geographical mobility - Moved within same county (%) - Multirace
Geographical mobility - Moved within same county (%) - Other Race
Geographical mobility - Moved from different county within same state (%)
Geographical mobility - Moved from different county within same state (%) - White
Geographical mobility - Moved from different county within same state (%) - Black or African American
Geographical mobility - Moved from different county within same state (%) - Asian
Geographical mobility - Moved from different county within same state (%) - Hispanic or Latino
Geographical mobility - Moved from different county within same state (%) - American Indian and Alaska Native
Geographical mobility - Moved from different county within same state (%) - Multirace
Geographical mobility - Moved from different county within same state (%) - Other Race
Geographical mobility - Moved from different state (%)
Geographical mobility - Moved from different state (%) - White
Geographical mobility - Moved from different state (%) - Black or African American
Geographical mobility - Moved from different state (%) - Asian
Geographical mobility - Moved from different state (%) - Hispanic or Latino
Geographical mobility - Moved from different state (%) - American Indian and Alaska Native
Geographical mobility - Moved from different state (%) - Multirace
Geographical mobility - Moved from different state (%) - Other Race
Geographical mobility - Moved from abroad (%)
Geographical mobility - Moved from abroad (%) - White
Geographical mobility - Moved from abroad (%) - Black or African American
Geographical mobility - Moved from abroad (%) - Asian
Geographical mobility - Moved from abroad (%) - Hispanic or Latino
Geographical mobility - Moved from abroad (%) - American Indian and Alaska Native
Geographical mobility - Moved from abroad (%) - Multirace
Geographical mobility - Moved from abroad (%) - Other Race
Place of birth for the foreign-born population - Ireland (%)
Place of birth for the foreign-born population - Denmark (%)
Place of birth for the foreign-born population - Norway (%)
Place of birth for the foreign-born population - Sweden (%)
Place of birth for the foreign-born population - United Kingdom (%)
Place of birth for the foreign-born population - England (%)
Place of birth for the foreign-born population - Scotland (%)
Place of birth for the foreign-born population - Other Northern Europe (%)
Place of birth for the foreign-born population - Austria (%)
Place of birth for the foreign-born population - Belgium (%)
Place of birth for the foreign-born population - France (%)
Place of birth for the foreign-born population - Germany (%)
Place of birth for the foreign-born population - Netherlands (%)
Place of birth for the foreign-born population - Switzerland (%)
Place of birth for the foreign-born population - Other Western Europe (%)
Place of birth for the foreign-born population - Greece (%)
Place of birth for the foreign-born population - Italy (%)
Place of birth for the foreign-born population - Portugal (%)
Place of birth for the foreign-born population - Spain (%)
Place of birth for the foreign-born population - Other Southern Europe (%)
Place of birth for the foreign-born population - Albania (%)
Place of birth for the foreign-born population - Belarus (%)
Place of birth for the foreign-born population - Bosnia and Herzegovina (%)
Place of birth for the foreign-born population - Bulgaria (%)
Place of birth for the foreign-born population - Croatia (%)
Place of birth for the foreign-born population - Czechoslovakia (%)
Place of birth for the foreign-born population - Hungary (%)
Place of birth for the foreign-born population - Latvia (%)
Place of birth for the foreign-born population - Lithuania (%)
Place of birth for the foreign-born population - North Macedonia (Macedonia) (%)
Place of birth for the foreign-born population - Moldova (%)
Place of birth for the foreign-born population - Poland (%)
Place of birth for the foreign-born population - Romania (%)
Place of birth for the foreign-born population - Russia (%)
Place of birth for the foreign-born population - Serbia (%)
Place of birth for the foreign-born population - Ukraine (%)
Place of birth for the foreign-born population - Other Eastern Europe (%)
Place of birth for the foreign-born population - China (%)
Place of birth for the foreign-born population - Hong Kong (%)
Place of birth for the foreign-born population - Taiwan (%)
Place of birth for the foreign-born population - Japan (%)
Place of birth for the foreign-born population - Korea (%)
Place of birth for the foreign-born population - Other Eastern Asia (%)
Place of birth for the foreign-born population - Afghanistan (%)
Place of birth for the foreign-born population - Bangladesh (%)
Place of birth for the foreign-born population - India (%)
Place of birth for the foreign-born population - Iran (%)
Place of birth for the foreign-born population - Kazakhstan (%)
Place of birth for the foreign-born population - Nepal (%)
Place of birth for the foreign-born population - Pakistan (%)
Place of birth for the foreign-born population - Sri Lanka (%)
Place of birth for the foreign-born population - Uzbekistan (%)
Place of birth for the foreign-born population - Other South Central Asia (%)
Place of birth for the foreign-born population - Burma (%)
Place of birth for the foreign-born population - Cambodia (%)
Place of birth for the foreign-born population - Indonesia (%)
Place of birth for the foreign-born population - Laos (%)
Place of birth for the foreign-born population - Malaysia (%)
Place of birth for the foreign-born population - Philippines (%)
Place of birth for the foreign-born population - Singapore (%)
Place of birth for the foreign-born population - Thailand (%)
Place of birth for the foreign-born population - Vietnam (%)
Place of birth for the foreign-born population - Other South Eastern Asia (%)
Place of birth for the foreign-born population - Armenia (%)
Place of birth for the foreign-born population - Iraq (%)
Place of birth for the foreign-born population - Israel (%)
Place of birth for the foreign-born population - Jordan (%)
Place of birth for the foreign-born population - Kuwait (%)
Place of birth for the foreign-born population - Lebanon (%)
Place of birth for the foreign-born population - Saudi Arabia (%)
Place of birth for the foreign-born population - Syria (%)
Place of birth for the foreign-born population - Turkey (%)
Place of birth for the foreign-born population - Yemen (%)
Place of birth for the foreign-born population - Other Western Asia (%)
Place of birth for the foreign-born population - Eritrea (%)
Place of birth for the foreign-born population - Ethiopia (%)
Place of birth for the foreign-born population - Kenya (%)
Place of birth for the foreign-born population - Somalia (%)
Place of birth for the foreign-born population - Uganda (%)
Place of birth for the foreign-born population - Zimbabwe (%)
Place of birth for the foreign-born population - Other Eastern Africa (%)
Place of birth for the foreign-born population - Cameroon (%)
Place of birth for the foreign-born population - Congo (%)
Place of birth for the foreign-born population - Democratic Republic of Congo (Zaire) (%)
Place of birth for the foreign-born population - Other Middle Africa (%)
Place of birth for the foreign-born population - Egypt (%)
Place of birth for the foreign-born population - Morocco (%)
Place of birth for the foreign-born population - Sudan (%)
Place of birth for the foreign-born population - Other Northern Africa (%)
Place of birth for the foreign-born population - South Africa (%)
Place of birth for the foreign-born population - Other Southern Africa (%)
Place of birth for the foreign-born population - Cabo Verde (%)
Place of birth for the foreign-born population - Ghana (%)
Place of birth for the foreign-born population - Liberia (%)
Place of birth for the foreign-born population - Nigeria (%)
Place of birth for the foreign-born population - Senegal (%)
Place of birth for the foreign-born population - Sierra Leone (%)
Place of birth for the foreign-born population - Other Western Africa (%)
Place of birth for the foreign-born population - Australia (%)
Place of birth for the foreign-born population - New Zealand (%)
Place of birth for the foreign-born population - Fiji (%)
Place of birth for the foreign-born population - Micronesia (%)
Place of birth for the foreign-born population - Bahamas (%)
Place of birth for the foreign-born population - Barbados (%)
Place of birth for the foreign-born population - Cuba (%)
Place of birth for the foreign-born population - Dominica (%)
Place of birth for the foreign-born population - Dominican Republic (%)
Place of birth for the foreign-born population - Grenada (%)
Place of birth for the foreign-born population - Haiti (%)
Place of birth for the foreign-born population - Jamaica (%)
Place of birth for the foreign-born population - St. Vincent and the Grenadines (%)
Place of birth for the foreign-born population - Trinidad and Tobago (%)
Place of birth for the foreign-born population - West Indies (%)
Place of birth for the foreign-born population - Other Caribbean (%)
Place of birth for the foreign-born population - Belize (%)
Place of birth for the foreign-born population - Costa Rica (%)
Place of birth for the foreign-born population - El Salvador (%)
Place of birth for the foreign-born population - Guatemala (%)
Place of birth for the foreign-born population - Honduras (%)
Place of birth for the foreign-born population - Mexico (%)
Place of birth for the foreign-born population - Nicaragua (%)
Place of birth for the foreign-born population - Panama (%)
Place of birth for the foreign-born population - Other Central America (%)
Place of birth for the foreign-born population - Argentina (%)
Place of birth for the foreign-born population - Bolivia (%)
Place of birth for the foreign-born population - Brazil (%)
Place of birth for the foreign-born population - Chile (%)
Place of birth for the foreign-born population - Colombia (%)
Place of birth for the foreign-born population - Ecuador (%)
Place of birth for the foreign-born population - Guyana (%)
Place of birth for the foreign-born population - Peru (%)
Place of birth for the foreign-born population - Uruguay (%)
Place of birth for the foreign-born population - Venezuela (%)
Place of birth for the foreign-born population - Other South America (%)
Place of birth for the foreign-born population - Canada (%)
Place of birth for the foreign-born population - Other Northern America (%)
Place of birth for the foreign-born population - Other (%)
Latest news about races in Carrboro, NC collected exclusively by city-data.com from local newspapers, TV, and radio stations
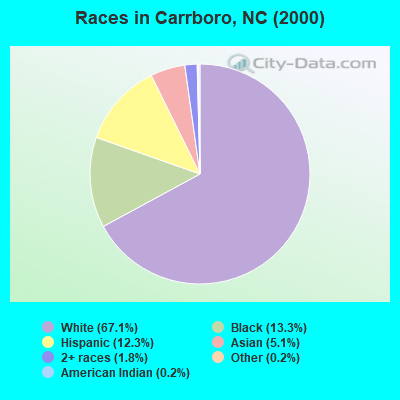
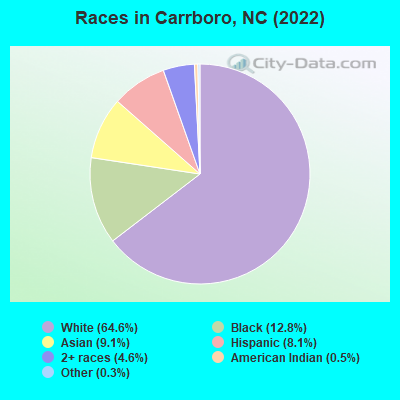
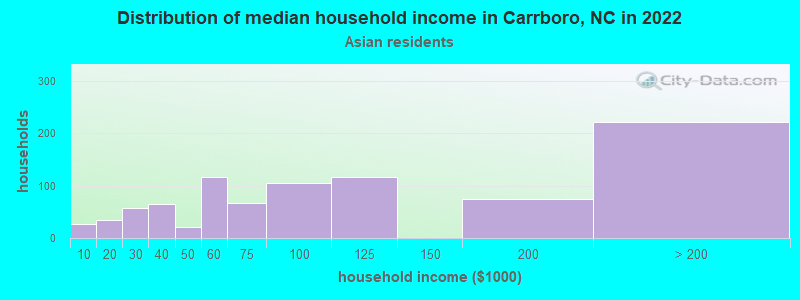
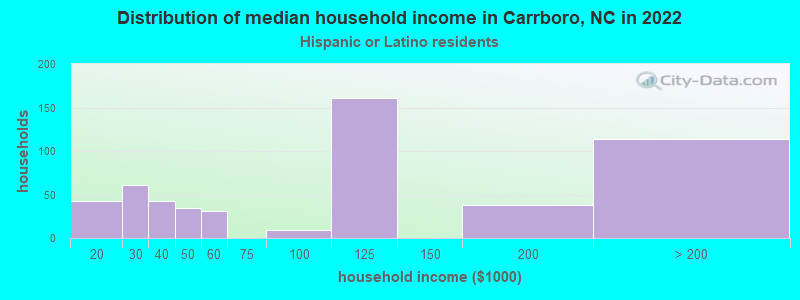
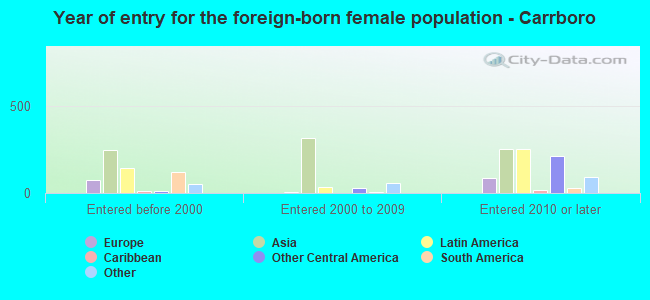
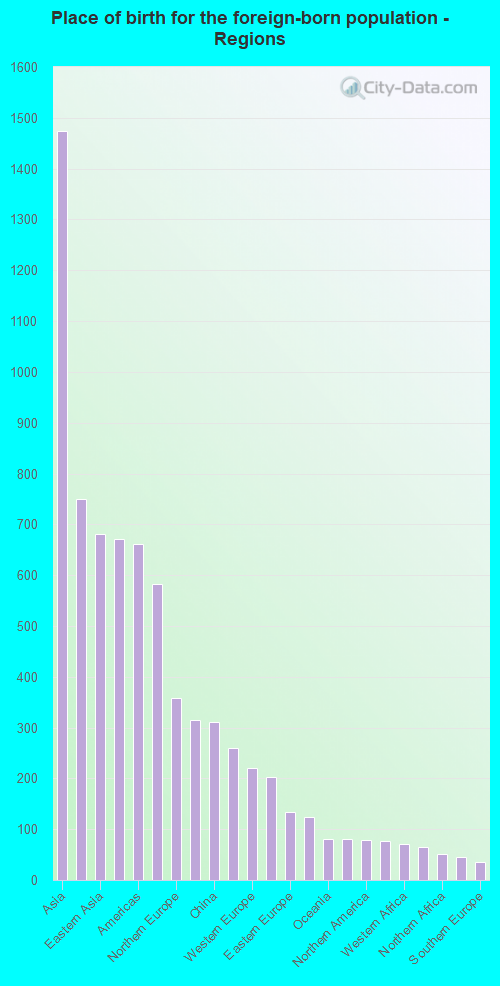
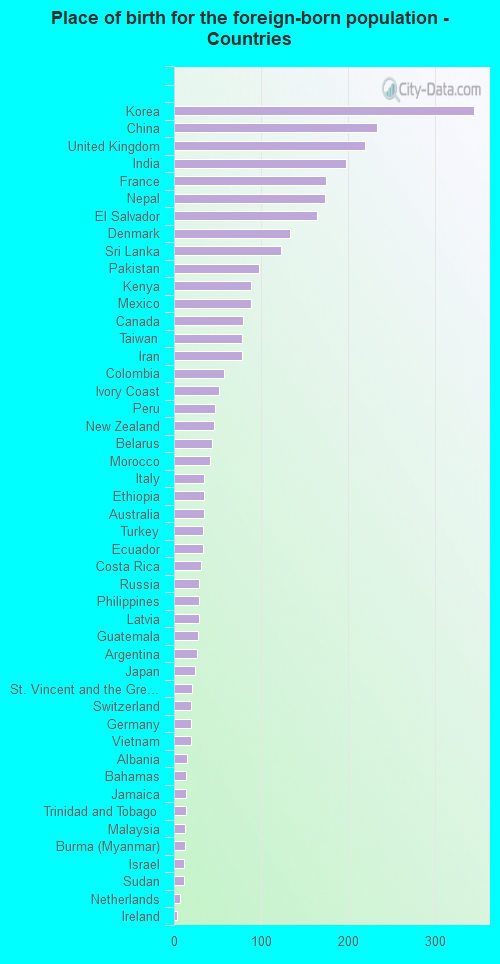
According to 2022 data, the most numerous races in Carrboro, NC are White alone (14,155 residents), Black alone (2,797 residents), and Hispanic (1,781 residents). 85.9% of Carrboro residents speak English at home. 14.7% of Carrboro, NC residents are foreign-born (6.6% born in Asia, 3.3% born in Europe, 2.6% born in Latin America), which is 45.7% greater than the foreign-born rate of 8.0% across the entire state of North Carolina.
Race distribution in Carrboro
2000 2022
5,647,155 70.2% White alone 1,723,301 21.4% Black alone 378,963 4.7% Hispanic 112,416 1.4% Asian alone 95,333 1.2% American Indian alone 79,965 1.0% Two or more races 9,015 0.1% Other race alone 3,165 0.04% Native Hawaiian and Other
6,497,519 60.7% White alone 2,155,650 20.1% Black alone 1,114,799 10.4% Hispanic 438,061 4.1% Two or more races 341,052 3.2% Asian alone 91,758 0.9% American Indian alone 50,180 0.5% Other race alone 9,954 0.09% Native Hawaiian and Other
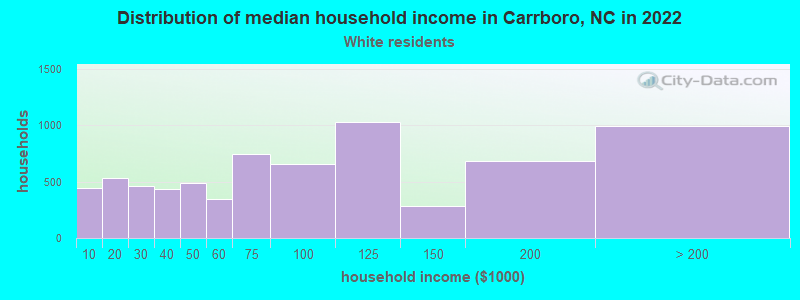
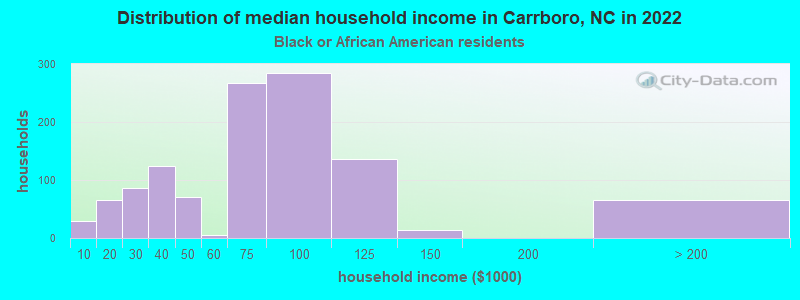
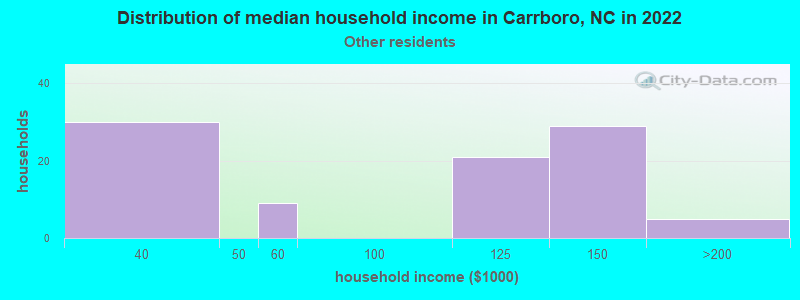
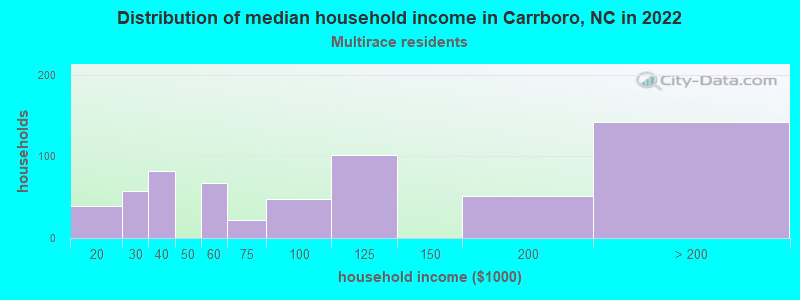
Income and house value in Carrboro Median household income in 2022 $80,724 White non-Hispanic householders$81,843 Black householders$82,999 Asian householders$125,431 Two or more races householders$99,242 Hispanic or Latino race householdersMedian 2022 house value $556,150 White Non-Hispanic householders$343,813 Black or African American householders $345,356 Asian householders$262,335 Some other race householders$203,695 Two or more races householders$272,211 Hispanic or Latino householders
Median age by race in Carrboro
34.0 Median age for White residents33.0 35.2 30.3 Median age for Black or African American residents28.2 34.8 43.2 Median age for American Indian / Alaska Native residents-668,604,650.5 44.3 25.7 Median age for Asian residents24.4 26.4 -609,884,331.7 Median age for Native Hawaiian / Pacific Islander residents-666,666,666.0 -612,403,100.2 42.5 Median age for Other race residents45.6 77.2 22.8 Median age for Two or more races residents22.5 23.2 34.0 Median age for White alone residents32.6 35.1 25.8 Median age for Hispanic or Latino residents24.9 25.1
Owner/renter occupied households by race in Carrboro
House owners and renters - White residents 3,223 45.9% Owner occupied3,802 54.1% Renter occupiedHouse owners and renters - Black or African American residents 338 32.6% Owner occupied699 67.4% Renter occupiedHouse owners and renters - Asian residents 438 63.5% Owner occupied252 36.5% Renter occupiedHouse owners and renters - Other race residents 31 32.6% Owner occupied64 67.4% Renter occupiedHouse owners and renters - Two or more races residents 268 61.0% Owner occupied171 39.0% Renter occupiedHouse owners and renters - White alone residents 3,161 45.8% Owner occupied3,741 54.2% Renter occupiedHouse owners and renters - Hispanic or Latino residents 239 52.1% Owner occupied219 47.9% Renter occupied
Language usage in Carrboro
English speakers - Total 85.9% of residents of Carrboro speak English at home.
4.7% of residents speak Spanish at home 597 60.3% Speak English very well393 39.7% Speak English less than very well9.2% of residents speak other language at home 1,339 68.7% Speak English very well609 31.3% Speak English less than very well
English speakers - Born in the United States 94.1% of residents of Carrboro speak English at home.
2.5% of residents speak Spanish at home 252 88.7% Speak English very well32 11.3% Speak English less than very well3.3% of residents speak other language at home 362 96.5% Speak English very well13 3.5% Speak English less than very well
English speakers - Native, born elsewhere 69.4% of residents of Carrboro speak English at home.
6.5% of residents speak Spanish at home 34 100.0% Speak English very well16.7% of residents speak other language at home 69 78.4% Speak English very well19 21.6% Speak English less than very well
English speakers - Foreign-born 32.9% of residents of Carrboro speak English at home.
16.4% of residents speak Spanish at home 166 39.4% Speak English very well255 60.6% Speak English less than very well48.4% of residents speak other language at home 667 53.7% Speak English very well576 46.3% Speak English less than very well
White (Caucasian) - Speak only English Native:
96.9% (12,645)Foreign-born:
46.7% (342)
White (Caucasian) - Speak another language Native:
3.2% (424)Foreign-born:
53.3% (391)
Black or African American - Speak only English Native:
94.7% (2,408)Foreign-born:
40.8% (116)
Black or African American - Speak another language Native:
5.1% (130)Foreign-born:
59.2% (168)
Asian - Speak only English Native:
48.4% (283)Foreign-born:
29.4% (353)
Asian - Speak another language Native:
51.8% (302)Foreign-born:
70.3% (845)
Other race - Speak only English Native:
87.6% (92)Foreign-born:
13.2% (49)
Two or more races - Speak only English Native:
77.7% (1,319)Foreign-born:
41.9% (61)
Two or more races - Speak another language Native:
22.1% (374)Foreign-born:
62.0% (90)
White alone - Speak only English Native:
96.8% (12,421)Foreign-born:
44.0% (331)
White alone - Speak another language Native:
3.2% (414)Foreign-born:
55.2% (415)
Hispanic or Latino - Speak only English Native:
69.2% (779)Foreign-born:
14.1% (68)
Hispanic or Latino - Speak another language Native:
36.0% (405)Foreign-born:
86.0% (416)
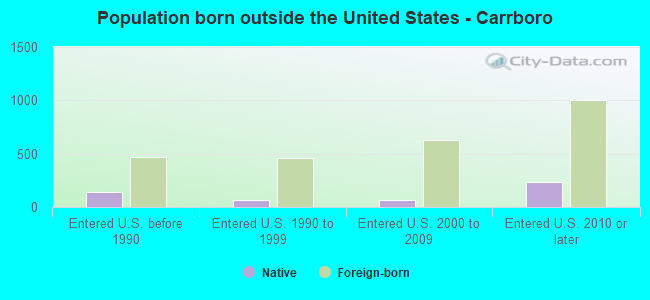
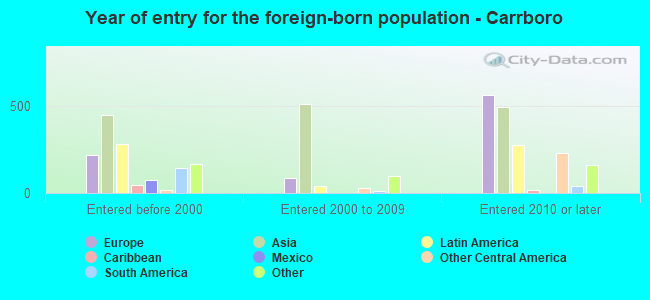
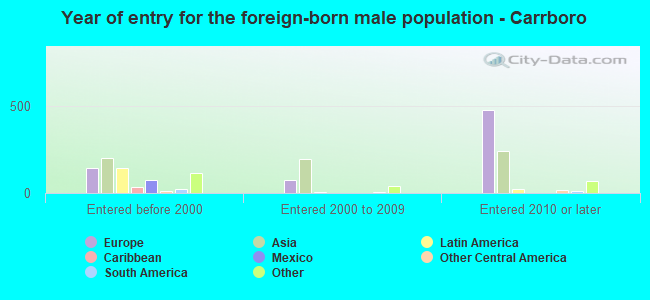
Foreign-born residents in Carrboro 3,230 residents are foreign born (6.6% Asia , 3.3% Europe , 2.6% Latin America ).
This city:
14.7%North Carolina:
8.3%
Marital status for residents in Carrboro Marital status - White (Caucasian) population 15 years and over
Males 44.0% Never married47.7% Now married1.2% Separated1.0% Widowed6.1% DivorcedFemales 39.2% Never married46.0% Now married2.5% Separated3.5% Widowed8.9% DivorcedWomen who gave birth in the past 12 months Now married:
100.0% (120)Unmarried:
0.0% (0)
Women who did not give birth in the past 12 months Now married:
35.8% (1,329)Unmarried:
64.2% (2,389)
Marital status - Black or African American population 15 years and over
Males 39.5% Never married40.0% Now married7.9% Separated3.5% Widowed9.1% DivorcedFemales 37.4% Never married35.1% Now married3.4% Separated11.7% Widowed12.4% DivorcedWomen who gave birth in the past 12 months Now married:
100.0% (33)Unmarried:
0.0% (0)
Women who did not give birth in the past 12 months Now married:
36.8% (264)Unmarried:
63.2% (454)
Marital status - Asian population 15 years and over
Males 40.2% Never married59.8% Now married0.0% Separated0.0% Widowed0.0% DivorcedFemales 16.1% Never married66.3% Now married1.6% Separated14.4% Widowed1.5% DivorcedWomen who did not give birth in the past 12 months Now married:
73.3% (611)Unmarried:
26.7% (223)
Marital status - Other race population 15 years and over
Males 0.0% Never married71.9% Now married28.1% Separated0.0% Widowed0.0% DivorcedFemales 36.7% Never married5.5% Now married0.0% Separated57.8% Widowed0.0% DivorcedWomen who did not give birth in the past 12 months Now married:
13.0% (26)Unmarried:
87.0% (176)
Marital status - Two or more races population 15 years and over
Males 34.7% Never married54.6% Now married0.0% Separated0.0% Widowed10.6% DivorcedFemales 60.1% Never married38.4% Now married1.5% Separated0.0% Widowed0.0% DivorcedWomen who did not give birth in the past 12 months Now married:
35.4% (224)Unmarried:
64.6% (409)
Marital status - White alone, not Hispanic / Latino population 15 years and over
Males 44.0% Never married47.6% Now married1.2% Separated1.0% Widowed6.2% DivorcedFemales 38.7% Never married47.6% Now married2.0% Separated3.5% Widowed8.2% DivorcedWomen who gave birth in the past 12 months Now married:
100.0% (124)Unmarried:
0.0% (0)
Women who did not give birth in the past 12 months Now married:
36.4% (1,312)Unmarried:
63.6% (2,292)
Marital status - Hispanic or Latino population 15 years and over
Males 24.4% Never married72.8% Now married2.8% Separated0.0% Widowed0.0% DivorcedFemales 50.6% Never married21.7% Now married4.4% Separated16.3% Widowed7.0% DivorcedWomen who did not give birth in the past 12 months Now married:
27.4% (192)Unmarried:
72.6% (506)
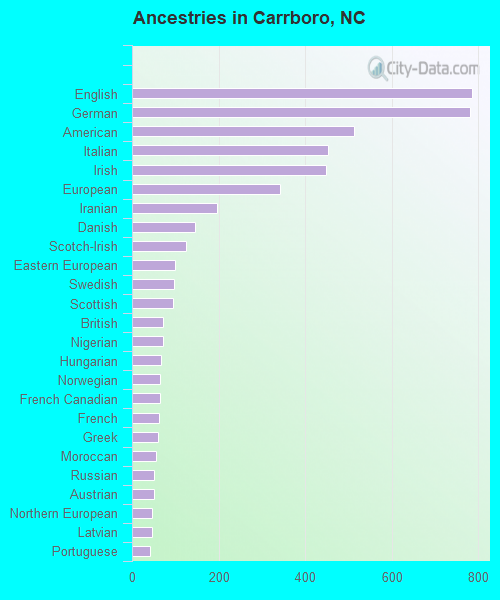
Ancestries in Carrboro
786 7.9% English782 7.9% German513 5.2% American454 4.6% Italian448 4.5% Irish343 3.4% European197 2.0% Iranian146 1.5% Danish125 1.3% Scotch-Irish99 1.0% Eastern European96 1.0% Swedish94 0.9% Scottish72 0.7% British72 0.7% Nigerian67 0.7% Hungarian65 0.7% Norwegian65 0.7% French Canadian63 0.6% French61 0.6% Greek56 0.6% Moroccan52 0.5% Russian51 0.5% Austrian47 0.5% Northern European47 0.5% Latvian42 0.4% Portuguese38 0.4% Ethiopian31 0.3% African29 0.3% Bahamian24 0.2% Turkish21 0.2% Scandinavian20 0.2% Polish16 0.2% Croatian16 0.2% Jamaican15 0.2% Romanian15 0.2% Slovene14 0.1% Dutch14 0.1% Trinidadian and Tobagonian13 0.1% Swiss13 0.1% Basque9 0.09% Lithuanian8 0.08% Czech8 0.08% Syrian5 0.05% Lebanese5 0.05% Egyptian
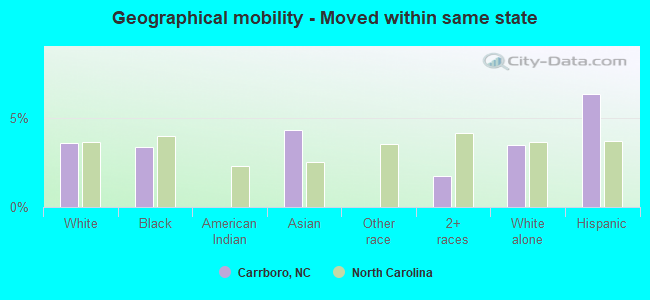
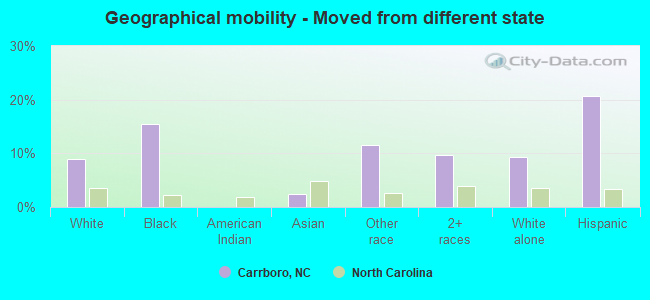
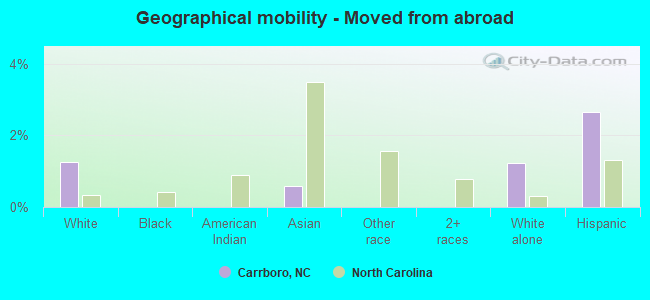
Geographical mobility in Carrboro Same house 1 year ago 11,113 77.7% White (Caucasian)2,557 83.8% Black or African American118 100.0% American Indian / Alaska Native1,834 91.5% Asian321 83.6% Other race1,569 86.3% Two or more races10,954 77.9% White alone, not Hispanic / Latino1,189 67.6% Hispanic or LatinoMoved within same county 1,247 8.7% White / Caucasian56 1.8% Black or African American45 2.3% Asian17 4.4% Other race91 5.0% Two or more races1,194 8.5% White alone, not Hispanic / Latino121 6.9% Hispanic or LatinoMoved within same state 512 3.6% White / Caucasian102 3.3% Black or African American86 4.3% Asian32 1.8% Two or more races489 3.5% White alone, not Hispanic / Latino111 6.3% Hispanic or LatinoMoved from different state 1,275 8.9% White / Caucasian472 15.5% Black or African American50 2.5% Asian44 11.5% Other race177 9.7% Two or more races1,310 9.3% White alone, not Hispanic / Latino363 20.7% Hispanic or LatinoMoved from abroad 181 1.3% White12 0.6% Asian175 1.2% White alone, not Hispanic / Latino47 2.7% Hispanic or Latino
Children Nativity (place of birth) in Carrboro
Children under 6 years - Living with two parents Both parents native 438 99.5% Native2 0.5% Foreign-bornBoth parents foreign-born 72 92.1% Native6 7.9% Foreign-bornOne native, one foreign-born parent 137 100.0% NativeChildren under 6 years - Living with one parent Native parent 113 100.0% NativeForeign-born parent 21 100.0% NativeChildren 6 to 17 years - Living with two parents Both parents native 1,784 99.0% Native18 1.0% Foreign-bornBoth parents foreign-born 291 91.6% Native27 8.4% Foreign-bornOne native, one foreign-born parent 416 100.0% NativeChildren 6 to 17 years - Living with one parent Native parent 722 83.6% Native141 16.4% Foreign-bornForeign-born parent 184 72.8% Native69 27.2% Foreign-born
Grandparents responsible for own grandchildren in Carrboro
Grandparents (30 to 59 years) White / Caucasian 9 100.0% Not responsible for grandchildrenWhite alone, not Hispanic / Latino 9 100.0% Not responsible for grandchildren
Grandparents (60 years and over) White / Caucasian 10 100.0% Not responsible for grandchildrenWhite alone, not Hispanic / Latino 10 100.0% Not responsible for grandchildren