Races in Citrus Heights, California (CA) Detailed Stats
Data:
Races - White alone (%)
Races - White alone (% change since 2000)
Races - Black alone (%)
Races - Black alone (% change since 2000)
Races - American Indian alone (%)
Races - American Indian alone (% change since 2000)
Races - Asian alone (%)
Races - Asian alone (% change since 2000)
Races - Hispanic (%)
Races - Hispanic (% change since 2000)
Races - Native Hawaiian and Other Pacific Islander alone (%)
Races - Native Hawaiian and Other Pacific Islander alone (% change since 2000)
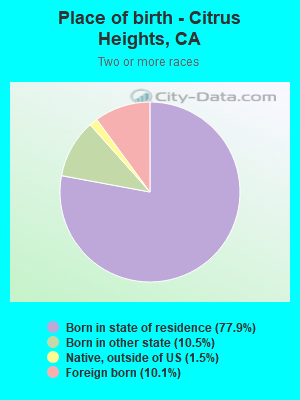
Races - Two or more races(%)
Races - Two or more races(% change since 2000)
Races - Other race alone (%)
Races - Other race alone (% change since 2000)
Racial diversity
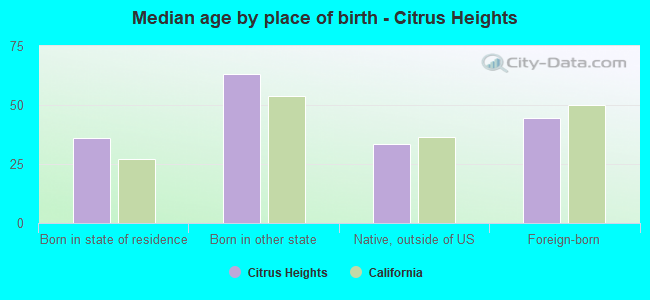
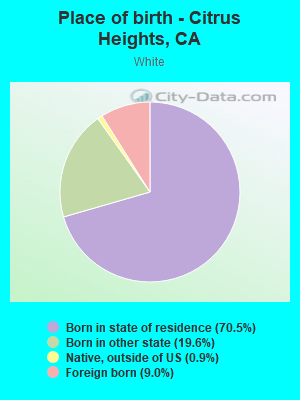
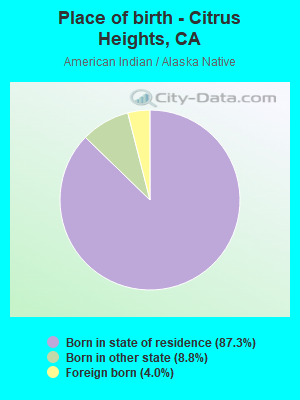
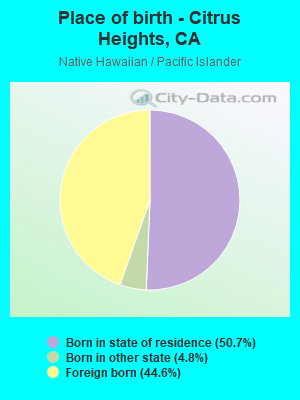
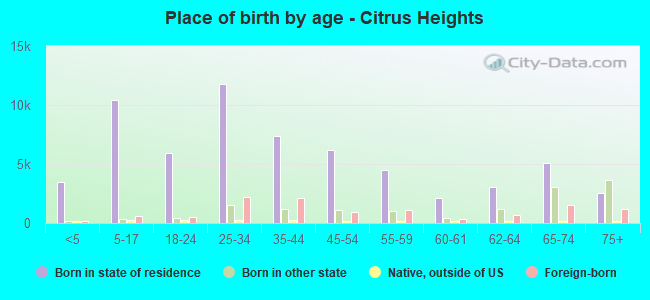
Place of birth - Born in state of residence (%)
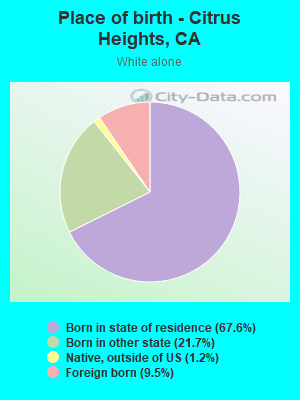
Place of birth - Born in state of residence (%) - White
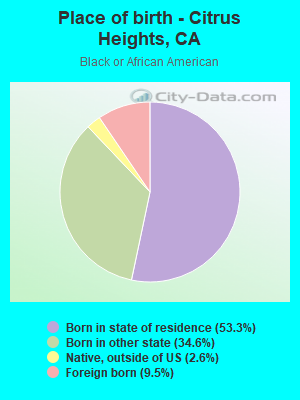
Place of birth - Born in state of residence (%) - Black or African American
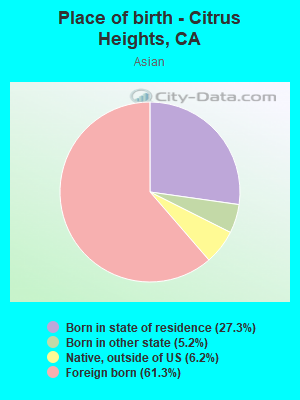
Place of birth - Born in state of residence (%) - Asian
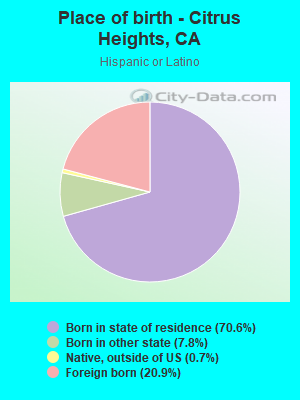
Place of birth - Born in state of residence (%) - Hispanic or Latino
Place of birth - Born in state of residence (%) - American Indian and Alaska Native
Place of birth - Born in state of residence (%) - Multirace
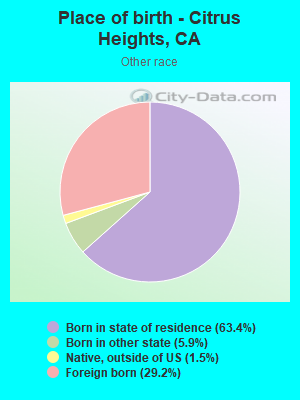
Place of birth - Born in state of residence (%) - Other Race
Place of birth - Born in other state (%)
Place of birth - Born in other state (%) - White
Place of birth - Born in other state (%) - Black or African American
Place of birth - Born in other state (%) - Asian
Place of birth - Born in other state (%) - Hispanic or Latino
Place of birth - Born in other state (%) - American Indian and Alaska Native
Place of birth - Born in other state (%) - Multirace
Place of birth - Born in other state (%) - Other Race
Place of birth - Native, outside of US (%)
Place of birth - Native, outside of US (%) - White
Place of birth - Native, outside of US (%) - Black or African American
Place of birth - Native, outside of US (%) - Asian
Place of birth - Native, outside of US (%) - Hispanic or Latino
Place of birth - Native, outside of US (%) - American Indian and Alaska Native
Place of birth - Native, outside of US (%) - Multirace
Place of birth - Native, outside of US (%) - Other Race
Place of birth - Foreign born (%)
Place of birth - Foreign born (%) - White
Place of birth - Foreign born (%) - Black or African American
Place of birth - Foreign born (%) - Asian
Place of birth - Foreign born (%) - Hispanic or Latino
Place of birth - Foreign born (%) - American Indian and Alaska Native
Place of birth - Foreign born (%) - Multirace
Place of birth - Foreign born (%) - Other Race
Residents speaking English at home (%)
Residents speaking English at home - Born in the United States (%)
Residents speaking English at home - Native, born elsewhere (%)
Residents speaking English at home - Foreign born (%)
Residents speaking Spanish at home (%)
Residents speaking Spanish at home - Born in the United States (%)
Residents speaking Spanish at home - Native, born elsewhere (%)
Residents speaking Spanish at home - Foreign born (%)
Residents speaking other language at home (%)
Residents speaking other language at home - Born in the United States (%)
Residents speaking other language at home - Native, born elsewhere (%)
Residents speaking other language at home - Foreign born (%)
Marital status - Never married (%)
Marital status - Now married (%)
Marital status - Separated (%)
Marital status - Widowed (%)
Marital status - Divorced (%)
Ancestries Reported - Arab (%)
Ancestries Reported - Czech (%)
Ancestries Reported - Danish (%)
Ancestries Reported - Dutch (%)
Ancestries Reported - English (%)
Ancestries Reported - French (%)
Ancestries Reported - French Canadian (%)
Ancestries Reported - German (%)
Ancestries Reported - Greek (%)
Ancestries Reported - Hungarian (%)
Ancestries Reported - Irish (%)
Ancestries Reported - Italian (%)
Ancestries Reported - Lithuanian (%)
Ancestries Reported - Norwegian (%)
Ancestries Reported - Polish (%)
Ancestries Reported - Portuguese (%)
Ancestries Reported - Russian (%)
Ancestries Reported - Scotch-Irish (%)
Ancestries Reported - Scottish (%)
Ancestries Reported - Slovak (%)
Ancestries Reported - Subsaharan African (%)
Ancestries Reported - Swedish (%)
Ancestries Reported - Swiss (%)
Ancestries Reported - Ukrainian (%)
Ancestries Reported - United States (%)
Ancestries Reported - Welsh (%)
Ancestries Reported - West Indian (%)
Ancestries Reported - Other (%)
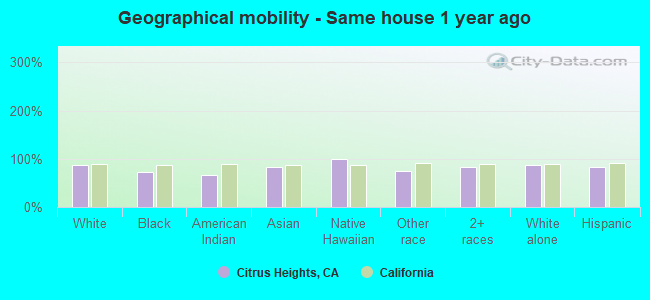
Geographical mobility - Same house 1 year ago (%)
Geographical mobility - Same house 1 year ago (%) - White
Geographical mobility - Same house 1 year ago (%) - Black or African American
Geographical mobility - Same house 1 year ago (%) - Asian
Geographical mobility - Same house 1 year ago (%) - Hispanic or Latino
Geographical mobility - Same house 1 year ago (%) - American Indian and Alaska Native
Geographical mobility - Same house 1 year ago (%) - Multirace
Geographical mobility - Same house 1 year ago (%) - Other Race
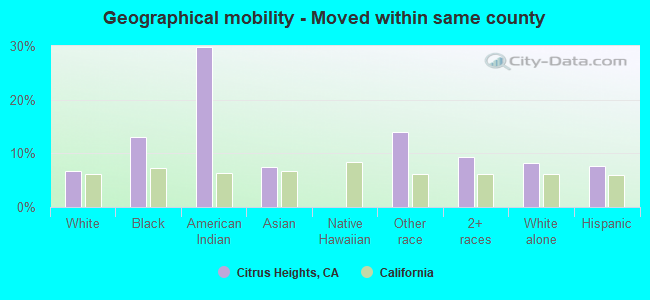
Geographical mobility - Moved within same county (%)
Geographical mobility - Moved within same county (%) - White
Geographical mobility - Moved within same county (%) - Black or African American
Geographical mobility - Moved within same county (%) - Asian
Geographical mobility - Moved within same county (%) - Hispanic or Latino
Geographical mobility - Moved within same county (%) - American Indian and Alaska Native
Geographical mobility - Moved within same county (%) - Multirace
Geographical mobility - Moved within same county (%) - Other Race
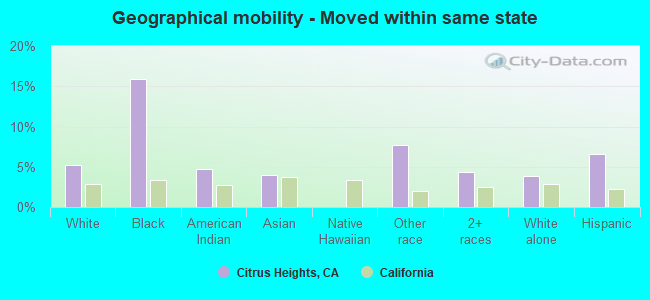
Geographical mobility - Moved from different county within same state (%)
Geographical mobility - Moved from different county within same state (%) - White
Geographical mobility - Moved from different county within same state (%) - Black or African American
Geographical mobility - Moved from different county within same state (%) - Asian
Geographical mobility - Moved from different county within same state (%) - Hispanic or Latino
Geographical mobility - Moved from different county within same state (%) - American Indian and Alaska Native
Geographical mobility - Moved from different county within same state (%) - Multirace
Geographical mobility - Moved from different county within same state (%) - Other Race
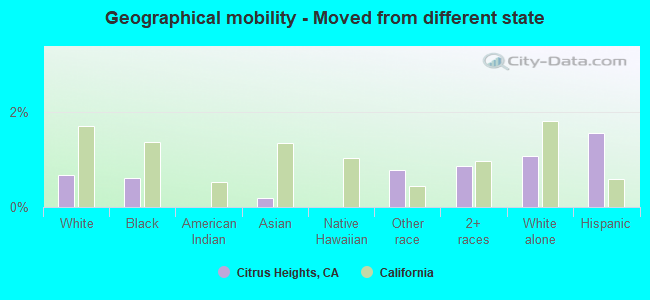
Geographical mobility - Moved from different state (%)
Geographical mobility - Moved from different state (%) - White
Geographical mobility - Moved from different state (%) - Black or African American
Geographical mobility - Moved from different state (%) - Asian
Geographical mobility - Moved from different state (%) - Hispanic or Latino
Geographical mobility - Moved from different state (%) - American Indian and Alaska Native
Geographical mobility - Moved from different state (%) - Multirace
Geographical mobility - Moved from different state (%) - Other Race
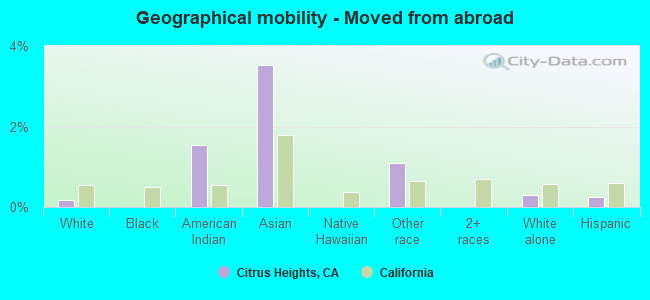
Geographical mobility - Moved from abroad (%)
Geographical mobility - Moved from abroad (%) - White
Geographical mobility - Moved from abroad (%) - Black or African American
Geographical mobility - Moved from abroad (%) - Asian
Geographical mobility - Moved from abroad (%) - Hispanic or Latino
Geographical mobility - Moved from abroad (%) - American Indian and Alaska Native
Geographical mobility - Moved from abroad (%) - Multirace
Geographical mobility - Moved from abroad (%) - Other Race
Place of birth for the foreign-born population - Ireland (%)
Place of birth for the foreign-born population - Denmark (%)
Place of birth for the foreign-born population - Norway (%)
Place of birth for the foreign-born population - Sweden (%)
Place of birth for the foreign-born population - United Kingdom (%)
Place of birth for the foreign-born population - England (%)
Place of birth for the foreign-born population - Scotland (%)
Place of birth for the foreign-born population - Other Northern Europe (%)
Place of birth for the foreign-born population - Austria (%)
Place of birth for the foreign-born population - Belgium (%)
Place of birth for the foreign-born population - France (%)
Place of birth for the foreign-born population - Germany (%)
Place of birth for the foreign-born population - Netherlands (%)
Place of birth for the foreign-born population - Switzerland (%)
Place of birth for the foreign-born population - Other Western Europe (%)
Place of birth for the foreign-born population - Greece (%)
Place of birth for the foreign-born population - Italy (%)
Place of birth for the foreign-born population - Portugal (%)
Place of birth for the foreign-born population - Spain (%)
Place of birth for the foreign-born population - Other Southern Europe (%)
Place of birth for the foreign-born population - Albania (%)
Place of birth for the foreign-born population - Belarus (%)
Place of birth for the foreign-born population - Bosnia and Herzegovina (%)
Place of birth for the foreign-born population - Bulgaria (%)
Place of birth for the foreign-born population - Croatia (%)
Place of birth for the foreign-born population - Czechoslovakia (%)
Place of birth for the foreign-born population - Hungary (%)
Place of birth for the foreign-born population - Latvia (%)
Place of birth for the foreign-born population - Lithuania (%)
Place of birth for the foreign-born population - North Macedonia (Macedonia) (%)
Place of birth for the foreign-born population - Moldova (%)
Place of birth for the foreign-born population - Poland (%)
Place of birth for the foreign-born population - Romania (%)
Place of birth for the foreign-born population - Russia (%)
Place of birth for the foreign-born population - Serbia (%)
Place of birth for the foreign-born population - Ukraine (%)
Place of birth for the foreign-born population - Other Eastern Europe (%)
Place of birth for the foreign-born population - China (%)
Place of birth for the foreign-born population - Hong Kong (%)
Place of birth for the foreign-born population - Taiwan (%)
Place of birth for the foreign-born population - Japan (%)
Place of birth for the foreign-born population - Korea (%)
Place of birth for the foreign-born population - Other Eastern Asia (%)
Place of birth for the foreign-born population - Afghanistan (%)
Place of birth for the foreign-born population - Bangladesh (%)
Place of birth for the foreign-born population - India (%)
Place of birth for the foreign-born population - Iran (%)
Place of birth for the foreign-born population - Kazakhstan (%)
Place of birth for the foreign-born population - Nepal (%)
Place of birth for the foreign-born population - Pakistan (%)
Place of birth for the foreign-born population - Sri Lanka (%)
Place of birth for the foreign-born population - Uzbekistan (%)
Place of birth for the foreign-born population - Other South Central Asia (%)
Place of birth for the foreign-born population - Burma (%)
Place of birth for the foreign-born population - Cambodia (%)
Place of birth for the foreign-born population - Indonesia (%)
Place of birth for the foreign-born population - Laos (%)
Place of birth for the foreign-born population - Malaysia (%)
Place of birth for the foreign-born population - Philippines (%)
Place of birth for the foreign-born population - Singapore (%)
Place of birth for the foreign-born population - Thailand (%)
Place of birth for the foreign-born population - Vietnam (%)
Place of birth for the foreign-born population - Other South Eastern Asia (%)
Place of birth for the foreign-born population - Armenia (%)
Place of birth for the foreign-born population - Iraq (%)
Place of birth for the foreign-born population - Israel (%)
Place of birth for the foreign-born population - Jordan (%)
Place of birth for the foreign-born population - Kuwait (%)
Place of birth for the foreign-born population - Lebanon (%)
Place of birth for the foreign-born population - Saudi Arabia (%)
Place of birth for the foreign-born population - Syria (%)
Place of birth for the foreign-born population - Turkey (%)
Place of birth for the foreign-born population - Yemen (%)
Place of birth for the foreign-born population - Other Western Asia (%)
Place of birth for the foreign-born population - Eritrea (%)
Place of birth for the foreign-born population - Ethiopia (%)
Place of birth for the foreign-born population - Kenya (%)
Place of birth for the foreign-born population - Somalia (%)
Place of birth for the foreign-born population - Uganda (%)
Place of birth for the foreign-born population - Zimbabwe (%)
Place of birth for the foreign-born population - Other Eastern Africa (%)
Place of birth for the foreign-born population - Cameroon (%)
Place of birth for the foreign-born population - Congo (%)
Place of birth for the foreign-born population - Democratic Republic of Congo (Zaire) (%)
Place of birth for the foreign-born population - Other Middle Africa (%)
Place of birth for the foreign-born population - Egypt (%)
Place of birth for the foreign-born population - Morocco (%)
Place of birth for the foreign-born population - Sudan (%)
Place of birth for the foreign-born population - Other Northern Africa (%)
Place of birth for the foreign-born population - South Africa (%)
Place of birth for the foreign-born population - Other Southern Africa (%)
Place of birth for the foreign-born population - Cabo Verde (%)
Place of birth for the foreign-born population - Ghana (%)
Place of birth for the foreign-born population - Liberia (%)
Place of birth for the foreign-born population - Nigeria (%)
Place of birth for the foreign-born population - Senegal (%)
Place of birth for the foreign-born population - Sierra Leone (%)
Place of birth for the foreign-born population - Other Western Africa (%)
Place of birth for the foreign-born population - Australia (%)
Place of birth for the foreign-born population - New Zealand (%)
Place of birth for the foreign-born population - Fiji (%)
Place of birth for the foreign-born population - Micronesia (%)
Place of birth for the foreign-born population - Bahamas (%)
Place of birth for the foreign-born population - Barbados (%)
Place of birth for the foreign-born population - Cuba (%)
Place of birth for the foreign-born population - Dominica (%)
Place of birth for the foreign-born population - Dominican Republic (%)
Place of birth for the foreign-born population - Grenada (%)
Place of birth for the foreign-born population - Haiti (%)
Place of birth for the foreign-born population - Jamaica (%)
Place of birth for the foreign-born population - St. Vincent and the Grenadines (%)
Place of birth for the foreign-born population - Trinidad and Tobago (%)
Place of birth for the foreign-born population - West Indies (%)
Place of birth for the foreign-born population - Other Caribbean (%)
Place of birth for the foreign-born population - Belize (%)
Place of birth for the foreign-born population - Costa Rica (%)
Place of birth for the foreign-born population - El Salvador (%)
Place of birth for the foreign-born population - Guatemala (%)
Place of birth for the foreign-born population - Honduras (%)
Place of birth for the foreign-born population - Mexico (%)
Place of birth for the foreign-born population - Nicaragua (%)
Place of birth for the foreign-born population - Panama (%)
Place of birth for the foreign-born population - Other Central America (%)
Place of birth for the foreign-born population - Argentina (%)
Place of birth for the foreign-born population - Bolivia (%)
Place of birth for the foreign-born population - Brazil (%)
Place of birth for the foreign-born population - Chile (%)
Place of birth for the foreign-born population - Colombia (%)
Place of birth for the foreign-born population - Ecuador (%)
Place of birth for the foreign-born population - Guyana (%)
Place of birth for the foreign-born population - Peru (%)
Place of birth for the foreign-born population - Uruguay (%)
Place of birth for the foreign-born population - Venezuela (%)
Place of birth for the foreign-born population - Other South America (%)
Place of birth for the foreign-born population - Canada (%)
Place of birth for the foreign-born population - Other Northern America (%)
Place of birth for the foreign-born population - Other (%)
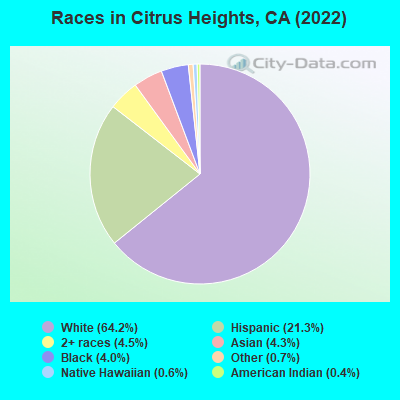
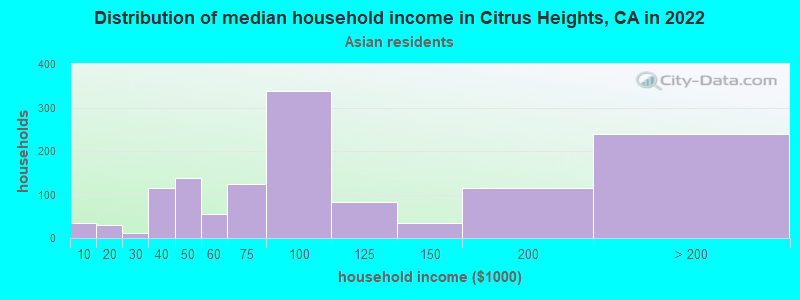
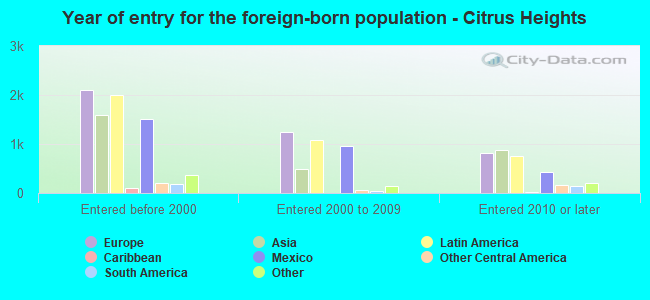
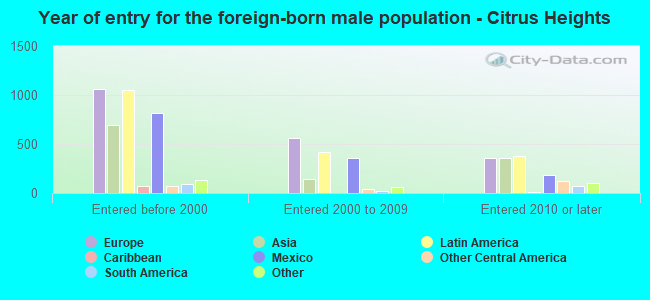
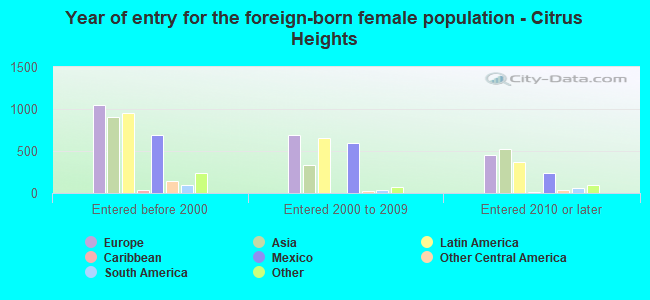
According to 2022 data, the most numerous races in Citrus Heights, CA are Hispanic (17,424 residents), White alone (57,759 residents), and Asian alone (3,090 residents). 81.1% of Citrus Heights residents speak English at home. 13.3% of Citrus Heights, CA residents are foreign-born (4.9% born in Europe, 4.5% born in Latin America, 3.3% born in Asia), which is 95.3% less than the foreign-born rate of 26.0% across the entire state of California.
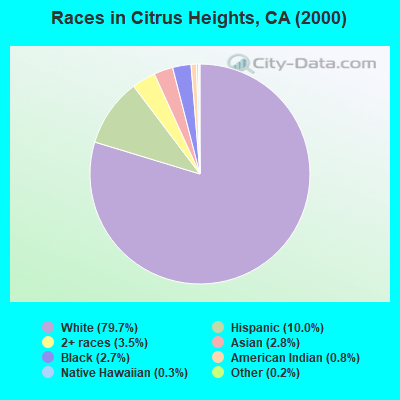
Race distribution in Citrus Heights
2000 2022
67,809 79.7% White alone 8,539 10.0% Hispanic 2,964 3.5% Two or more races 2,344 2.8% Asian alone 2,334 2.7% Black alone 678 0.8% American Indian alone 245 0.3% Native Hawaiian and Other 158 0.2% Other race alone
57,759 65.7% White alone 17,424 19.8% Hispanic 4,468 5.1% Two or more races 3,090 3.5% Asian alone 2,639 3.0% Black alone 446 0.5% American Indian alone
2000 2022
15,816,790 46.7% White alone 10,966,556 32.4% Hispanic 3,648,860 10.8% Asian alone 2,181,926 6.4% Black alone 903,115 2.7% Two or more races 178,984 0.5% American Indian alone 103,736 0.3% Native Hawaiian and Other 71,681 0.2% Other race alone
15,732,184 40.3% Hispanic 13,160,426 33.7% White alone 5,957,867 15.3% Asian alone 2,025,218 5.2% Black alone 1,663,222 4.3% Two or more races 251,618 0.6% Other race alone 135,777 0.3% Native Hawaiian and Other 103,030 0.3% American Indian alone
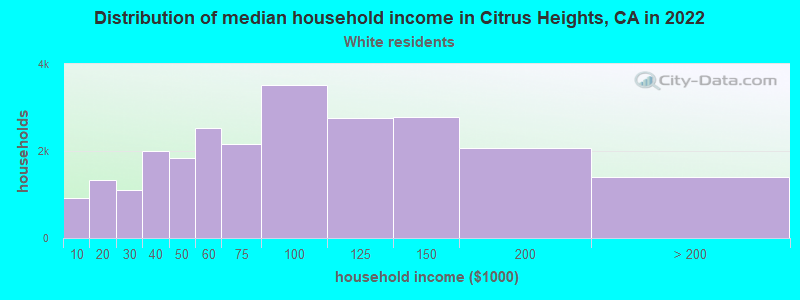
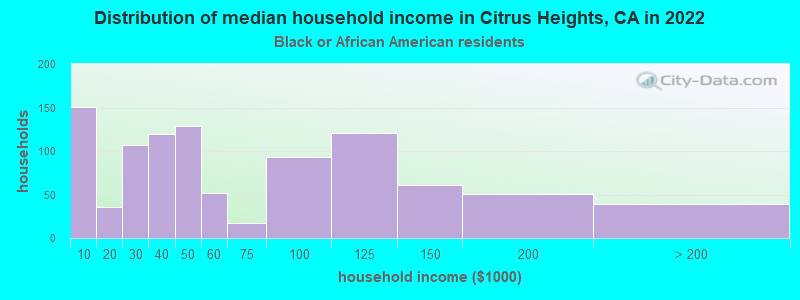
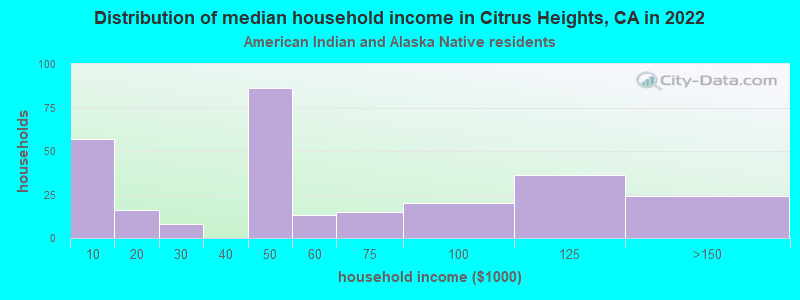
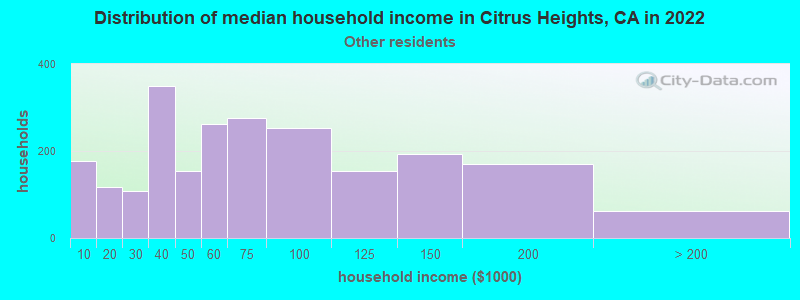
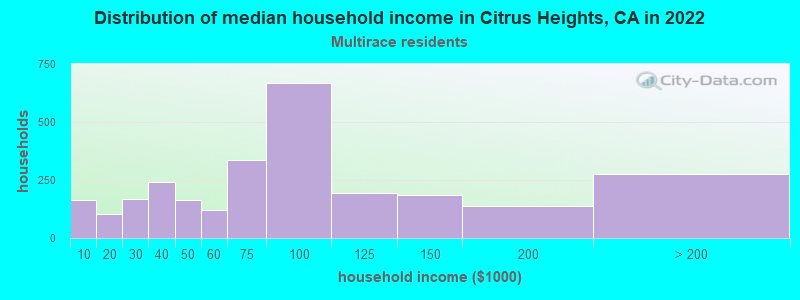
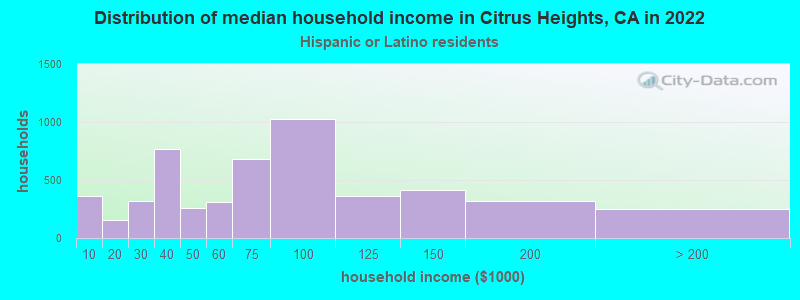
Income and house value in Citrus Heights Median household income in 2022 $80,184 White non-Hispanic householders$50,782 Black householders$54,689 American Indian and Alaska Native householders$68,485 Asian householders$74,547 Native Hawaiian and other Pacific Islander householders$65,298 Some other race householders$70,907 Two or more races householders$77,201 Hispanic or Latino race householdersMedian 2022 house value $494,543 White Non-Hispanic householders$528,016 Black or African American householders$465,388 American Indian or Alaska Native householders $525,137 Asian householders$449,912 Native Hawaiian and other Pacific Islander householders$449,192 Some other race householders$437,314 Two or more races householders$486,984 Hispanic or Latino householders
Median age by race in Citrus Heights
44.9 Median age for White residents41.4 49.1 35.7 Median age for Black or African American residents37.0 29.6 25.5 Median age for American Indian / Alaska Native residents61.6 24.2 45.4 Median age for Asian residents47.2 41.9 35.9 Median age for Native Hawaiian / Pacific Islander residents30.4 46.4 32.7 Median age for Other race residents30.1 36.2 32.3 Median age for Two or more races residents31.2 40.6 46.9 Median age for White alone residents43.0 49.2 29.7 Median age for Hispanic or Latino residents27.1 30.4
Owner/renter occupied households by race in Citrus Heights
House owners and renters - White residents 17,691 66.0% Owner occupied9,109 34.0% Renter occupiedHouse owners and renters - Black or African American residents 349 22.8% Owner occupied1,181 77.2% Renter occupiedHouse owners and renters - American Indian / Alaska Native residents 112 35.9% Owner occupied199 64.1% Renter occupiedHouse owners and renters - Asian residents 557 47.7% Owner occupied611 52.3% Renter occupiedHouse owners and renters - Native Hawaiian / Pacific Islander residents 11 100.0% Owner occupiedHouse owners and renters - Other race residents 479 42.0% Owner occupied661 58.0% Renter occupiedHouse owners and renters - Two or more races residents 2,927 59.7% Owner occupied1,978 40.3% Renter occupiedHouse owners and renters - White alone residents 17,973 68.4% Owner occupied8,304 31.6% Renter occupiedHouse owners and renters - Hispanic or Latino residents 2,170 39.9% Owner occupied3,263 60.1% Renter occupied
Language usage in Citrus Heights
English speakers - Total 81.1% of residents of Citrus Heights speak English at home.
9.0% of residents speak Spanish at home 4,390 59.1% Speak English very well3,037 40.9% Speak English less than very well10.3% of residents speak other language at home 4,594 53.6% Speak English very well3,978 46.4% Speak English less than very well
English speakers - Born in the United States 94.9% of residents of Citrus Heights speak English at home.
2.8% of residents speak Spanish at home 309 71.2% Speak English very well125 28.8% Speak English less than very well2.1% of residents speak other language at home 183 54.8% Speak English very well151 45.2% Speak English less than very well
English speakers - Native, born elsewhere 78.8% of residents of Citrus Heights speak English at home.
5.2% of residents speak Spanish at home 49 80.3% Speak English very well12 19.7% Speak English less than very well15.8% of residents speak other language at home 132 71.7% Speak English very well52 28.3% Speak English less than very well
English speakers - Foreign-born 15.1% of residents of Citrus Heights speak English at home.
28.8% of residents speak Spanish at home 1,063 32.1% Speak English very well2,249 67.9% Speak English less than very well57.2% of residents speak other language at home 3,104 47.3% Speak English very well3,464 52.7% Speak English less than very well
White (Caucasian) - Speak only English Native:
99.1% (51,640)Foreign-born:
23.6% (1,248)
White (Caucasian) - Speak another language Native:
5.1% (2,665)Foreign-born:
78.0% (4,124)
Black or African American - Speak only English Native:
95.7% (2,634)Foreign-born:
27.9% (145)
Black or African American - Speak another language Native:
4.5% (124)Foreign-born:
69.7% (362)
American Indian / Alaska Native - Speak another language Native:
14.9% (86)Foreign-born:
100.0% (51)
Asian - Speak only English Native:
76.5% (901)Foreign-born:
20.6% (357)
Asian - Speak another language Native:
24.8% (292)Foreign-born:
80.4% (1,394)
Native Hawaiian / Pacific Islander - Speak only English Native:
69.0% (42)Foreign-born:
42.1% (30)
Native Hawaiian / Pacific Islander - Speak another language Native:
21.3% (13)Foreign-born:
53.1% (37)
Other race - Speak only English Native:
57.4% (1,703)Foreign-born:
5.8% (65)
Other race - Speak another language Native:
46.1% (1,368)Foreign-born:
93.4% (1,044)
Two or more races - Speak only English Native:
69.7% (7,678)Foreign-born:
0.8% (12)
Two or more races - Speak another language Native:
19.2% (2,110)Foreign-born:
100.0% (1,511)
White alone - Speak only English Native:
97.3% (47,568)Foreign-born:
19.5% (1,312)
White alone - Speak another language Native:
2.6% (1,283)Foreign-born:
80.7% (5,423)
Hispanic or Latino - Speak only English Native:
74.1% (10,631)Foreign-born:
9.4% (259)
Hispanic or Latino - Speak another language Native:
28.5% (4,083)Foreign-born:
91.6% (2,522)
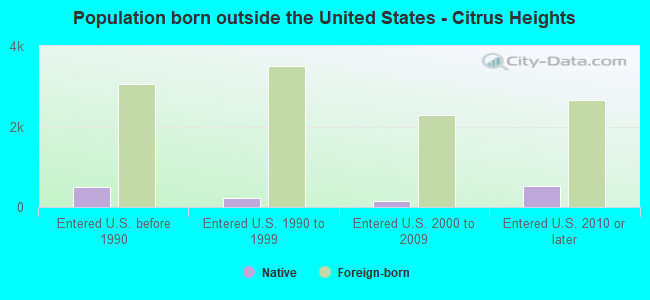
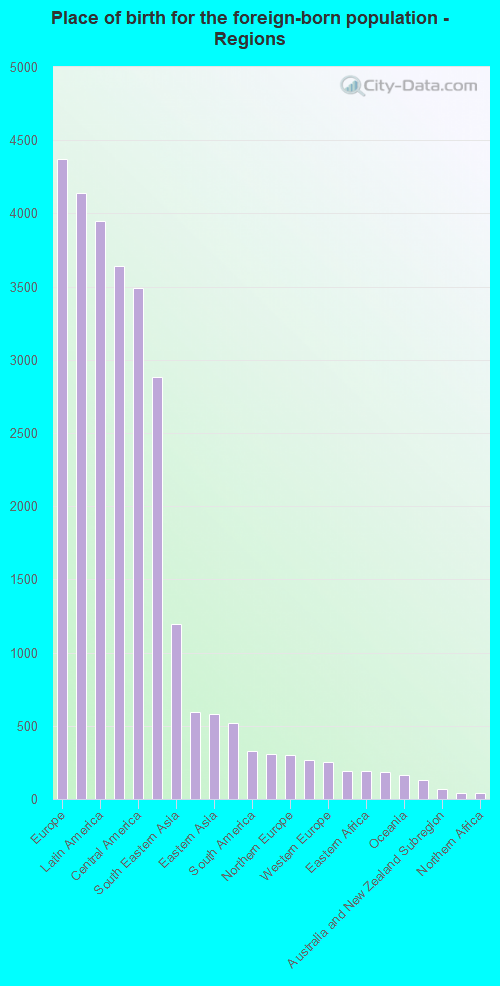
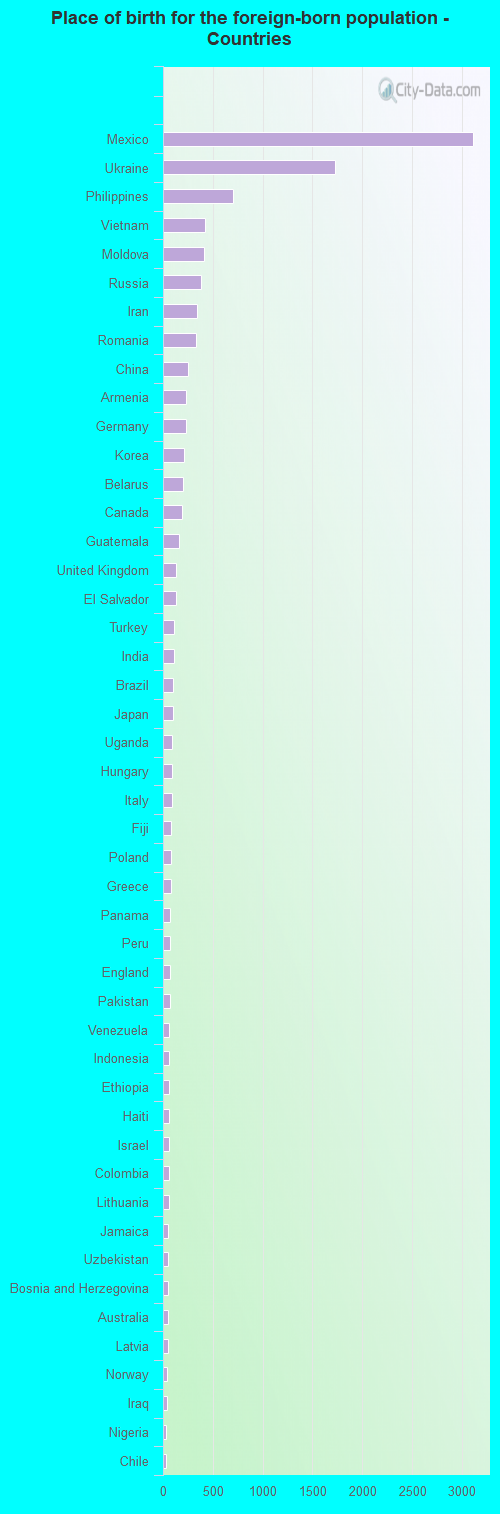
Foreign-born residents in Citrus Heights 11,866 residents are foreign born (4.9% Europe , 4.5% Latin America , 3.3% Asia ).
This city:
13.3%California:
100.0%
Marital status for residents in Citrus Heights Marital status - White (Caucasian) population 15 years and over
Males 35.7% Never married43.9% Now married3.1% Separated2.2% Widowed15.1% DivorcedFemales 23.7% Never married40.1% Now married3.7% Separated13.8% Widowed18.7% DivorcedWomen who gave birth in the past 12 months Now married:
95.9% (633)Unmarried:
4.1% (27)
Women who did not give birth in the past 12 months Now married:
38.0% (4,489)Unmarried:
62.0% (7,337)
Marital status - Black or African American population 15 years and over
Males 68.6% Never married20.2% Now married3.8% Separated0.0% Widowed7.4% DivorcedFemales 45.6% Never married16.7% Now married0.9% Separated10.3% Widowed26.5% DivorcedWomen who did not give birth in the past 12 months Now married:
13.5% (101)Unmarried:
86.5% (652)
Marital status - American Indian / Alaska Native population 15 years and over
Males 33.1% Never married17.9% Now married7.3% Separated0.0% Widowed41.7% DivorcedFemales 22.2% Never married47.9% Now married0.0% Separated18.8% Widowed11.1% DivorcedWomen who did not give birth in the past 12 months Now married:
54.1% (86)Unmarried:
45.9% (73)
Marital status - Asian population 15 years and over
Males 32.1% Never married56.0% Now married1.6% Separated1.0% Widowed9.3% DivorcedFemales 19.8% Never married56.7% Now married1.2% Separated12.0% Widowed10.3% DivorcedWomen who gave birth in the past 12 months Now married:
42.1% (8)Unmarried:
57.9% (12)
Women who did not give birth in the past 12 months Now married:
56.5% (415)Unmarried:
43.5% (320)
Marital status - Native Hawaiian / Pacific Islander population 15 years and over
Males 32.2% Never married67.8% Now married0.0% Separated0.0% Widowed0.0% DivorcedFemales 32.8% Never married57.8% Now married0.0% Separated0.0% Widowed9.4% DivorcedWomen who did not give birth in the past 12 months Now married:
62.2% (22)Unmarried:
37.8% (14)
Marital status - Other race population 15 years and over
Males 49.5% Never married35.0% Now married4.3% Separated0.6% Widowed10.6% DivorcedFemales 40.4% Never married37.3% Now married10.0% Separated5.7% Widowed6.6% DivorcedWomen who gave birth in the past 12 months Now married:
28.9% (18)Unmarried:
71.1% (44)
Women who did not give birth in the past 12 months Now married:
47.8% (617)Unmarried:
52.2% (674)
Marital status - Two or more races population 15 years and over
Males 58.6% Never married41.4% Now married0.0% Separated0.0% Widowed0.0% DivorcedFemales 41.1% Never married19.5% Now married3.9% Separated10.6% Widowed24.9% DivorcedWomen who gave birth in the past 12 months Now married:
100.0% (204)Unmarried:
0.0% (0)
Women who did not give birth in the past 12 months Now married:
28.9% (1,133)Unmarried:
71.1% (2,781)
Marital status - White alone, not Hispanic / Latino population 15 years and over
Males 33.0% Never married46.9% Now married2.4% Separated2.0% Widowed15.7% DivorcedFemales 20.2% Never married42.1% Now married3.2% Separated14.8% Widowed19.6% DivorcedWomen who gave birth in the past 12 months Now married:
95.5% (685)Unmarried:
4.5% (33)
Women who did not give birth in the past 12 months Now married:
42.0% (4,688)Unmarried:
58.0% (6,464)
Marital status - Hispanic or Latino population 15 years and over
Males 49.7% Never married29.4% Now married6.7% Separated3.5% Widowed10.7% DivorcedFemales 42.2% Never married30.5% Now married7.1% Separated7.9% Widowed12.3% DivorcedWomen who gave birth in the past 12 months Now married:
37.8% (99)Unmarried:
62.2% (162)
Women who did not give birth in the past 12 months Now married:
39.8% (1,847)Unmarried:
60.2% (2,792)
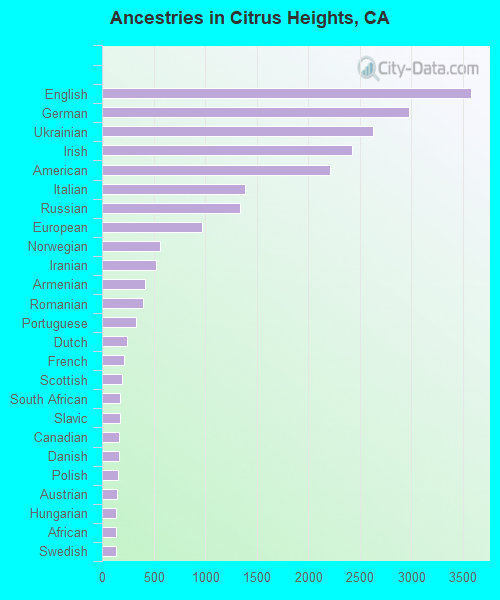
Ancestries in Citrus Heights
2,473 6.1% American2,398 5.9% English2,313 5.7% German2,109 5.2% Ukrainian1,932 4.8% European1,667 4.1% Irish1,038 2.6% Italian714 1.8% Russian648 1.6% Romanian449 1.1% Norwegian381 0.9% Jamaican329 0.8% Armenian328 0.8% Scottish326 0.8% Portuguese299 0.7% Iranian291 0.7% African289 0.7% Polish253 0.6% French237 0.6% Eastern European233 0.6% Scandinavian195 0.5% Swedish167 0.4% Scotch-Irish165 0.4% British141 0.3% Turkish121 0.3% Greek120 0.3% Yugoslavian116 0.3% French Canadian116 0.3% Northern European109 0.3% Dutch105 0.3% Canadian101 0.2% Hungarian95 0.2% Danish94 0.2% Brazilian74 0.2% Lebanese65 0.2% Lithuanian54 0.1% Welsh53 0.1% Croatian50 0.1% Arab50 0.1% Ugandan45 0.1% Serbian44 0.1% Slavic43 0.1% Czech40 0.10% Iraqi33 0.08% Australian32 0.08% Swiss31 0.08% Nigerian30 0.07% Belizean29 0.07% Israeli26 0.06% Soviet Union19 0.05% Egyptian17 0.04% Icelander17 0.04% Trinidadian and Tobagonian13 0.03% Maltese13 0.03% Czechoslovakian10 0.02% New Zealander9 0.02% Finnish8 0.02% Latvian8 0.02% Pennsylvania German7 0.02% Macedonian6 0.01% Austrian5 0.01% Afghan
Geographical mobility in Citrus Heights Same house 1 year ago 50,440 87.4% White (Caucasian)2,386 72.8% Black or African American471 65.5% American Indian / Alaska Native2,786 83.8% Asian125 100.0% Native Hawaiian / Pacific Islander3,004 75.3% Other race10,778 83.6% Two or more races49,173 86.5% White alone, not Hispanic / Latino14,011 83.7% Hispanic or LatinoMoved within same county 3,880 6.7% White / Caucasian427 13.0% Black or African American214 29.8% American Indian / Alaska Native246 7.4% Asian557 13.9% Other race1,201 9.3% Two or more races4,694 8.3% White alone, not Hispanic / Latino1,267 7.6% Hispanic or LatinoMoved within same state 3,020 5.2% White / Caucasian520 15.9% Black or African American34 4.7% American Indian / Alaska Native132 4.0% Asian309 7.7% Other race553 4.3% Two or more races2,173 3.8% White alone, not Hispanic / Latino1,103 6.6% Hispanic or LatinoMoved from different state 387 0.7% White / Caucasian20 0.6% Black or African American6 0.2% Asian31 0.8% Other race112 0.9% Two or more races607 1.1% White alone, not Hispanic / Latino262 1.6% Hispanic or LatinoMoved from abroad 101 0.2% White11 1.6% American Indian / Alaska Native118 3.5% Asian43 1.1% Other race171 0.3% White alone, not Hispanic / Latino41 0.2% Hispanic or Latino
Children Nativity (place of birth) in Citrus Heights
Children under 6 years - Living with two parents Both parents native 2,770 100.0% NativeBoth parents foreign-born 738 88.7% Native94 11.3% Foreign-bornOne native, one foreign-born parent 230 100.0% NativeChildren under 6 years - Living with one parent Native parent 1,425 100.0% NativeForeign-born parent 199 73.9% Native70 26.1% Foreign-bornChildren 6 to 17 years - Living with two parents Both parents native 4,389 100.0% Native1 0.0% Foreign-bornBoth parents foreign-born 1,588 78.2% Native443 21.8% Foreign-bornOne native, one foreign-born parent 445 98.0% Native9 2.0% Foreign-bornChildren 6 to 17 years - Living with one parent Native parent 3,536 100.0% NativeForeign-born parent 592 56.3% Native459 43.7% Foreign-born
Grandparents responsible for own grandchildren in Citrus Heights
Grandparents (30 to 59 years) White / Caucasian 66 27.5% Responsible for grandchildren173 72.5% Not responsible for grandchildrenBlack or African American 11 100.0% Not responsible for grandchildrenAsian 9 100.0% Not responsible for grandchildrenOther race 16 100.0% Responsible for grandchildrenTwo or more races 122 100.0% Not responsible for grandchildrenWhite alone, not Hispanic / Latino 78 31.9% Responsible for grandchildren167 68.1% Not responsible for grandchildrenHispanic or Latino 13 12.3% Responsible for grandchildren90 87.7% Not responsible for grandchildrenGrandparents (60 years and over) White / Caucasian 115 17.7% Responsible for grandchildren534 82.3% Not responsible for grandchildrenBlack or African American 4 100.0% Not responsible for grandchildrenAsian 13 12.1% Responsible for grandchildren94 87.9% Not responsible for grandchildrenOther race 32 100.0% Not responsible for grandchildrenTwo or more races 82 66.7% Responsible for grandchildren41 33.3% Not responsible for grandchildrenWhite alone, not Hispanic / Latino 130 16.7% Responsible for grandchildren647 83.3% Not responsible for grandchildrenHispanic or Latino 13 7.9% Responsible for grandchildren150 92.1% Not responsible for grandchildren