Races in Eastpointe, Michigan (MI) Detailed Stats
Data:
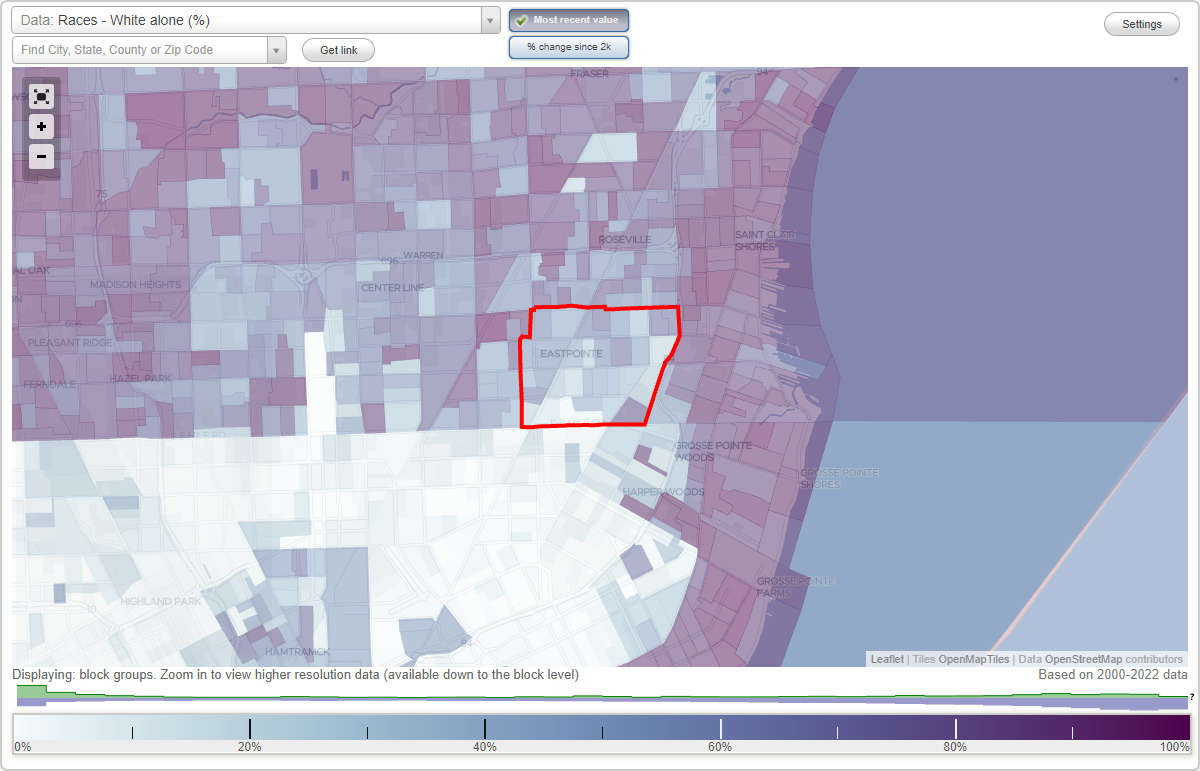
Races - White alone (%)
Races - White alone (% change since 2000)
Races - Black alone (%)
Races - Black alone (% change since 2000)
Races - American Indian alone (%)
Races - American Indian alone (% change since 2000)
Races - Asian alone (%)
Races - Asian alone (% change since 2000)
Races - Hispanic (%)
Races - Hispanic (% change since 2000)
Races - Native Hawaiian and Other Pacific Islander alone (%)
Races - Native Hawaiian and Other Pacific Islander alone (% change since 2000)
Races - Two or more races(%)
Races - Two or more races(% change since 2000)
Races - Other race alone (%)
Races - Other race alone (% change since 2000)
Racial diversity
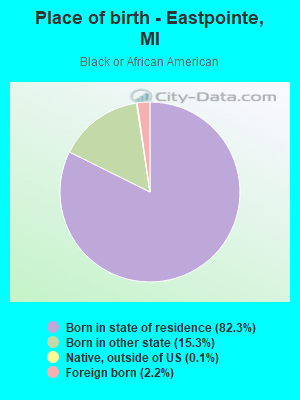
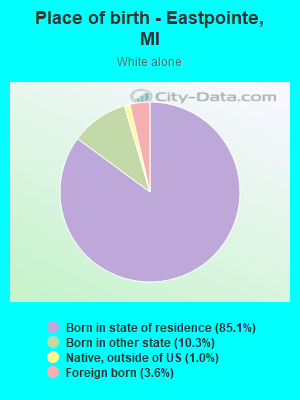
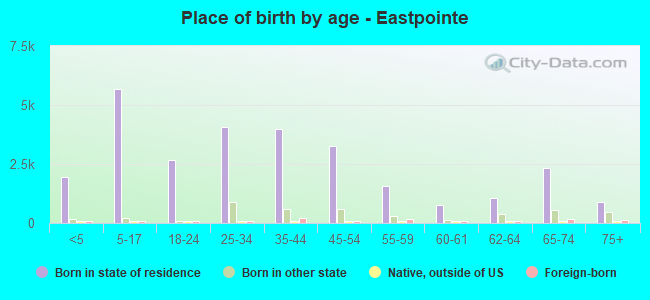
Place of birth - Born in state of residence (%)
Place of birth - Born in state of residence (%) - White
Place of birth - Born in state of residence (%) - Black or African American
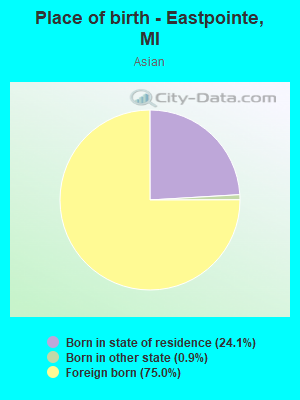
Place of birth - Born in state of residence (%) - Asian
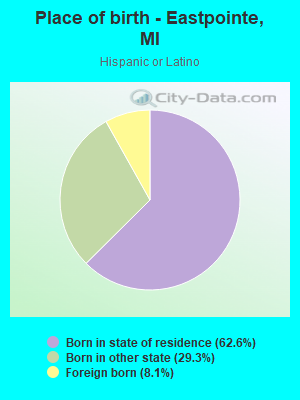
Place of birth - Born in state of residence (%) - Hispanic or Latino
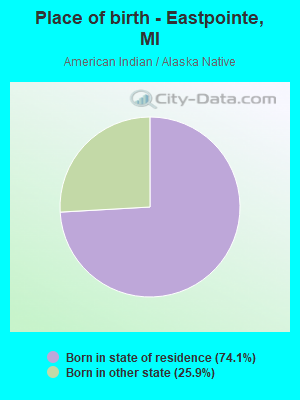
Place of birth - Born in state of residence (%) - American Indian and Alaska Native
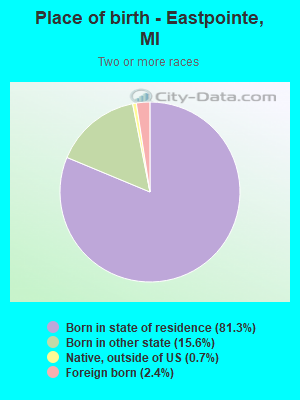
Place of birth - Born in state of residence (%) - Multirace
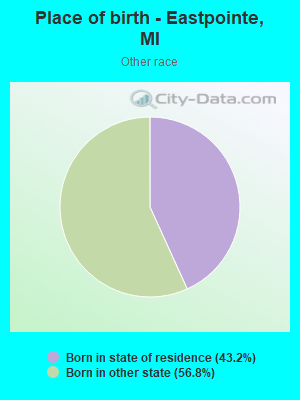
Place of birth - Born in state of residence (%) - Other Race
Place of birth - Born in other state (%)
Place of birth - Born in other state (%) - White
Place of birth - Born in other state (%) - Black or African American
Place of birth - Born in other state (%) - Asian
Place of birth - Born in other state (%) - Hispanic or Latino
Place of birth - Born in other state (%) - American Indian and Alaska Native
Place of birth - Born in other state (%) - Multirace
Place of birth - Born in other state (%) - Other Race
Place of birth - Native, outside of US (%)
Place of birth - Native, outside of US (%) - White
Place of birth - Native, outside of US (%) - Black or African American
Place of birth - Native, outside of US (%) - Asian
Place of birth - Native, outside of US (%) - Hispanic or Latino
Place of birth - Native, outside of US (%) - American Indian and Alaska Native
Place of birth - Native, outside of US (%) - Multirace
Place of birth - Native, outside of US (%) - Other Race
Place of birth - Foreign born (%)
Place of birth - Foreign born (%) - White
Place of birth - Foreign born (%) - Black or African American
Place of birth - Foreign born (%) - Asian
Place of birth - Foreign born (%) - Hispanic or Latino
Place of birth - Foreign born (%) - American Indian and Alaska Native
Place of birth - Foreign born (%) - Multirace
Place of birth - Foreign born (%) - Other Race
Residents speaking English at home (%)
Residents speaking English at home - Born in the United States (%)
Residents speaking English at home - Native, born elsewhere (%)
Residents speaking English at home - Foreign born (%)
Residents speaking Spanish at home (%)
Residents speaking Spanish at home - Born in the United States (%)
Residents speaking Spanish at home - Native, born elsewhere (%)
Residents speaking Spanish at home - Foreign born (%)
Residents speaking other language at home (%)
Residents speaking other language at home - Born in the United States (%)
Residents speaking other language at home - Native, born elsewhere (%)
Residents speaking other language at home - Foreign born (%)
Marital status - Never married (%)
Marital status - Now married (%)
Marital status - Separated (%)
Marital status - Widowed (%)
Marital status - Divorced (%)
Ancestries Reported - Arab (%)
Ancestries Reported - Czech (%)
Ancestries Reported - Danish (%)
Ancestries Reported - Dutch (%)
Ancestries Reported - English (%)
Ancestries Reported - French (%)
Ancestries Reported - French Canadian (%)
Ancestries Reported - German (%)
Ancestries Reported - Greek (%)
Ancestries Reported - Hungarian (%)
Ancestries Reported - Irish (%)
Ancestries Reported - Italian (%)
Ancestries Reported - Lithuanian (%)
Ancestries Reported - Norwegian (%)
Ancestries Reported - Polish (%)
Ancestries Reported - Portuguese (%)
Ancestries Reported - Russian (%)
Ancestries Reported - Scotch-Irish (%)
Ancestries Reported - Scottish (%)
Ancestries Reported - Slovak (%)
Ancestries Reported - Subsaharan African (%)
Ancestries Reported - Swedish (%)
Ancestries Reported - Swiss (%)
Ancestries Reported - Ukrainian (%)
Ancestries Reported - United States (%)
Ancestries Reported - Welsh (%)
Ancestries Reported - West Indian (%)
Ancestries Reported - Other (%)
Geographical mobility - Same house 1 year ago (%)
Geographical mobility - Same house 1 year ago (%) - White
Geographical mobility - Same house 1 year ago (%) - Black or African American
Geographical mobility - Same house 1 year ago (%) - Asian
Geographical mobility - Same house 1 year ago (%) - Hispanic or Latino
Geographical mobility - Same house 1 year ago (%) - American Indian and Alaska Native
Geographical mobility - Same house 1 year ago (%) - Multirace
Geographical mobility - Same house 1 year ago (%) - Other Race
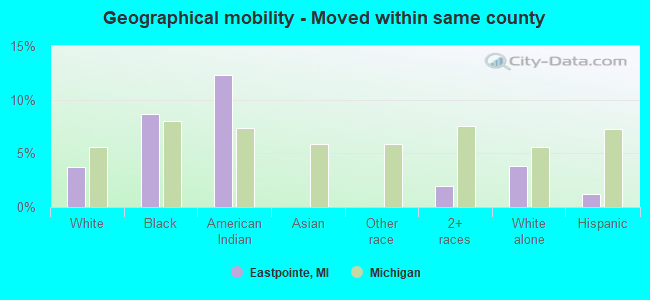
Geographical mobility - Moved within same county (%)
Geographical mobility - Moved within same county (%) - White
Geographical mobility - Moved within same county (%) - Black or African American
Geographical mobility - Moved within same county (%) - Asian
Geographical mobility - Moved within same county (%) - Hispanic or Latino
Geographical mobility - Moved within same county (%) - American Indian and Alaska Native
Geographical mobility - Moved within same county (%) - Multirace
Geographical mobility - Moved within same county (%) - Other Race
Geographical mobility - Moved from different county within same state (%)
Geographical mobility - Moved from different county within same state (%) - White
Geographical mobility - Moved from different county within same state (%) - Black or African American
Geographical mobility - Moved from different county within same state (%) - Asian
Geographical mobility - Moved from different county within same state (%) - Hispanic or Latino
Geographical mobility - Moved from different county within same state (%) - American Indian and Alaska Native
Geographical mobility - Moved from different county within same state (%) - Multirace
Geographical mobility - Moved from different county within same state (%) - Other Race
Geographical mobility - Moved from different state (%)
Geographical mobility - Moved from different state (%) - White
Geographical mobility - Moved from different state (%) - Black or African American
Geographical mobility - Moved from different state (%) - Asian
Geographical mobility - Moved from different state (%) - Hispanic or Latino
Geographical mobility - Moved from different state (%) - American Indian and Alaska Native
Geographical mobility - Moved from different state (%) - Multirace
Geographical mobility - Moved from different state (%) - Other Race
Geographical mobility - Moved from abroad (%)
Geographical mobility - Moved from abroad (%) - White
Geographical mobility - Moved from abroad (%) - Black or African American
Geographical mobility - Moved from abroad (%) - Asian
Geographical mobility - Moved from abroad (%) - Hispanic or Latino
Geographical mobility - Moved from abroad (%) - American Indian and Alaska Native
Geographical mobility - Moved from abroad (%) - Multirace
Geographical mobility - Moved from abroad (%) - Other Race
Place of birth for the foreign-born population - Ireland (%)
Place of birth for the foreign-born population - Denmark (%)
Place of birth for the foreign-born population - Norway (%)
Place of birth for the foreign-born population - Sweden (%)
Place of birth for the foreign-born population - United Kingdom (%)
Place of birth for the foreign-born population - England (%)
Place of birth for the foreign-born population - Scotland (%)
Place of birth for the foreign-born population - Other Northern Europe (%)
Place of birth for the foreign-born population - Austria (%)
Place of birth for the foreign-born population - Belgium (%)
Place of birth for the foreign-born population - France (%)
Place of birth for the foreign-born population - Germany (%)
Place of birth for the foreign-born population - Netherlands (%)
Place of birth for the foreign-born population - Switzerland (%)
Place of birth for the foreign-born population - Other Western Europe (%)
Place of birth for the foreign-born population - Greece (%)
Place of birth for the foreign-born population - Italy (%)
Place of birth for the foreign-born population - Portugal (%)
Place of birth for the foreign-born population - Spain (%)
Place of birth for the foreign-born population - Other Southern Europe (%)
Place of birth for the foreign-born population - Albania (%)
Place of birth for the foreign-born population - Belarus (%)
Place of birth for the foreign-born population - Bosnia and Herzegovina (%)
Place of birth for the foreign-born population - Bulgaria (%)
Place of birth for the foreign-born population - Croatia (%)
Place of birth for the foreign-born population - Czechoslovakia (%)
Place of birth for the foreign-born population - Hungary (%)
Place of birth for the foreign-born population - Latvia (%)
Place of birth for the foreign-born population - Lithuania (%)
Place of birth for the foreign-born population - North Macedonia (Macedonia) (%)
Place of birth for the foreign-born population - Moldova (%)
Place of birth for the foreign-born population - Poland (%)
Place of birth for the foreign-born population - Romania (%)
Place of birth for the foreign-born population - Russia (%)
Place of birth for the foreign-born population - Serbia (%)
Place of birth for the foreign-born population - Ukraine (%)
Place of birth for the foreign-born population - Other Eastern Europe (%)
Place of birth for the foreign-born population - China (%)
Place of birth for the foreign-born population - Hong Kong (%)
Place of birth for the foreign-born population - Taiwan (%)
Place of birth for the foreign-born population - Japan (%)
Place of birth for the foreign-born population - Korea (%)
Place of birth for the foreign-born population - Other Eastern Asia (%)
Place of birth for the foreign-born population - Afghanistan (%)
Place of birth for the foreign-born population - Bangladesh (%)
Place of birth for the foreign-born population - India (%)
Place of birth for the foreign-born population - Iran (%)
Place of birth for the foreign-born population - Kazakhstan (%)
Place of birth for the foreign-born population - Nepal (%)
Place of birth for the foreign-born population - Pakistan (%)
Place of birth for the foreign-born population - Sri Lanka (%)
Place of birth for the foreign-born population - Uzbekistan (%)
Place of birth for the foreign-born population - Other South Central Asia (%)
Place of birth for the foreign-born population - Burma (%)
Place of birth for the foreign-born population - Cambodia (%)
Place of birth for the foreign-born population - Indonesia (%)
Place of birth for the foreign-born population - Laos (%)
Place of birth for the foreign-born population - Malaysia (%)
Place of birth for the foreign-born population - Philippines (%)
Place of birth for the foreign-born population - Singapore (%)
Place of birth for the foreign-born population - Thailand (%)
Place of birth for the foreign-born population - Vietnam (%)
Place of birth for the foreign-born population - Other South Eastern Asia (%)
Place of birth for the foreign-born population - Armenia (%)
Place of birth for the foreign-born population - Iraq (%)
Place of birth for the foreign-born population - Israel (%)
Place of birth for the foreign-born population - Jordan (%)
Place of birth for the foreign-born population - Kuwait (%)
Place of birth for the foreign-born population - Lebanon (%)
Place of birth for the foreign-born population - Saudi Arabia (%)
Place of birth for the foreign-born population - Syria (%)
Place of birth for the foreign-born population - Turkey (%)
Place of birth for the foreign-born population - Yemen (%)
Place of birth for the foreign-born population - Other Western Asia (%)
Place of birth for the foreign-born population - Eritrea (%)
Place of birth for the foreign-born population - Ethiopia (%)
Place of birth for the foreign-born population - Kenya (%)
Place of birth for the foreign-born population - Somalia (%)
Place of birth for the foreign-born population - Uganda (%)
Place of birth for the foreign-born population - Zimbabwe (%)
Place of birth for the foreign-born population - Other Eastern Africa (%)
Place of birth for the foreign-born population - Cameroon (%)
Place of birth for the foreign-born population - Congo (%)
Place of birth for the foreign-born population - Democratic Republic of Congo (Zaire) (%)
Place of birth for the foreign-born population - Other Middle Africa (%)
Place of birth for the foreign-born population - Egypt (%)
Place of birth for the foreign-born population - Morocco (%)
Place of birth for the foreign-born population - Sudan (%)
Place of birth for the foreign-born population - Other Northern Africa (%)
Place of birth for the foreign-born population - South Africa (%)
Place of birth for the foreign-born population - Other Southern Africa (%)
Place of birth for the foreign-born population - Cabo Verde (%)
Place of birth for the foreign-born population - Ghana (%)
Place of birth for the foreign-born population - Liberia (%)
Place of birth for the foreign-born population - Nigeria (%)
Place of birth for the foreign-born population - Senegal (%)
Place of birth for the foreign-born population - Sierra Leone (%)
Place of birth for the foreign-born population - Other Western Africa (%)
Place of birth for the foreign-born population - Australia (%)
Place of birth for the foreign-born population - New Zealand (%)
Place of birth for the foreign-born population - Fiji (%)
Place of birth for the foreign-born population - Micronesia (%)
Place of birth for the foreign-born population - Bahamas (%)
Place of birth for the foreign-born population - Barbados (%)
Place of birth for the foreign-born population - Cuba (%)
Place of birth for the foreign-born population - Dominica (%)
Place of birth for the foreign-born population - Dominican Republic (%)
Place of birth for the foreign-born population - Grenada (%)
Place of birth for the foreign-born population - Haiti (%)
Place of birth for the foreign-born population - Jamaica (%)
Place of birth for the foreign-born population - St. Vincent and the Grenadines (%)
Place of birth for the foreign-born population - Trinidad and Tobago (%)
Place of birth for the foreign-born population - West Indies (%)
Place of birth for the foreign-born population - Other Caribbean (%)
Place of birth for the foreign-born population - Belize (%)
Place of birth for the foreign-born population - Costa Rica (%)
Place of birth for the foreign-born population - El Salvador (%)
Place of birth for the foreign-born population - Guatemala (%)
Place of birth for the foreign-born population - Honduras (%)
Place of birth for the foreign-born population - Mexico (%)
Place of birth for the foreign-born population - Nicaragua (%)
Place of birth for the foreign-born population - Panama (%)
Place of birth for the foreign-born population - Other Central America (%)
Place of birth for the foreign-born population - Argentina (%)
Place of birth for the foreign-born population - Bolivia (%)
Place of birth for the foreign-born population - Brazil (%)
Place of birth for the foreign-born population - Chile (%)
Place of birth for the foreign-born population - Colombia (%)
Place of birth for the foreign-born population - Ecuador (%)
Place of birth for the foreign-born population - Guyana (%)
Place of birth for the foreign-born population - Peru (%)
Place of birth for the foreign-born population - Uruguay (%)
Place of birth for the foreign-born population - Venezuela (%)
Place of birth for the foreign-born population - Other South America (%)
Place of birth for the foreign-born population - Canada (%)
Place of birth for the foreign-born population - Other Northern America (%)
Place of birth for the foreign-born population - Other (%)
Latest news about races in Eastpointe, MI collected exclusively by city-data.com from local newspapers, TV, and radio stations
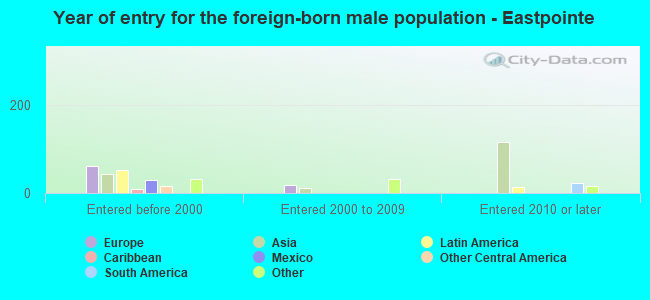
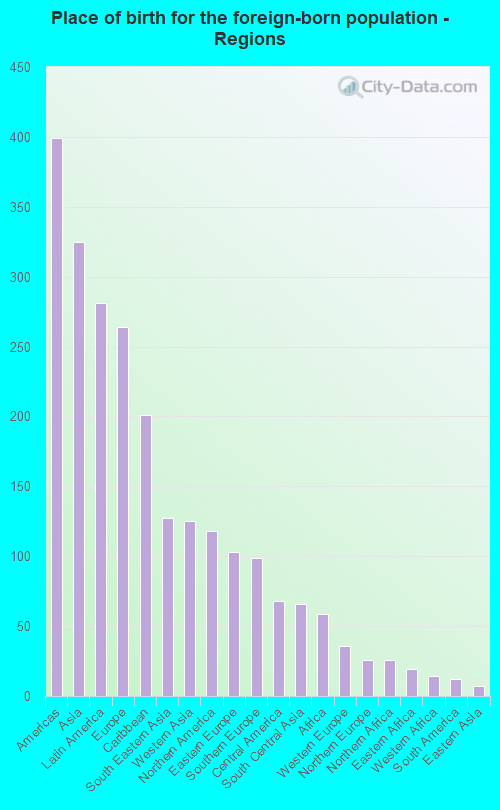
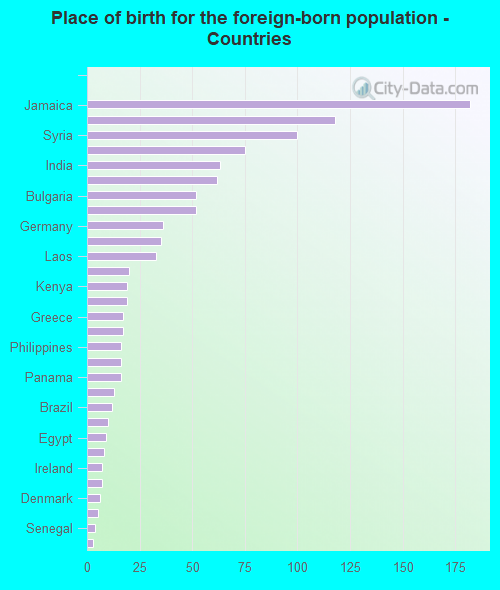
According to 2022 data, the most numerous races in Eastpointe, MI are White alone (12,979 residents), Black alone (18,269 residents), and Hispanic (615 residents). 97.4% of Eastpointe residents speak English at home. 3.1% of Eastpointe, MI residents are foreign-born (1.0% born in Asia, 0.8% born in Latin America, 0.8% born in Europe, 0.3% born in North America), which is 94.4% less than the foreign-born rate of 6.0% across the entire state of Michigan.
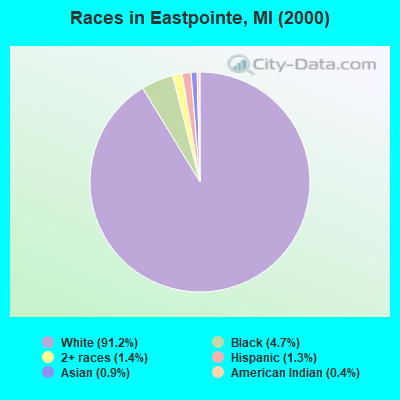
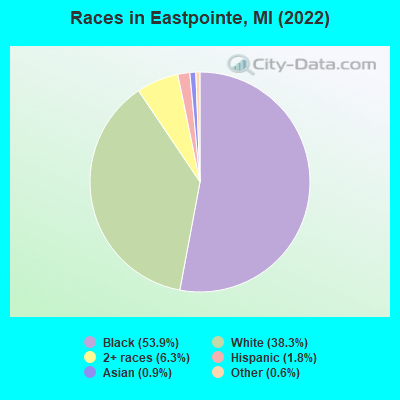
Race distribution in Eastpointe
2000 2022
7,806,691 78.6% White alone 1,402,047 14.1% Black alone 323,877 3.3% Hispanic 175,311 1.8% Asian alone 163,487 1.6% Two or more races 53,421 0.5% American Indian alone 11,465 0.1% Other race alone 2,145 0.02% Native Hawaiian and Other
7,289,051 72.6% White alone 1,310,464 13.1% Black alone 572,405 5.7% Hispanic 450,031 4.5% Two or more races 335,732 3.3% Asian alone 45,217 0.5% Other race alone 29,011 0.3% American Indian alone 2,207 0.02% Native Hawaiian and Other
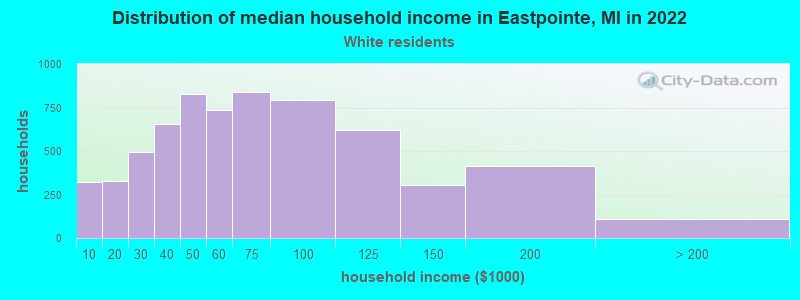
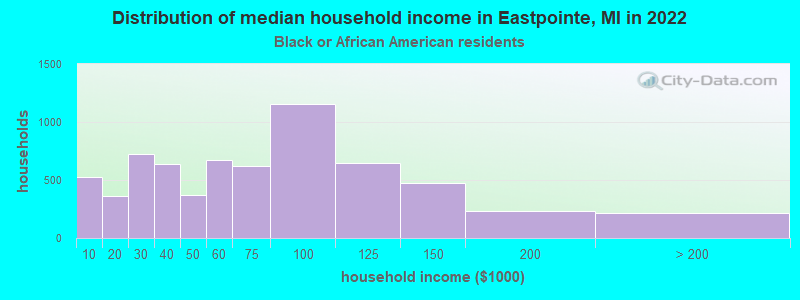
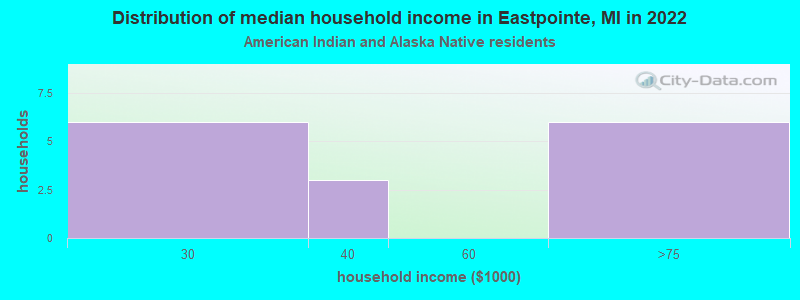
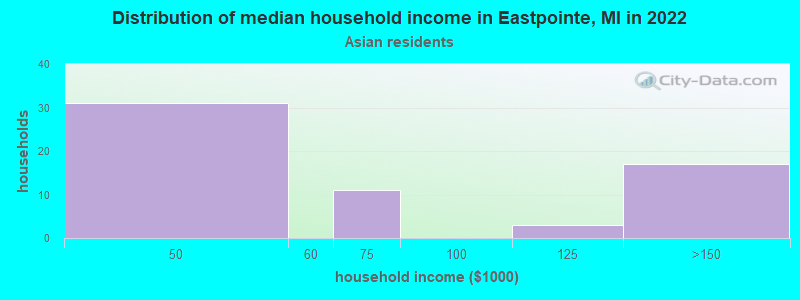
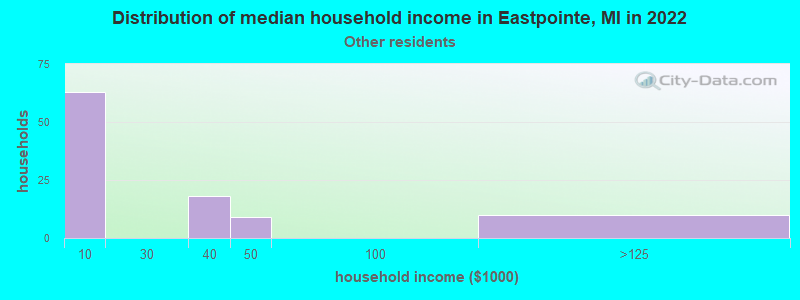
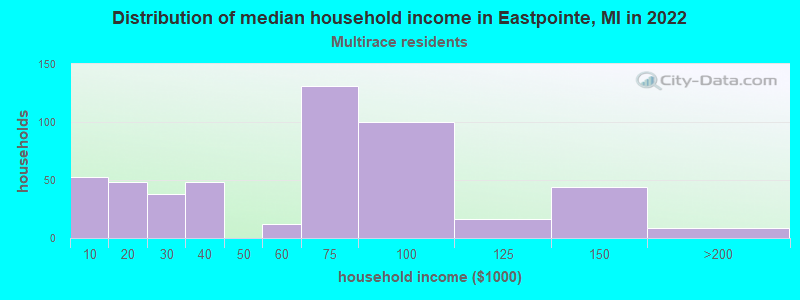
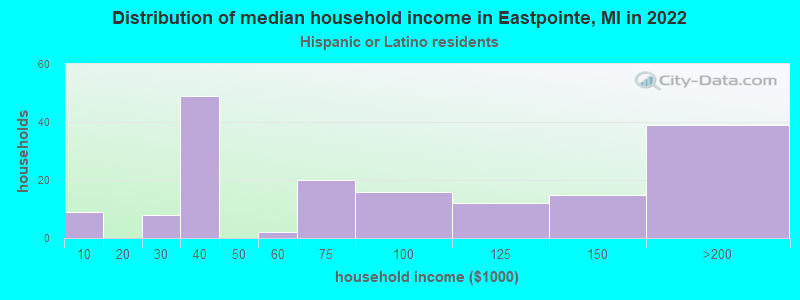
Income and house value in Eastpointe Median household income in 2022 $57,166 White non-Hispanic householders$61,922 Black householders$64,133 Two or more races householders$68,651 Hispanic or Latino race householdersMedian 2022 house value $127,198 White Non-Hispanic householders$164,886 Black or African American householders$133,610 American Indian or Alaska Native householders $153,501 Asian householders$130,077 Some other race householders$159,521 Two or more races householders$147,220 Hispanic or Latino householders
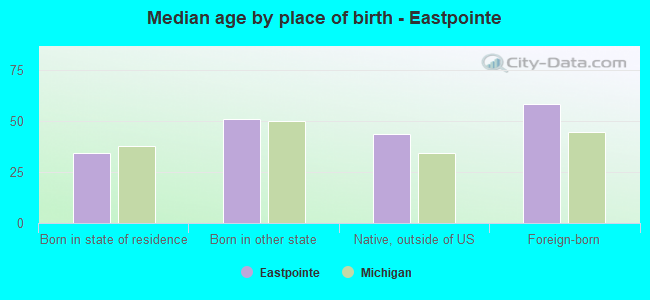
Median age by race in Eastpointe
48.0 Median age for White residents45.8 51.3 32.0 Median age for Black or African American residents28.4 37.9 29.8 Median age for American Indian / Alaska Native residents19.5 71.5 40.2 Median age for Asian residents19.1 41.7 -670,531,400.3 Median age for Native Hawaiian / Pacific Islander residents-674,772,035.8 -699,588,476.7 35.5 Median age for Other race residents17.0 38.3 22.0 Median age for Two or more races residents25.7 20.2 48.4 Median age for White alone residents46.4 51.7 32.5 Median age for Hispanic or Latino residents27.2 43.4
Owner/renter occupied households by race in Eastpointe
House owners and renters - White residents 5,158 80.4% Owner occupied1,255 19.6% Renter occupiedHouse owners and renters - Black or African American residents 4,036 60.4% Owner occupied2,647 39.6% Renter occupiedHouse owners and renters - American Indian / Alaska Native residents 9 56.3% Owner occupied7 43.7% Renter occupiedHouse owners and renters - Asian residents 54 94.4% Owner occupied3 5.6% Renter occupiedHouse owners and renters - Other race residents 79 70.3% Owner occupied33 29.7% Renter occupiedHouse owners and renters - Two or more races residents 281 56.1% Owner occupied221 43.9% Renter occupiedHouse owners and renters - White alone residents 5,093 80.4% Owner occupied1,239 19.6% Renter occupiedHouse owners and renters - Hispanic or Latino residents 120 73.3% Owner occupied44 26.7% Renter occupied
Language usage in Eastpointe
English speakers - Total 97.4% of residents of Eastpointe speak English at home.
0.5% of residents speak Spanish at home 57 39.0% Speak English very well89 61.0% Speak English less than very well1.9% of residents speak other language at home 312 53.0% Speak English very well277 47.0% Speak English less than very well
English speakers - Born in the United States 97.8% of residents of Eastpointe speak English at home.
0.7% of residents speak Spanish at home 29 100.0% Speak English very well0.7% of residents speak other language at home 21 70.0% Speak English very well9 30.0% Speak English less than very well
English speakers - Native, born elsewhere 98.0% of residents of Eastpointe speak English at home.
5.6% of residents speak other language at home 11 100.0% Speak English very well
English speakers - Foreign-born 52.6% of residents of Eastpointe speak English at home.
4.2% of residents speak Spanish at home 5 11.6% Speak English very well38 88.4% Speak English less than very well40.9% of residents speak other language at home 172 40.9% Speak English very well249 59.1% Speak English less than very well
White (Caucasian) - Speak only English Native:
98.9% (12,297)Foreign-born:
49.5% (246)
White (Caucasian) - Speak another language Native:
1.0% (130)Foreign-born:
49.1% (244)
Black or African American - Speak only English Native:
100.0% (16,343)Foreign-born:
84.5% (345)
Black or African American - Speak another language Native:
0.2% (35)Foreign-born:
14.7% (60)
Asian - Speak only English Native:
31.2% (23)Foreign-born:
24.5% (54)
Asian - Speak another language Native:
70.4% (52)Foreign-born:
75.1% (166)
Two or more races - Speak only English Native:
99.1% (1,884)Foreign-born:
45.8% (26)
White alone - Speak only English Native:
98.8% (12,064)Foreign-born:
53.4% (249)
White alone - Speak another language Native:
1.0% (117)Foreign-born:
44.6% (208)
Hispanic or Latino - Speak only English Native:
89.3% (468)Foreign-born:
20.0% (10)
Hispanic or Latino - Speak another language Native:
13.2% (69)Foreign-born:
78.6% (41)
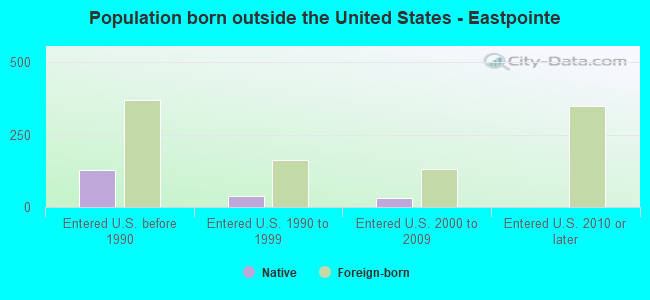
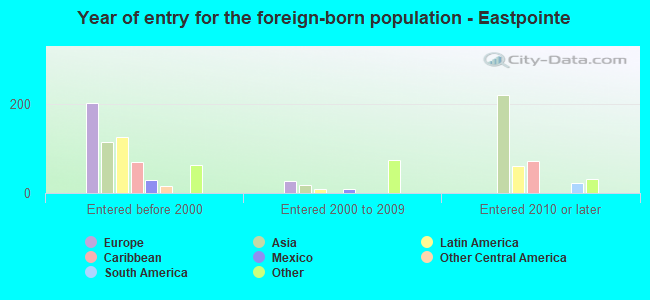
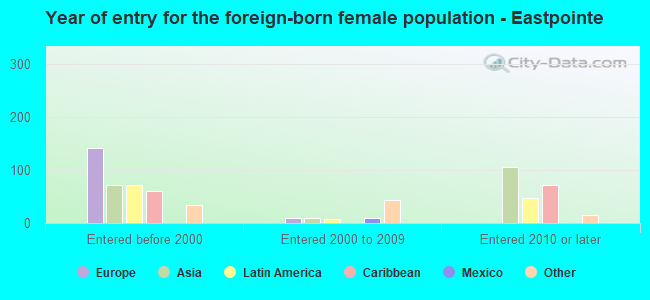
Foreign-born residents in Eastpointe 1,047 residents are foreign born (1.0% Asia , 0.8% Latin America , 0.8% Europe , 0.3% North America ).
This city:
3.1%Michigan:
6.9%
Marital status for residents in Eastpointe Marital status - White (Caucasian) population 15 years and over
Males 44.7% Never married37.1% Now married0.8% Separated3.6% Widowed13.9% DivorcedFemales 34.5% Never married37.9% Now married1.3% Separated12.0% Widowed14.4% DivorcedWomen who gave birth in the past 12 months Now married:
72.7% (96)Unmarried:
27.3% (36)
Women who did not give birth in the past 12 months Now married:
35.3% (821)Unmarried:
64.7% (1,507)
Marital status - Black or African American population 15 years and over
Males 56.9% Never married34.4% Now married2.1% Separated1.1% Widowed5.5% DivorcedFemales 54.0% Never married27.8% Now married1.3% Separated4.1% Widowed12.8% DivorcedWomen who gave birth in the past 12 months Now married:
28.5% (55)Unmarried:
71.5% (139)
Women who did not give birth in the past 12 months Now married:
25.3% (1,135)Unmarried:
74.7% (3,347)
Marital status - American Indian / Alaska Native population 15 years and over
Males 83.3% Never married16.7% Now married0.0% Separated0.0% Widowed0.0% DivorcedFemales 37.9% Never married62.1% Now married0.0% Separated0.0% Widowed0.0% DivorcedWomen who did not give birth in the past 12 months Now married:
0.0% (0)Unmarried:
100.0% (11)
Marital status - Asian population 15 years and over
Males 66.7% Never married33.3% Now married0.0% Separated0.0% Widowed0.0% DivorcedFemales 21.5% Never married22.2% Now married0.0% Separated14.6% Widowed41.7% DivorcedWomen who gave birth in the past 12 months Now married:
100.0% (1)Unmarried:
0.0% (0)
Women who did not give birth in the past 12 months Now married:
32.4% (27)Unmarried:
67.6% (55)
Marital status - Other race population 15 years and over
Males 70.3% Never married10.9% Now married0.0% Separated18.8% Widowed0.0% DivorcedFemales 0.0% Never married54.0% Now married30.2% Separated0.0% Widowed15.9% DivorcedWomen who did not give birth in the past 12 months Now married:
97.9% (55)Unmarried:
2.1% (1)
Marital status - Two or more races population 15 years and over
Males 49.6% Never married38.2% Now married2.1% Separated5.0% Widowed5.0% DivorcedFemales 70.6% Never married15.1% Now married0.0% Separated11.0% Widowed3.4% DivorcedWomen who gave birth in the past 12 months Now married:
81.8% (46)Unmarried:
18.2% (10)
Women who did not give birth in the past 12 months Now married:
6.7% (37)Unmarried:
93.3% (517)
Marital status - White alone, not Hispanic / Latino population 15 years and over
Males 44.5% Never married37.0% Now married0.8% Separated3.6% Widowed14.2% DivorcedFemales 34.8% Never married37.4% Now married1.3% Separated11.9% Widowed14.6% DivorcedWomen who gave birth in the past 12 months Now married:
71.0% (89)Unmarried:
29.0% (36)
Women who did not give birth in the past 12 months Now married:
34.1% (780)Unmarried:
65.9% (1,510)
Marital status - Hispanic or Latino population 15 years and over
Males 49.8% Never married36.7% Now married0.0% Separated2.4% Widowed11.0% DivorcedFemales 28.7% Never married49.7% Now married11.4% Separated9.6% Widowed0.6% DivorcedWomen who gave birth in the past 12 months Now married:
50.0% (9)Unmarried:
50.0% (9)
Women who did not give birth in the past 12 months Now married:
67.4% (69)Unmarried:
32.6% (33)
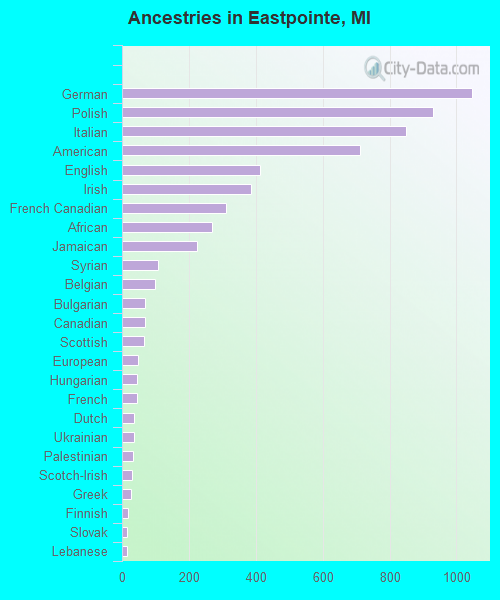
Ancestries in Eastpointe
1,045 5.3% German930 4.7% Polish849 4.3% Italian713 3.6% American413 2.1% English387 2.0% Irish311 1.6% French Canadian270 1.4% African225 1.1% Jamaican107 0.5% Syrian98 0.5% Belgian69 0.3% Bulgarian68 0.3% Canadian65 0.3% Scottish48 0.2% European46 0.2% Hungarian46 0.2% French37 0.2% Dutch37 0.2% Ukrainian34 0.2% Palestinian30 0.2% Scotch-Irish27 0.1% Greek18 0.09% Finnish16 0.08% Slovak15 0.08% Lebanese15 0.08% Portuguese14 0.07% Iraqi13 0.07% Welsh12 0.06% Norwegian10 0.05% Serbian10 0.05% Swedish8 0.04% Northern European7 0.04% Arab6 0.03% Egyptian6 0.03% Danish6 0.03% Slovene5 0.03% Lithuanian5 0.03% Eastern European
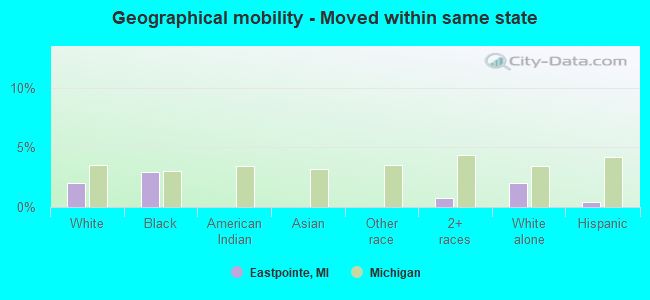
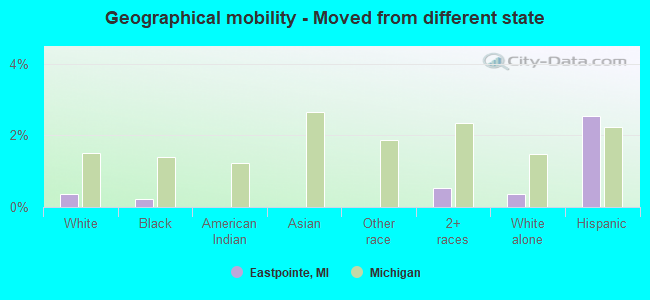
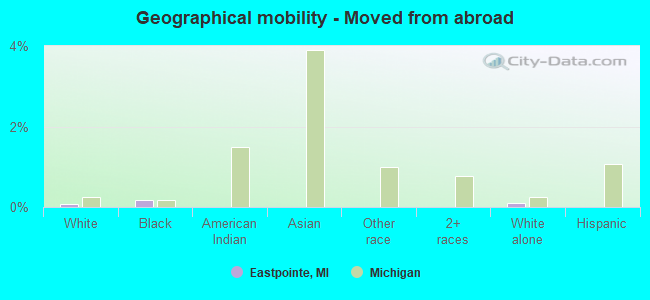
Geographical mobility in Eastpointe Same house 1 year ago 12,333 93.9% White (Caucasian)15,874 88.1% Black or African American42 87.2% American Indian / Alaska Native288 99.5% Asian200 100.0% Other race2,139 95.2% Two or more races12,076 93.8% White alone, not Hispanic / Latino617 100.0% Hispanic or LatinoMoved within same county 486 3.7% White / Caucasian1,554 8.6% Black or African American6 12.3% American Indian / Alaska Native45 2.0% Two or more races489 3.8% White alone, not Hispanic / Latino7 1.2% Hispanic or LatinoMoved within same state 265 2.0% White / Caucasian528 2.9% Black or African American17 0.8% Two or more races261 2.0% White alone, not Hispanic / Latino3 0.5% Hispanic or LatinoMoved from different state 49 0.4% White / Caucasian38 0.2% Black or African American12 0.5% Two or more races47 0.4% White alone, not Hispanic / Latino15 2.5% Hispanic or LatinoMoved from abroad 11 0.1% White33 0.2% Black or African American12 0.1% White alone, not Hispanic / Latino
Children Nativity (place of birth) in Eastpointe
Children under 6 years - Living with two parents Both parents native 804 100.0% NativeBoth parents foreign-born 48 100.0% NativeOne native, one foreign-born parent 104 100.0% NativeChildren under 6 years - Living with one parent Native parent 1,555 100.0% NativeChildren 6 to 17 years - Living with two parents Both parents native 2,101 100.0% NativeBoth parents foreign-born 2 4.1% Native43 95.9% Foreign-bornOne native, one foreign-born parent 69 89.6% Native8 10.4% Foreign-bornChildren 6 to 17 years - Living with one parent Native parent 2,954 99.0% Native30 1.0% Foreign-bornForeign-born parent 68 100.0% Native
Grandparents responsible for own grandchildren in Eastpointe
Grandparents (30 to 59 years) White / Caucasian 64 100.0% Not responsible for grandchildrenBlack or African American 113 36.5% Responsible for grandchildren196 63.5% Not responsible for grandchildrenTwo or more races 42 100.0% Not responsible for grandchildrenWhite alone, not Hispanic / Latino 25 100.0% Not responsible for grandchildrenHispanic or Latino 3 3.1% Responsible for grandchildren96 96.9% Not responsible for grandchildrenGrandparents (60 years and over) White / Caucasian 45 34.0% Responsible for grandchildren87 66.0% Not responsible for grandchildrenBlack or African American 30 15.1% Responsible for grandchildren169 84.9% Not responsible for grandchildrenTwo or more races 9 58.8% Responsible for grandchildren7 41.2% Not responsible for grandchildrenWhite alone, not Hispanic / Latino 45 33.7% Responsible for grandchildren88 66.3% Not responsible for grandchildren