Estimated zip code population in 2022: 34,006 Zip code population in 2010: 32,353 Zip code population in 2000: 33,405
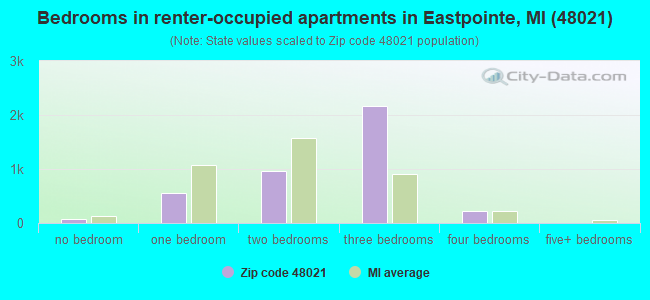
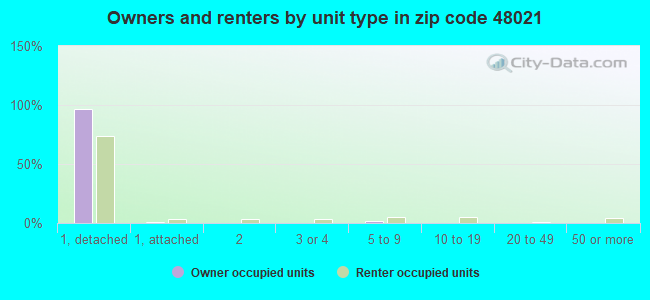
Houses and condos: 14,126 Renter-occupied apartments: 4,076
% of renters here:
30%
State:
27%
March 2022 cost of living index in zip code 48021: 95.6 (near average, U.S. average is 100)
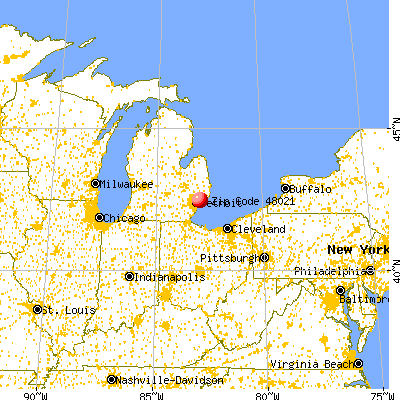
Land area: 5.1 sq. mi. Water area: 0.0 sq. mi.
Population density: 6,646 people per square mile
(high).
OSM Map
General Map
Google Map
MSN Map
OSM Map
General Map
Google Map
MSN Map
OSM Map
General Map
Google Map
MSN Map
OSM Map
General Map
Google Map
MSN Map
Please wait while loading the map...
Real estate property taxes paid for housing units in 2022:
This zip code:
1.9% ($2,454)
Michigan:
1.2% ($2,746)
Median real estate property taxes paid for housing units with mortgages in 2022: $2,584 (1.9%) Median real estate property taxes paid for housing units with no mortgage in 2022: $2,274 (2.0%)
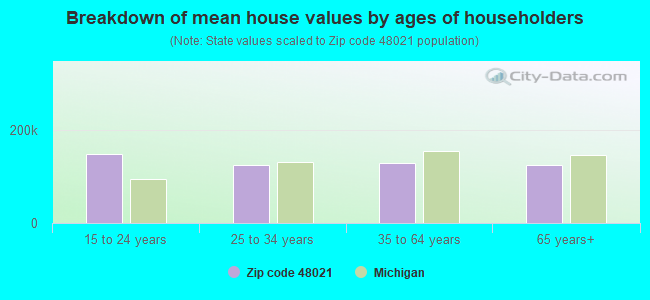
Estimated median house/condo value in 2022: $128,436
48021:
$128,436
Michigan:
$224,400
According to our research of Michigan and other state lists, there were 93 registered sex offenders living in 48021 zip code as of April 27, 2024. The ratio of all residents to sex offenders in zip code 48021 is 355 to 1. The ratio of registered sex offenders to all residents in this zip code is near the state average.
Median resident age:
This zip code:
36.8 years
Michigan median age:
40.3 years
Average household size:
This zip code:
2.5 people
Michigan:
2.4 people
Averages for the 2020 tax year for zip code 48021, filed in 2021:
Average Adjusted Gross Income (AGI) in 2020: $38,465 (Individual Income Tax Returns)
Here:
$38,465
State:
$68,945
Salary/wage: $36,358 (reported on 80.6% of returns)
Here:
$36,358
State:
$57,142
(% of AGI for various income ranges: 1084.5% for AGIs below $25k, 3460.9% for AGIs $25k-50k, 6879.8% for AGIs $50k-75k, 10232.3% for AGIs $75k-100k, 16982.3% for AGIs $100k-200k, 32403.3% for AGIs over 200k)
Taxable interest for individuals: $740 (reported on 13.6% of returns)
This zip code:
$740
Michigan:
$1,630
(% of AGI for various income ranges: 6.5% for AGIs below $25k, 7.8% for AGIs $25k-50k, 18.7% for AGIs $50k-75k, 32.5% for AGIs $75k-100k, 98.1% for AGIs $100k-200k, 40.0% for AGIs over 200k)
Ordinary dividends: $2,417 (reported on 6.5% of returns)
Here:
$2,417
State:
$6,972
(% of AGI for various income ranges: 7.9% for AGIs below $25k, 7.7% for AGIs $25k-50k, 32.6% for AGIs $50k-75k, 69.2% for AGIs $75k-100k, 151.3% for AGIs $100k-200k, 560.0% for AGIs over 200k)
Net capital gain/loss in AGI: +$4,726 (reported on 5.3% of returns)
Here:
+$4,726
State:
+$20,064
(% of AGI for various income ranges: 3.5% for AGIs below $25k, 6.0% for AGIs $25k-50k, 24.3% for AGIs $50k-75k, 116.6% for AGIs $75k-100k, 254.9% for AGIs $100k-200k, 4560.0% for AGIs over 200k)
Taxable individual retirement arrangement distribution: $11,732 (reported on 4.7% of returns)
48021:
$11,732
Michigan:
$19,803
(% of AGI for various income ranges: 27.2% for AGIs below $25k, 33.6% for AGIs $25k-50k, 89.6% for AGIs $50k-75k, 185.2% for AGIs $75k-100k, 784.9% for AGIs $100k-200k)
Total itemized deductions: $24,781 (reported on 3.9% of returns)
Here:
$24,781
State:
$34,117
(% of AGI for various income ranges: 22.2% for AGIs below $25k, 85.8% for AGIs $25k-50k, 236.4% for AGIs $50k-75k, 462.3% for AGIs $75k-100k, 867.2% for AGIs $100k-200k)
Charity contributions: $8,889 (reported on 3.2% of returns)
Here:
$8,889
State:
$13,548
(% of AGI for various income ranges: 2.8% for AGIs below $25k, 24.0% for AGIs $25k-50k, 71.7% for AGIs $50k-75k, 144.8% for AGIs $75k-100k, 290.6% for AGIs $100k-200k)
Taxes paid: $6,099 (reported on 3.9% of returns)
48021:
$6,099
State:
$7,972
(% of AGI for various income ranges: 3.9% for AGIs below $25k, 17.5% for AGIs $25k-50k, 57.1% for AGIs $50k-75k, 121.8% for AGIs $75k-100k, 259.8% for AGIs $100k-200k)
Earned income credit: $2,432 (reported on 26.0% of returns)
Here:
$2,432
State:
$2,251
(% of AGI for various income ranges: 122.4% for AGIs below $25k, 96.9% for AGIs $25k-50k, 1.2% for AGIs $50k-75k)
Percentage of individuals using paid preparers for their 2020 taxes: 91.6%
Here:
92%
State:
93%
(% for various income ranges: 91.5% for AGIs below $25k, 93.0% for AGIs $25k-50k, 90.4% for AGIs $50k-75k, 89.8% for AGIs $75k-100k, 89.0% for AGIs $100k-200k, 85.7% for AGIs over 200k)
Averages for the 2012 tax year for zip code 48021, filed in 2013:
Average Adjusted Gross Income (AGI) in 2012: $34,424 (Individual Income Tax Returns)
Here:
$34,424
State:
$55,609
Salary/wage: $32,791 (reported on 82.4% of returns)
Here:
$32,791
State:
$46,782
(% of AGI for various income ranges: 69.0% for AGIs below $25k, 80.8% for AGIs $25k-50k, 81.9% for AGIs $50k-75k, 82.3% for AGIs $75k-100k, 81.2% for AGIs $100k-200k, 35.7% for AGIs over 200k)
Taxable interest for individuals: $834 (reported on 21.5% of returns)
This zip code:
$834
Michigan:
$1,491
(% of AGI for various income ranges: 0.9% for AGIs below $25k, 0.5% for AGIs $25k-50k, 0.4% for AGIs $50k-75k, 0.5% for AGIs $75k-100k, 0.4% for AGIs $100k-200k)
Ordinary dividends: $2,125 (reported on 10.5% of returns)
Here:
$2,125
State:
$6,225
(% of AGI for various income ranges: 0.9% for AGIs below $25k, 0.6% for AGIs $25k-50k, 0.6% for AGIs $50k-75k, 0.7% for AGIs $75k-100k, 0.6% for AGIs $100k-200k)
Net capital gain/loss in AGI: +$1,349 (reported on 5.6% of returns)
Here:
+$1,349
State:
+$9,326
(% of AGI for various income ranges: 0.1% for AGIs $50k-75k, 1.3% for AGIs $100k-200k)
Profit/loss from business: +$4,995 (reported on 15.2% of returns)
Here:
+$4,995
State:
+$11,523
(% of AGI for various income ranges: 9.9% for AGIs below $25k, 0.7% for AGIs $25k-50k, 0.4% for AGIs $50k-75k, 0.7% for AGIs $75k-100k, 0.5% for AGIs $100k-200k)
Taxable individual retirement arrangement distribution: $9,628 (reported on 7.4% of returns)
48021:
$9,628
Michigan:
$15,298
(% of AGI for various income ranges: 2.3% for AGIs below $25k, 1.6% for AGIs $25k-50k, 2.0% for AGIs $50k-75k, 2.1% for AGIs $75k-100k, 3.2% for AGIs $100k-200k)
Total itemized deductions: $15,150 (24% of AGI, reported on 22.1% of returns)
Here:
$15,150
State:
$21,628
Here:
24.2% of AGI
State:
18.4% of AGI
(% of AGI for various income ranges: 5.9% for AGIs below $25k, 9.1% for AGIs $25k-50k, 11.0% for AGIs $50k-75k, 11.7% for AGIs $75k-100k, 11.9% for AGIs $100k-200k, 8.9% for AGIs over 200k)
Charity contributions: $3,140 (reported on 18.4% of returns)
Here:
$3,140
State:
$4,225
(% of AGI for various income ranges: 0.6% for AGIs below $25k, 1.5% for AGIs $25k-50k, 2.0% for AGIs $50k-75k, 2.1% for AGIs $75k-100k, 2.4% for AGIs $100k-200k, 1.3% for AGIs over 200k)
Taxes paid: $4,880 (reported on 22.0% of returns)
48021:
$4,880
State:
$8,327
(% of AGI for various income ranges: 1.2% for AGIs below $25k, 2.4% for AGIs $25k-50k, 3.6% for AGIs $50k-75k, 4.2% for AGIs $75k-100k, 4.9% for AGIs $100k-200k, 3.8% for AGIs over 200k)
Earned income credit: $2,569 (reported on 28.7% of returns)
Here:
$2,569
State:
$2,306
(% of AGI for various income ranges: 9.9% for AGIs below $25k, 1.3% for AGIs $25k-50k)
Percentage of individuals using paid preparers for their 2012 taxes: 54.7%
Here:
55%
State:
57%
(% for various income ranges: 53.4% for AGIs below $25k, 53.7% for AGIs $25k-50k, 57.9% for AGIs $50k-75k, 59.2% for AGIs $75k-100k, 62.9% for AGIs $100k-200k)
Averages for the 2004 tax year for zip code 48021, filed in 2005:
Average Adjusted Gross Income (AGI) in 2004: $37,740 (Individual Income Tax Returns)
Here:
$37,740
State:
$48,204
Salary/wage: $37,384 (reported on 84.8% of returns)
Here:
$37,384
State:
$42,791
(% of AGI for various income ranges: 69.4% for AGIs below $10k, 68.6% for AGIs $10k-25k, 84.3% for AGIs $25k-50k, 88.4% for AGIs $50k-75k, 89.4% for AGIs $75k-100k, 81.7% for AGIs over 100k)
Taxable interest for individuals: $1,203 (reported on 44.3% of returns)
This zip code:
$1,203
Michigan:
$1,725
(% of AGI for various income ranges: 6.0% for AGIs below $10k, 3.3% for AGIs $10k-25k, 1.5% for AGIs $25k-50k, 0.8% for AGIs $50k-75k, 0.8% for AGIs $75k-100k, 1.1% for AGIs over 100k)
Taxable dividends: $1,614 (reported on 18.2% of returns)
Here:
$1,614
State:
$3,420
(% of AGI for various income ranges: 2.7% for AGIs below $10k, 1.6% for AGIs $10k-25k, 0.6% for AGIs $25k-50k, 0.6% for AGIs $50k-75k, 0.5% for AGIs $75k-100k, 0.8% for AGIs over 100k)
Net capital gain/loss: +$1,920 (reported on 11.7% of returns)
Here:
+$1,920
State:
+$8,532
(% of AGI for various income ranges: -0.7% for AGIs below $10k, -0.1% for AGIs $10k-25k, 0.2% for AGIs $25k-50k, 0.6% for AGIs $50k-75k, 0.6% for AGIs $75k-100k, 2.1% for AGIs over 100k)
Profit/loss from business: +$5,687 (reported on 10.1% of returns)
Here:
+$5,687
State:
+$9,547
(% of AGI for various income ranges: 6.0% for AGIs below $10k, 4.3% for AGIs $10k-25k, 1.6% for AGIs $25k-50k, 0.7% for AGIs $50k-75k, 0.8% for AGIs $75k-100k, 1.3% for AGIs over 100k)
IRA payment deduction: $2,207 (reported on 1.7% of returns)
48021:
$2,207
Michigan:
$2,875
(% of AGI for various income ranges: 0.2% for AGIs below $10k, 0.2% for AGIs $10k-25k, 0.1% for AGIs $25k-50k, 0.1% for AGIs $50k-75k, 0.1% for AGIs $75k-100k, 0.1% for AGIs over 100k)
Self-employed pension: $1,400 (reported on 0.1% of returns)
Here:
$1,400
Michigan:
$13,826
Total itemized deductions: $14,091 (24% of AGI, reported on 40.9% of returns)
Here:
$14,091
State:
$18,509
Here:
24.4% of AGI
State:
20.7% of AGI
(% of AGI for various income ranges: 10.6% for AGIs below $10k, 10.5% for AGIs $10k-25k, 15.7% for AGIs $25k-50k, 16.9% for AGIs $50k-75k, 15.8% for AGIs $75k-100k, 14.8% for AGIs over 100k)
Charity contributions deductions: $2,221 (4% of AGI, reported on 36.4% of returns)
Here:
$2,221
State:
$3,365
Here:
3.7% of AGI
State:
3.6% of AGI
(% of AGI for various income ranges: 0.7% for AGIs below $10k, 1.1% for AGIs $10k-25k, 1.9% for AGIs $25k-50k, 2.4% for AGIs $50k-75k, 2.5% for AGIs $75k-100k, 2.8% for AGIs over 100k)
Total tax: $4,299 (reported on 76.5% of returns)
48021:
$4,299
State:
$7,691
(% of AGI for various income ranges: 2.0% for AGIs below $10k, 4.1% for AGIs $10k-25k, 6.9% for AGIs $25k-50k, 8.7% for AGIs $50k-75k, 10.3% for AGIs $75k-100k, 15.1% for AGIs over 100k)
Earned income credit: $1,589 (reported on 12.6% of returns)
Here:
$1,589
State:
$1,737
Percentage of individuals using paid preparers for their 2004 taxes: 59.8%
Here:
60%
State:
60%
(% for various income ranges: 54.1% for AGIs below $10k, 60.8% for AGIs $10k-25k, 60.1% for AGIs $25k-50k, 61.9% for AGIs $50k-75k, 61.5% for AGIs $75k-100k, 66.5% for AGIs over 100k)
Likely homosexual households (counted as self-reported same-sex unmarried-partner households)
Lesbian couples: 0.3% of all households
Gay men: 0.0% of all households
Household received Food Stamps/SNAP in the past 12 months: 3,126 Household did not receive Food Stamps/SNAP in the past 12 months: 10,470
Women who had a birth in the past 12 months: 380 (194 now married, 180 unmarried) Women who did not have a birth in the past 12 months: 7,886 (2,163 now married, 5,744 unmarried)
Housing units in zip code 48021 with a mortgage: 5,823 (261 second mortgage, 4 home equity loan, 157 both second mortgage and home equity loan) Houses without a mortgage: 520
Median monthly owner costs for units with a mortgage: $1,105 Median monthly owner costs for units without a mortgage: $536
Residents with income below the poverty level in 2022:
This zip code:
17.6%
Whole state:
13.4%
Residents with income below 50% of the poverty level in 2022:
This zip code:
8.3%
Whole state:
6.9%
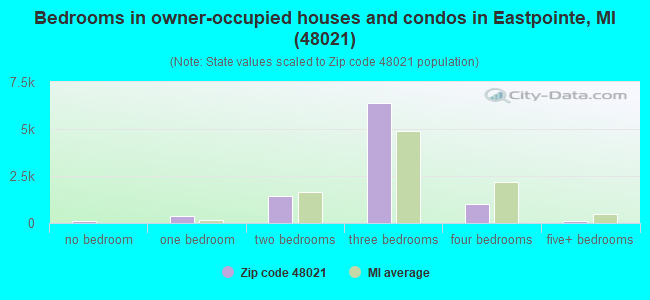
Median number of rooms in houses and condos:
Here:
5.6
State:
6.5
Median number of rooms in apartments:
Here:
4.9
State:
4.3
Notable locations in this zip code not listed on our city pages
Notable locations in zip code 48021: Eastpointe Memorial Library (A), Eastpointe Courthouse (B), Eastpointe Police Station (C), Bon Secours Eastpointe Physicians Center (D), Eastpointe Fire and Rescue (E). Display/hide their locations on the map
Churches in zip code 48021 include: Saint Veronica Church (A), Bethesda Community Church (B), First Baptist Church (C), Everlasting Word Christian Church (D), Bethesda Community Church (E), Church of Christ Northeast (F), Beaconsfield Baptist Church (G), Community of Christ (H), Faith Covenant Fellowship (I). Display/hide their locations on the map
Parks in zip code 48021 include: Erin-Warren Fractional District Number Two School Historical Marker (1), Immanuel Methodist Episcopal Church Historical Marker (2), Saint Peter's Evangelical Lutheran Church Historical Marker (3), Spindler Park (4), Goetz Park (5), John F Kennedy Park (6). Display/hide their locations on the map
3,072 married couples with children.
4,037 single-parent households (861 men, 3,176 women).
97.0% of residents of 48021 zip code speak English at home.
0.5% of residents speak Spanish at home (47% very well, 30% well, 23% not well).
0.9% of residents speak other Indo-European language at home (63% very well, 10% well, 27% not well).
0.4% of residents speak Asian or Pacific Island language at home (24% very well, 34% well, 42% not well).
0.5% of residents speak other language at home (49% very well, 42% well, 9% not at all).
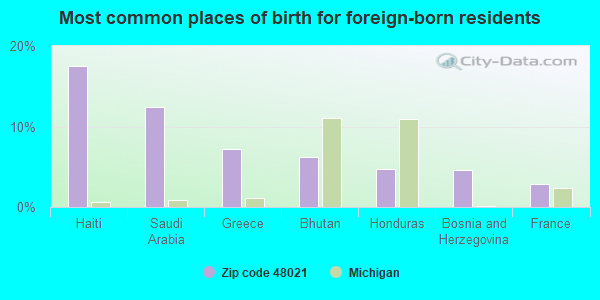
Foreign born population: 1,052 (3.1%) (67.1% of them are naturalized citizens)
This zip code:
3.1%
Whole state:
6.9%
17%Haiti
12%Saudi Arabia
7%Greece
6%Bhutan
5%Honduras
5%Bosnia and Herzegovina
3%France
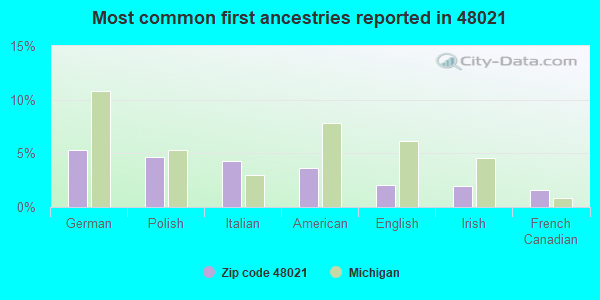
5%German
5%Polish
4%Italian
4%American
2%English
2%Irish
2%French Canadian
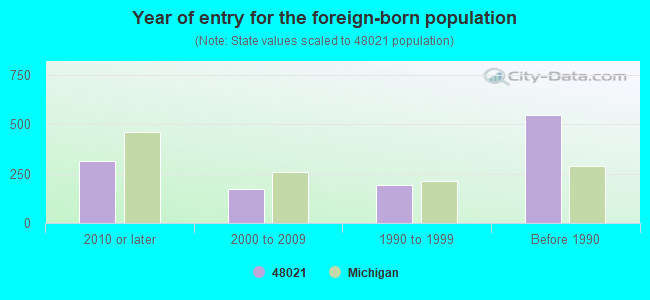
Year of entry for the foreign-born population
3112010 or later
1712000 to 2009
1921990 to 1999
546Before 1990
Major facilities with environmental interests located in this zip code:
A & W CUSTOM CHROME (17726 E. NINE MILE ROAD in EASTPOINTE, MI)
AIR MINOR (AIRS/AFS) (Integrated Compliance Information System) - ICIS-05-1999-0527, FORMAL ENFORCEMENT ACTION Conditionally Exempt Small Quantity Generators, less than 100 kg/month of hazardous waste (Resource Conservation and Recovery Act (tracking hazardous waste)) - notification Business SIC classification: ELECTROPLATING, PLATING, POLISHING, ANODIZING, AND COLORING; NONCLASSIFIABLE ESTABLISHMENTS Organizations: BRIAN BOX (CONTACT/OWNER)
Alternative names: A W CUSTOM CHROME INC
EAST DETROIT PUBLIC SCHOOLS (14200 STEPHENS ROAD in EAST DETROIT, MI)
(Integrated Compliance Information System) - ICIS-05-1987-0257, FORMAL ENFORCEMENT ACTION COMPLIANCE ACTIVITY (Tracking inspections of insecticide, fungicide, and rodenticide, and toxic substances) (Resource Conservation and Recovery Act (tracking hazardous waste)) Business SIC classification: ELEMENTARY AND SECONDARY SCHOOLS
EAST DETROIT PUBLIC SCHOOLS (15501 COUZENS in EASTPOINTE, MI)
(Geographic Names Information System) (National Center for Education Statistics) - STATE ID-01003 (Resource Conservation and Recovery Act (tracking hazardous waste)) Organizations: EAST DETROIT HIGH SCHOOL (CONTACT/OPERATOR)
Alternative names: EAST DETROIT HIGH SCHOOL, EAST DETROIT HS
FOREST PARK ELEMENTARY SCHOOL (18361 FOREST AVENUE in EASTPOINTE, MI)
(National Center for Education Statistics) - STATE ID-01266 Organizations: EAST DETROIT PUBLIC SCHOOLS (SCHOOL DISTRICT)
BELLVIEW ELEMENTARY SCHOOL (15800 BELL in EASTPOINTE, MI)
(National Center for Education Statistics) - STATE ID-00268 Organizations: EAST DETROIT PUBLIC SCHOOLS (SCHOOL DISTRICT)
AMOCO OIL CO 0108 OFFICIAL (15035 E 10 MILE RD in EASTPOINTE, MI)
(Resource Conservation and Recovery Act (tracking hazardous waste)) Organizations: AMOCO OIL COMPANY (CONTACT/OWNER)
AMOCO OIL CO 5372 TRI CITY SVC (19440 E 10 MILE in EASTPOINTE, MI)
(Resource Conservation and Recovery Act (tracking hazardous waste)) Organizations: AMOCO OIL COMPANY (CONTACT/OWNER)
AMOCO OIL CO 5822 (22701 GRATIOT in EASTPOINTE, MI)
(Resource Conservation and Recovery Act (tracking hazardous waste)) Organizations: AMOCO OIL COMPANY (CONTACT/OWNER)
GERRYS EAST DETROIT COLLISION (15653 E 10 MILE RD in EASTPOINTE, MI)
BAY WASH OF MICHIGAN LLC (24610 GRATIOT AVE in EASTPOINTE, MI)
(Resource Conservation and Recovery Act (tracking hazardous waste)) Business NAICS classification: CAR WASHES.
EXXONMOBIL OIL CORPORATION (18700 10 MILE & KELLY in EASTPOINTE, MI)
Conditionally Exempt Small Quantity Generators, less than 100 kg/month of hazardous waste (Resource Conservation and Recovery Act (tracking hazardous waste)) HAZARDOUS WASTE BIENNIAL REPORTER (Resource Conservation and Recovery Act (tracking hazardous waste)) Organizations: EXXONMOBILE OIL CORPORATION (CONTACT/OWNER)
Alternative names: MOBIL OIL CORP HOJ
AUTO CLINIC (22130 GRATIOT in EAST POINT, MI, MI)
AIR MINOR (AIRS/AFS) Business SIC classification: AUTOMOTIVE REPAIR SHOPS
AUTOZONE INC (24550 GRATIOT AVE in EASTPOINTE, MI)
Conditionally Exempt Small Quantity Generators, less than 100 kg/month of hazardous waste (Resource Conservation and Recovery Act (tracking hazardous waste)) Organizations: RHEM EMMEWECKER (CONTACT/OWNER)
Housing units lacking complete plumbing facilities: 1.0% Housing units lacking complete kitchen facilities: 1.6%
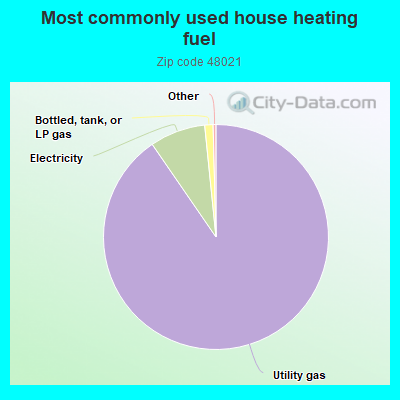
90.5%Utility gas
8.0%Electricity
1.2%Bottled, tank, or LP gas
Population in 1990: 35,073.
Place of birth for U.S.-born residents:
This state: 28,667
Northeast: 488
Midwest: 954
South: 1,985
West: 599
64% of the 48021 zip code residents lived in the same house 5 years ago. Out of people who lived in different houses, 60% lived in this county. Out of people who lived in different counties, 50% lived in Michigan.
91% of the 48021 zip code residents lived in the same house 1 year ago. Out of people who lived in different houses, 65% moved from this county. Out of people who lived in different houses, 27% moved from different county within same state. Out of people who lived in different houses, 5% moved from different state. Out of people who lived in different houses, 2% moved from abroad.
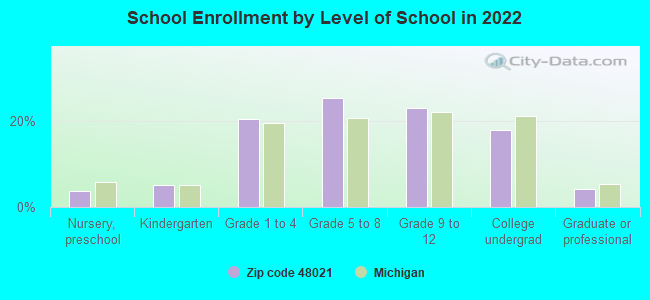
Private vs. public school enrollment:
Students in private schools in grades 1 to 8 (elementary and middle school): 144
Here:
4.0%
Michigan:
12.4%
Students in private schools in grades 9 to 12 (high school): 161
Here:
8.9%
Michigan:
9.8%
Students in private undergraduate colleges: 280
Here:
20.0%
Michigan:
14.9%
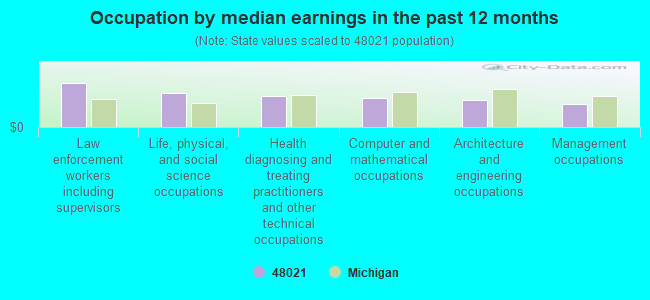
Occupation by median earnings in the past 12 months ($)
108,581Law enforcement workers including supervisors
84,048Life, physical, and social science occupations
77,356Health diagnosing and treating practitioners and other technical occupations
70,625Computer and mathematical occupations
67,753Architecture and engineering occupations
56,084Management occupations
Companies with federal contracts located in this zip code:
ADVANCED INDUSTRIAL TECHNOLOGY (22205 KELLY in EASTPOINTE, MI; small business)
$69,600 with Navy for Other Defense -- Operational Systems Development (R&D). Signed on 2004-05-17. Completion date: 2005-02-17.
GALLERY FLOOR COVERING INC (21226 GRATIOT in EASTPOINTE, MI; small business) : $36,768 in 5 contractsfrom 2000 to 2004
Contracts for Floor Coverings, Maintenance, Repair or Alteration of Real Property -- Hospitals and Infirmaries, Maintenance, Repair or Alteration of Real Property -- Other Educational Buildings by Army Signed by year:2000: $4,785; 2001: $0; 2002: $15,903; 2003: $0; 2004: $16,080; 2005: $0; 2006: $0.
Biggest contracts:
$16,080 with Army for Floor Coverings. Signed on 2004-09-27. Completion date: 2004-11-30.
$10,350 with Army for Maintenance, Repair or Alteration of Real Property -- Hospitals and Infirmaries. Signed on 2002-07-31. Completion date: 2002-08-15.
$5,499 with Army for Floor Coverings. Signed on 2002-09-30. Completion date: 2002-10-30.
$4,785 with Army for Maintenance, Repair or Alteration of Real Property -- Other Educational Buildings. Signed on 2000-09-26. Completion date: 2000-10-16.
ROADRUNNERS UPHOLSTERY (15651 MOK AVE in EASTPOINTE, MI; small business)
$25,490 with Air Force for Maintenance, Repair and Rebuilding of Equipment -- Furniture. Taking place in MD. Signed on 2005-09-30. Completion date: 2005-10-30.
LITHO PRINTING SERVICE INC (21541 GRATIOT AVE in EASTPOINTE, MI; small business)
$10,000 with Defense Logistics Agency for Print/Binding Services. Signed on 2005-10-01. Completion date: 2006-09-30.
YOUNG HEATING & COOLING CO INC (17525 STEPHENS DR in EAST DETROIT, MI; small business)
$9,750 with Army for Air Conditioning Equipment. Signed on 2004-12-06. Completion date: 2004-12-27.
WAYNE C ROCKENSUESS (16921 WILSON AVE in EASTPOINTE, MI; small business)
$6,500 with Army for Recreational Services. Signed on 2004-01-08. Completion date: 2004-04-01.
Top industries in this zip code by the number of employees in 2005:
2002 - 2018 National Fire Incident Reporting System (NFIRS) incidents
Based on the data from the years 2002 - 2018 the average number of fires per year is 81. The highest number of fires - 115 took place in 2017, and the least - 23 in 2014. The data has a growing trend.
When looking into fire subcategories, the most reports belonged to: Structure Fires (47.4%), and Outside Fires (25.5%).
Fire incident types reported to NFIRS in Zip Code 48021


 Nearest zip codes: 48225, 48066, 48089, 48205, 48080, 48224.


 Based on the data from the years 2002 - 2018 the average number of fires per year is 81. The highest number of fires - 115 took place in 2017, and the least - 23 in 2014. The data has a growing trend.
 When looking into fire subcategories, the most reports belonged to: Structure Fires (47.4%), and Outside Fires (25.5%).