Estimated zip code population in 2022: 16,189 Zip code population in 2010: 14,554 Zip code population in 2000: 14,413
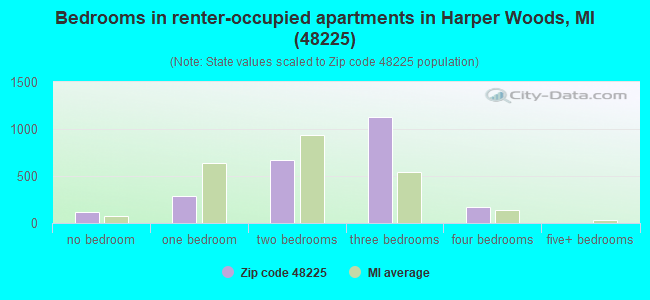
Houses and condos: 6,241 Renter-occupied apartments: 2,424
% of renters here:
41%
State:
27%
March 2022 cost of living index in zip code 48225: 96.1 (near average, U.S. average is 100)
Land area: 2.6 sq. mi. Water area: 0.0 sq. mi.
Population density: 6,117 people per square mile
(high).
OSM Map
General Map
Google Map
MSN Map
OSM Map
General Map
Google Map
MSN Map
OSM Map
General Map
Google Map
MSN Map
OSM Map
General Map
Google Map
MSN Map
Please wait while loading the map...
Real estate property taxes paid for housing units in 2022:
This zip code:
2.1% ($3,088)
Michigan:
1.2% ($2,746)
Median real estate property taxes paid for housing units with mortgages in 2022: $3,293 (2.1%) Median real estate property taxes paid for housing units with no mortgage in 2022: $2,905 (2.2%)
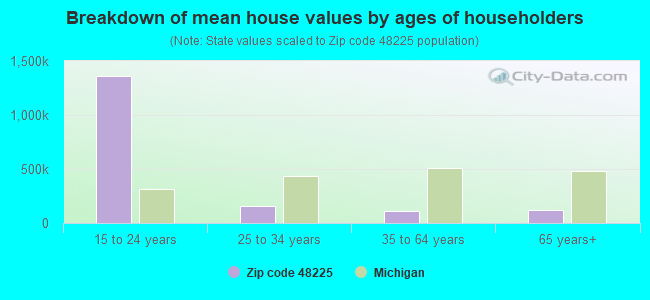
Estimated median house/condo value in 2022: $148,187
48225:
$148,187
Michigan:
$224,400
According to our research of Michigan and other state lists, there were 32 registered sex offenders living in 48225 zip code as of April 26, 2024. The ratio of all residents to sex offenders in zip code 48225 is 453 to 1. The ratio of registered sex offenders to all residents in this zip code is lower than the state average.
Median resident age:
This zip code:
35.6 years
Michigan median age:
40.3 years
Average household size:
This zip code:
2.7 people
Michigan:
2.4 people
Averages for the 2020 tax year for zip code 48225, filed in 2021:
Average Adjusted Gross Income (AGI) in 2020: $41,472 (Individual Income Tax Returns)
Here:
$41,472
State:
$68,945
Salary/wage: $38,931 (reported on 80.9% of returns)
Here:
$38,931
State:
$57,142
(% of AGI for various income ranges: 1050.5% for AGIs below $25k, 3399.2% for AGIs $25k-50k, 7153.0% for AGIs $50k-75k, 10513.9% for AGIs $75k-100k, 17002.6% for AGIs $100k-200k)
Taxable interest for individuals: $685 (reported on 14.0% of returns)
This zip code:
$685
Michigan:
$1,630
(% of AGI for various income ranges: 6.3% for AGIs below $25k, 3.9% for AGIs $25k-50k, 15.4% for AGIs $50k-75k, 43.6% for AGIs $75k-100k, 79.3% for AGIs $100k-200k)
Ordinary dividends: $3,247 (reported on 8.2% of returns)
Here:
$3,247
State:
$6,972
(% of AGI for various income ranges: 11.3% for AGIs below $25k, 13.4% for AGIs $25k-50k, 53.5% for AGIs $50k-75k, 114.7% for AGIs $75k-100k, 241.9% for AGIs $100k-200k)
Net capital gain/loss in AGI: +$3,468 (reported on 7.0% of returns)
Here:
+$3,468
State:
+$20,064
(% of AGI for various income ranges: 2.2% for AGIs below $25k, 9.1% for AGIs $25k-50k, 19.0% for AGIs $50k-75k, 177.2% for AGIs $75k-100k, 304.1% for AGIs $100k-200k)
Taxable individual retirement arrangement distribution: $13,156 (reported on 5.2% of returns)
48225:
$13,156
Michigan:
$19,803
(% of AGI for various income ranges: 26.2% for AGIs below $25k, 41.1% for AGIs $25k-50k, 96.5% for AGIs $50k-75k, 265.8% for AGIs $75k-100k, 745.2% for AGIs $100k-200k)
Total itemized deductions: $24,022 (reported on 5.5% of returns)
Here:
$24,022
State:
$34,117
(% of AGI for various income ranges: 28.4% for AGIs below $25k, 109.6% for AGIs $25k-50k, 314.6% for AGIs $50k-75k, 625.8% for AGIs $75k-100k, 844.8% for AGIs $100k-200k)
Charity contributions: $8,678 (reported on 4.8% of returns)
Here:
$8,678
State:
$13,548
(% of AGI for various income ranges: 3.2% for AGIs below $25k, 32.2% for AGIs $25k-50k, 99.4% for AGIs $50k-75k, 216.9% for AGIs $75k-100k, 311.1% for AGIs $100k-200k)
Taxes paid: $6,766 (reported on 5.5% of returns)
48225:
$6,766
State:
$7,972
(% of AGI for various income ranges: 5.0% for AGIs below $25k, 27.2% for AGIs $25k-50k, 89.1% for AGIs $50k-75k, 187.5% for AGIs $75k-100k, 272.2% for AGIs $100k-200k)
Earned income credit: $2,622 (reported on 25.7% of returns)
Here:
$2,622
State:
$2,251
(% of AGI for various income ranges: 135.4% for AGIs below $25k, 107.0% for AGIs $25k-50k)
Percentage of individuals using paid preparers for their 2020 taxes: 91.5%
Here:
91%
State:
93%
(% for various income ranges: 91.4% for AGIs below $25k, 92.4% for AGIs $25k-50k, 91.3% for AGIs $50k-75k, 89.3% for AGIs $75k-100k, 89.4% for AGIs $100k-200k, 100.0% for AGIs over 200k)
Averages for the 2012 tax year for zip code 48225, filed in 2013:
Average Adjusted Gross Income (AGI) in 2012: $36,368 (Individual Income Tax Returns)
Here:
$36,368
State:
$55,609
Salary/wage: $34,608 (reported on 81.3% of returns)
Here:
$34,608
State:
$46,782
(% of AGI for various income ranges: 69.3% for AGIs below $25k, 80.0% for AGIs $25k-50k, 81.0% for AGIs $50k-75k, 75.6% for AGIs $75k-100k, 78.0% for AGIs $100k-200k)
Taxable interest for individuals: $922 (reported on 21.7% of returns)
This zip code:
$922
Michigan:
$1,491
(% of AGI for various income ranges: 1.0% for AGIs below $25k, 0.4% for AGIs $25k-50k, 0.7% for AGIs $50k-75k, 0.5% for AGIs $75k-100k, 0.4% for AGIs $100k-200k)
Ordinary dividends: $3,437 (reported on 12.7% of returns)
Here:
$3,437
State:
$6,225
(% of AGI for various income ranges: 1.3% for AGIs below $25k, 0.9% for AGIs $25k-50k, 1.0% for AGIs $50k-75k, 1.2% for AGIs $75k-100k, 1.8% for AGIs $100k-200k)
Net capital gain/loss in AGI: +$817 (reported on 8.7% of returns)
Here:
+$817
State:
+$9,326
(% of AGI for various income ranges: 0.2% for AGIs $25k-50k, 0.2% for AGIs $50k-75k, 0.4% for AGIs $75k-100k, 0.4% for AGIs $100k-200k)
Profit/loss from business: +$5,936 (reported on 16.8% of returns)
Here:
+$5,936
State:
+$11,523
(% of AGI for various income ranges: 11.2% for AGIs below $25k, 0.6% for AGIs $25k-50k, 1.4% for AGIs $50k-75k, 0.9% for AGIs $75k-100k, 1.5% for AGIs $100k-200k)
Taxable individual retirement arrangement distribution: $10,224 (reported on 8.0% of returns)
48225:
$10,224
Michigan:
$15,298
(% of AGI for various income ranges: 2.2% for AGIs below $25k, 2.0% for AGIs $25k-50k, 2.1% for AGIs $50k-75k, 2.9% for AGIs $75k-100k, 2.3% for AGIs $100k-200k)
Total itemized deductions: $15,769 (24% of AGI, reported on 26.2% of returns)
Here:
$15,769
State:
$21,628
Here:
23.8% of AGI
State:
18.4% of AGI
(% of AGI for various income ranges: 7.5% for AGIs below $25k, 10.2% for AGIs $25k-50k, 13.2% for AGIs $50k-75k, 13.1% for AGIs $75k-100k, 12.5% for AGIs $100k-200k)
Charity contributions: $3,274 (reported on 22.3% of returns)
Here:
$3,274
State:
$4,225
(% of AGI for various income ranges: 0.9% for AGIs below $25k, 2.0% for AGIs $25k-50k, 2.5% for AGIs $50k-75k, 2.3% for AGIs $75k-100k, 2.1% for AGIs $100k-200k)
Taxes paid: $5,587 (reported on 26.2% of returns)
48225:
$5,587
State:
$8,327
(% of AGI for various income ranges: 1.7% for AGIs below $25k, 3.1% for AGIs $25k-50k, 4.6% for AGIs $50k-75k, 5.1% for AGIs $75k-100k, 5.6% for AGIs $100k-200k)
Earned income credit: $2,609 (reported on 29.6% of returns)
Here:
$2,609
State:
$2,306
(% of AGI for various income ranges: 10.7% for AGIs below $25k, 1.5% for AGIs $25k-50k)
Percentage of individuals using paid preparers for their 2012 taxes: 55.3%
Here:
55%
State:
57%
(% for various income ranges: 52.8% for AGIs below $25k, 57.4% for AGIs $25k-50k, 58.5% for AGIs $50k-75k, 56.5% for AGIs $75k-100k, 57.5% for AGIs $100k-200k)
Averages for the 2004 tax year for zip code 48225, filed in 2005:
Average Adjusted Gross Income (AGI) in 2004: $41,358 (Individual Income Tax Returns)
Here:
$41,358
State:
$48,204
Salary/wage: $41,255 (reported on 81.8% of returns)
Here:
$41,255
State:
$42,791
(% of AGI for various income ranges: 80.8% for AGIs below $10k, 65.4% for AGIs $10k-25k, 82.1% for AGIs $25k-50k, 84.6% for AGIs $50k-75k, 86.3% for AGIs $75k-100k, 79.6% for AGIs over 100k)
Taxable interest for individuals: $1,522 (reported on 46.4% of returns)
This zip code:
$1,522
Michigan:
$1,725
(% of AGI for various income ranges: 8.2% for AGIs below $10k, 3.8% for AGIs $10k-25k, 1.9% for AGIs $25k-50k, 1.2% for AGIs $50k-75k, 1.3% for AGIs $75k-100k, 1.1% for AGIs over 100k)
Taxable dividends: $2,196 (reported on 24.1% of returns)
Here:
$2,196
State:
$3,420
(% of AGI for various income ranges: 6.1% for AGIs below $10k, 2.9% for AGIs $10k-25k, 1.1% for AGIs $25k-50k, 1.1% for AGIs $50k-75k, 0.8% for AGIs $75k-100k, 1.0% for AGIs over 100k)
Net capital gain/loss: +$3,672 (reported on 16.8% of returns)
Here:
+$3,672
State:
+$8,532
(% of AGI for various income ranges: -3.4% for AGIs below $10k, 0.2% for AGIs $10k-25k, 0.3% for AGIs $25k-50k, 0.6% for AGIs $50k-75k, 0.7% for AGIs $75k-100k, 6.2% for AGIs over 100k)
Profit/loss from business: +$6,901 (reported on 11.8% of returns)
Here:
+$6,901
State:
+$9,547
(% of AGI for various income ranges: 8.5% for AGIs below $10k, 5.1% for AGIs $10k-25k, 1.2% for AGIs $25k-50k, 1.5% for AGIs $50k-75k, 1.4% for AGIs $75k-100k, 2.2% for AGIs over 100k)
IRA payment deduction: $2,530 (reported on 1.9% of returns)
48225:
$2,530
Michigan:
$2,875
(% of AGI for various income ranges: 0.3% for AGIs $10k-25k, 0.1% for AGIs $25k-50k, 0.1% for AGIs $50k-75k, 0.1% for AGIs $75k-100k, 0.1% for AGIs over 100k)
Self-employed pension: $6,792 (reported on 0.3% of returns)
Here:
$6,792
Michigan:
$13,826
Total itemized deductions: $15,208 (25% of AGI, reported on 46.4% of returns)
Here:
$15,208
State:
$18,509
Here:
24.8% of AGI
State:
20.7% of AGI
(% of AGI for various income ranges: 20.0% for AGIs below $10k, 13.8% for AGIs $10k-25k, 17.6% for AGIs $25k-50k, 18.2% for AGIs $50k-75k, 17.5% for AGIs $75k-100k, 15.6% for AGIs over 100k)
Charity contributions deductions: $2,332 (4% of AGI, reported on 41.8% of returns)
Here:
$2,332
State:
$3,365
Here:
3.7% of AGI
State:
3.6% of AGI
(% of AGI for various income ranges: 1.1% for AGIs below $10k, 1.6% for AGIs $10k-25k, 2.0% for AGIs $25k-50k, 2.7% for AGIs $50k-75k, 2.6% for AGIs $75k-100k, 2.6% for AGIs over 100k)
Total tax: $5,037 (reported on 76.4% of returns)
48225:
$5,037
State:
$7,691
(% of AGI for various income ranges: 2.6% for AGIs below $10k, 3.9% for AGIs $10k-25k, 6.8% for AGIs $25k-50k, 9.1% for AGIs $50k-75k, 10.6% for AGIs $75k-100k, 14.7% for AGIs over 100k)
Earned income credit: $1,712 (reported on 12.5% of returns)
Here:
$1,712
State:
$1,737
Percentage of individuals using paid preparers for their 2004 taxes: 59.5%
Here:
60%
State:
60%
(% for various income ranges: 56.2% for AGIs below $10k, 62.5% for AGIs $10k-25k, 59.3% for AGIs $25k-50k, 60.5% for AGIs $50k-75k, 56.9% for AGIs $75k-100k, 61.1% for AGIs over 100k)
Likely homosexual households (counted as self-reported same-sex unmarried-partner households)
Lesbian couples: 0.3% of all households
Gay men: 0.2% of all households
Household received Food Stamps/SNAP in the past 12 months: 1,301 Household did not receive Food Stamps/SNAP in the past 12 months: 4,627
Women who had a birth in the past 12 months: 126 (27 now married, 94 unmarried) Women who did not have a birth in the past 12 months: 4,119 (951 now married, 3,183 unmarried)
Housing units in zip code 48225 with a mortgage: 1,851 (87 second mortgage, 13 home equity loan, 63 both second mortgage and home equity loan) Houses without a mortgage: 114
Median monthly owner costs for units with a mortgage: $1,383 Median monthly owner costs for units without a mortgage: $634
Residents with income below the poverty level in 2022:
This zip code:
20.4%
Whole state:
13.4%
Residents with income below 50% of the poverty level in 2022:
This zip code:
12.0%
Whole state:
6.9%
Median number of rooms in houses and condos:
Here:
6.0
State:
6.5
Median number of rooms in apartments:
Here:
4.8
State:
4.3
Notable locations in this zip code not listed on our city pages
Notable locations in zip code 48225: Harper Woods City Hall (A), Harper Woods Fire Department (B), Harper Woods Police Station (C), Harper Woods Public Library (D). Display/hide their locations on the map
1,047 married couples with children.
2,577 single-parent households (157 men, 2,420 women).
93.6% of residents of 48225 zip code speak English at home.
1.4% of residents speak Spanish at home (100% very well).
1.8% of residents speak other Indo-European language at home (95% very well, 5% well).
0.2% of residents speak Asian or Pacific Island language at home (81% very well, 19% well).
2.2% of residents speak other language at home (77% very well, 2% well, 21% not well).
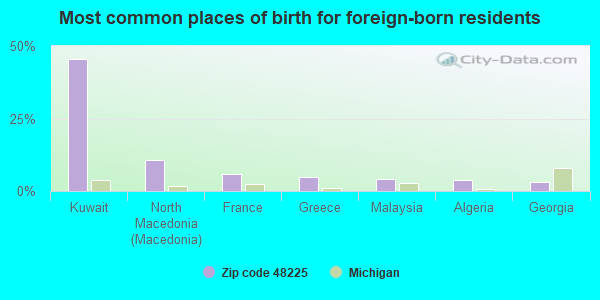
Foreign born population: 400 (2.5%) (69.4% of them are naturalized citizens)
This zip code:
2.5%
Whole state:
6.9%
45%Kuwait
11%North Macedonia (Macedonia)
6%France
5%Greece
4%Malaysia
4%Algeria
3%Georgia
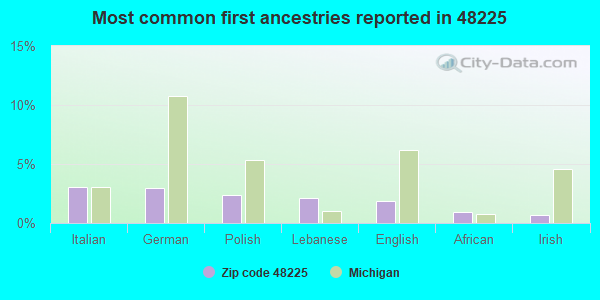
3%Italian
3%German
2%Polish
2%Lebanese
2%English
1%African
1%Irish
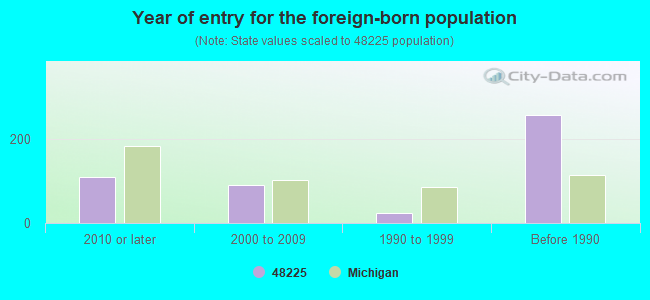
Year of entry for the foreign-born population
1112010 or later
912000 to 2009
241990 to 1999
258Before 1990
Facilities with environmental interests located in this zip code:
BEACON ELEMENTARY SCHOOL (19475 BEACONFIELD STREET in HARPER WOODS, MI)
(National Center for Education Statistics) - STATE ID-00233 Organizations: CITY OF HARPER WOODS SCHOOLS (SCHOOL DISTRICT)
CHARLES A. POUPARD ELEM. SCHOOL (20655 LENNON in HARPER WOODS, MI)
(National Center for Education Statistics) - STATE ID-05019 Organizations: GROSSE POINTE PUBLIC SCHOOLS (SCHOOL DISTRICT)
AMOCO OIL CO 3891 (1700 E 8 MILE SITE B in HARPER WOODS, MI)
(Resource Conservation and Recovery Act (tracking hazardous waste)) Organizations: AMOCO OIL COMPANY (CONTACT/OWNER)
MI DEPT/TRANSPORTATION BRIDGE P13-82025 (I-94 UNDER KENOSHA AVE PED X in HARPER WOODS, MI)
(Resource Conservation and Recovery Act (tracking hazardous waste)) Organizations: MICH DEPT OF TRANSPORTATION (CONTACT/OPERATOR)
Alternative names: MIDOT BRIDGE I-94 UNDER KENOSHA PED X
MI DEPT/TRANSPORTATION BRIDGE P14-82025 (I-94 UNDER WOODLAND AVE PED X in HARPER WOODS, MI)
(Resource Conservation and Recovery Act (tracking hazardous waste)) Organizations: MICH DEPT OF TRANSPORTATION (CONTACT/OPERATOR)
Alternative names: MIDOT BRIDGE I-94 UNDER WOODLAND PEDX
MI DEPT/TRANSPORTATION BRIDGE P15-82025 (I-94 UNDER WOODMONT PED X in HARPER WOODS, MI)
(Resource Conservation and Recovery Act (tracking hazardous waste)) Organizations: MICH DEPT OF TRANSPORTATION (CONTACT/OPERATOR)
Alternative names: MIDOT BRIDGE I-94 UNDER WOODMONT PED X
MI DEPT/TRANSPORTATION BRIDGE P16-82025 (I-94 UNDER KENMORE AVE PEDWALK in HARPER WOODS, MI)
(Resource Conservation and Recovery Act (tracking hazardous waste)) Organizations: MICH DEPT OF TRANSPORTATION (CONTACT/OPERATOR)
Alternative names: MIDOT BRIDGE I-94 UNDER KENMORE PEDWALK
MI DEPT/TRANSPORTATION BRIDGE P17-82025 (I-94 UNDER BEAUFAIT PEDWALK in HARPER WOODS, MI)
(Resource Conservation and Recovery Act (tracking hazardous waste)) Organizations: MICH DEPT OF TRANSPORTATION (CONTACT/OPERATOR)
Alternative names: MIDOT BRIDGE I-94 UMDER BEAUFAIT PEDWALK
B AND E MARATHON (19930 KELLY RD in HARPER WOODS, MI)
(Resource Conservation and Recovery Act (tracking hazardous waste))
ECLIPSE TECHNOLOGY (16227 E WARREN in DETROIT, MI)
(Resource Conservation and Recovery Act (tracking hazardous waste))
EQUILON ENTERPRISES UC DBA SHELL OIL PRO (19202 HARPER AND KINGSVILLE in HARPER WOODS, MI)
Conditionally Exempt Small Quantity Generators, less than 100 kg/month of hazardous waste (Resource Conservation and Recovery Act (tracking hazardous waste)) Organizations: EQUILON ENTERPRISES LLC (CONTACT/OWNER)
Alternative names: SHELL OIL CO
Housing units lacking complete plumbing facilities: 0.9% Housing units lacking complete kitchen facilities: 1.7%
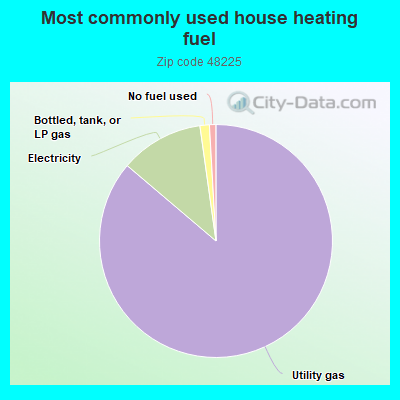
86.3%Utility gas
11.6%Electricity
1.3%Bottled, tank, or LP gas
0.9%No fuel used
Population in 1990: 14,937.
Place of birth for U.S.-born residents:
This state: 14,061
Northeast: 255
Midwest: 420
South: 826
West: 84
59% of the 48225 zip code residents lived in the same house 5 years ago. Out of people who lived in different houses, 61% lived in this county. Out of people who lived in different counties, 50% lived in Michigan.
87% of the 48225 zip code residents lived in the same house 1 year ago. Out of people who lived in different houses, 42% moved from this county. Out of people who lived in different houses, 51% moved from different county within same state. Out of people who lived in different houses, 4% moved from different state.
Private vs. public school enrollment:
Students in private schools in grades 1 to 8 (elementary and middle school): 112
Here:
5.0%
Michigan:
12.4%
Students in private schools in grades 9 to 12 (high school): 38
Here:
4.1%
Michigan:
9.8%
Students in private undergraduate colleges: 100
Here:
19.8%
Michigan:
14.9%
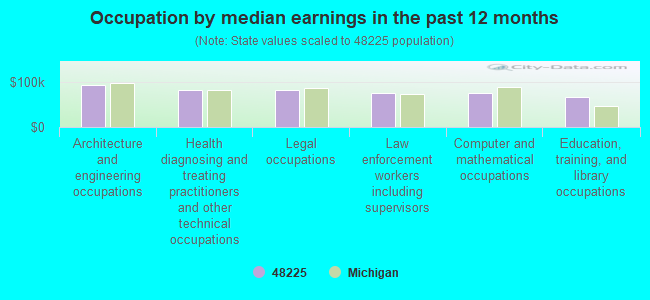
Occupation by median earnings in the past 12 months ($)
93,147Architecture and engineering occupations
82,179Health diagnosing and treating practitioners and other technical occupations
81,573Legal occupations
74,800Law enforcement workers including supervisors
74,752Computer and mathematical occupations
66,342Education, training, and library occupations
Companies with federal contracts located in this zip code:
KATIE CROOKS INC (20882 HARPER AVE in HARPER WOODS, MI; small business) : $18,032,611 in 173 contractsfrom 1999 to 2006
Contracts for Maintenance, Repair or Alteration of Real Property -- Maintenance Buildings, Maintenance, Repair or Alteration of Real Property -- Other Non-Building Facilities, Maintenance, Repair or Alteration of Real Property -- Radar and Navigational Facilities, Maintenance, Repair or Alteration of Real Property -- Office Buildings, and moreby Army, Public Buildings Service, United States Coast Guard (disused code: now 7008), U.S. Coast Guard, and others Signed by year:2000: $4,621,223; 2001: $1,401,084; 2002: $2,504,435; 2003: $2,941,997; 2004: $3,603,193; 2005: $1,854,051; 2006: $353,543.
Biggest contracts:
$3,237,389 with Army for Maintenance, Repair or Alteration of Real Property -- Maintenance Buildings. Signed on 2000-12-28. Completion date: 2001-12-28.
$1,286,210 with Army for Maintenance, Repair or Alteration of Real Property -- Other Non-Building Facilities. Signed on 2005-03-01. Completion date: 2006-03-01.
$869,950 with Army for Maintenance, Repair or Alteration of Real Property -- Radar and Navigational Facilities. Signed on 2002-06-21. Completion date: 2002-09-01.
$785,263 with Public Buildings Service for Maintenance, Repair or Alteration of Real Property -- Office Buildings. Signed on 2004-09-21. Effective on 2004-12-01. Completion date: 2005-06-02.
CONDELCO L L C (20882 HARPER AVENUE in HARPER WOODS, MI; small business) : $103,161 in 4 contractsfrom 2001 to 2003
$43,750 with Army for Lease or Rental of Facilities -- Other Non-Building Facilities. Signed on 2002-02-27. Completion date: 2002-03-01.
$22,900 with Army for Industrial Boilers. Signed on 2003-01-29. Completion date: 2003-02-03.
$19,950 with Army for Lease or Rental of Facilities -- Other Non-Building Facilities. Signed on 2002-02-27. Completion date: 2002-03-01.
$16,561 with Army for Office Furniture. Signed on 2001-09-30. Completion date: 2001-12-31.
AMERICAN CONSULTING COMPANY (19701 VERNIER RD, SUITE 27 in HARPER WOODS, MI; small business)
$8,250 with Navy for Other Management Support Services. Taking place in CA. Signed on 2005-02-16. Completion date: 2005-03-18.
Top industries in this zip code by the number of employees in 2005:
2002 - 2018 National Fire Incident Reporting System (NFIRS) incidents
Based on the data from the years 2002 - 2018 the average number of fires per year is 44. The highest number of fires - 77 took place in 2015, and the least - 26 in 2007. The data has a decreasing trend.
When looking into fire subcategories, the most reports belonged to: Structure Fires (63.2%), and Mobile Property/Vehicle Fires (17.9%).
Fire incident types reported to NFIRS in Zip Code 48225


 Nearest zip codes: 48224, 48021, 48236, 48080, 48205, 48230.


 Based on the data from the years 2002 - 2018 the average number of fires per year is 44. The highest number of fires - 77 took place in 2015, and the least - 26 in 2007. The data has a decreasing trend.
 When looking into fire subcategories, the most reports belonged to: Structure Fires (63.2%), and Mobile Property/Vehicle Fires (17.9%).