Harper Woods, Michigan Submit your own pictures of this city and show them to the world
OSM Map
General Map
Google Map
MSN Map
OSM Map
General Map
Google Map
MSN Map
OSM Map
General Map
Google Map
MSN Map
OSM Map
General Map
Google Map
MSN Map
Please wait while loading the map...
Population in 2022: 15,167 (100% urban, 0% rural). Population change since 2000: +6.4%Males: 7,033 Females: 8,134
March 2022 cost of living index in Harper Woods: 96.2 (near average, U.S. average is 100) Percentage of residents living in poverty in 2022: 20.0%for White Non-Hispanic residents , 24.4% for Black residents , 29.9% for Hispanic or Latino residents , 27.1% for American Indian residents , 15.1% for two or more races residents )
Profiles of local businesses
Business Search - 14 Million verified businesses
Data:
Median household income ($)
Median household income (% change since 2000)
Household income diversity
Ratio of average income to average house value (%)
Ratio of average income to average rent
Median household income ($) - White
Median household income ($) - Black or African American
Median household income ($) - Asian
Median household income ($) - Hispanic or Latino
Median household income ($) - American Indian and Alaska Native
Median household income ($) - Multirace
Median household income ($) - Other Race
Median household income for houses/condos with a mortgage ($)
Median household income for apartments without a mortgage ($)
Races - White alone (%)
Races - White alone (% change since 2000)
Races - Black alone (%)
Races - Black alone (% change since 2000)
Races - American Indian alone (%)
Races - American Indian alone (% change since 2000)
Races - Asian alone (%)
Races - Asian alone (% change since 2000)
Races - Hispanic (%)
Races - Hispanic (% change since 2000)
Races - Native Hawaiian and Other Pacific Islander alone (%)
Races - Native Hawaiian and Other Pacific Islander alone (% change since 2000)
Races - Two or more races (%)
Races - Two or more races (% change since 2000)
Races - Other race alone (%)
Races - Other race alone (% change since 2000)
Racial diversity
Unemployment (%)
Unemployment (% change since 2000)
Unemployment (%) - White
Unemployment (%) - Black or African American
Unemployment (%) - Asian
Unemployment (%) - Hispanic or Latino
Unemployment (%) - American Indian and Alaska Native
Unemployment (%) - Multirace
Unemployment (%) - Other Race
Population density (people per square mile)
Population - Males (%)
Population - Females (%)
Population - Males (%) - White
Population - Males (%) - Black or African American
Population - Males (%) - Asian
Population - Males (%) - Hispanic or Latino
Population - Males (%) - American Indian and Alaska Native
Population - Males (%) - Multirace
Population - Males (%) - Other Race
Population - Females (%) - White
Population - Females (%) - Black or African American
Population - Females (%) - Asian
Population - Females (%) - Hispanic or Latino
Population - Females (%) - American Indian and Alaska Native
Population - Females (%) - Multirace
Population - Females (%) - Other Race
Coronavirus confirmed cases (Apr 28, 2024)
Deaths caused by coronavirus (Apr 28, 2024)
Coronavirus confirmed cases (per 100k population) (Apr 28, 2024)
Deaths caused by coronavirus (per 100k population) (Apr 28, 2024)
Daily increase in number of cases (Apr 28, 2024)
Weekly increase in number of cases (Apr 28, 2024)
Cases doubled (in days) (Apr 28, 2024)
Hospitalized patients (Apr 18, 2022)
Negative test results (Apr 18, 2022)
Total test results (Apr 18, 2022)
COVID Vaccine doses distributed (per 100k population) (Sep 19, 2023)
COVID Vaccine doses administered (per 100k population) (Sep 19, 2023)
COVID Vaccine doses distributed (Sep 19, 2023)
COVID Vaccine doses administered (Sep 19, 2023)
Likely homosexual households (%)
Likely homosexual households (% change since 2000)
Likely homosexual households - Lesbian couples (%)
Likely homosexual households - Lesbian couples (% change since 2000)
Likely homosexual households - Gay men (%)
Likely homosexual households - Gay men (% change since 2000)
Cost of living index
Median gross rent ($)
Median contract rent ($)
Median monthly housing costs ($)
Median house or condo value ($)
Median house or condo value ($ change since 2000)
Mean house or condo value by units in structure - 1, detached ($)
Mean house or condo value by units in structure - 1, attached ($)
Mean house or condo value by units in structure - 2 ($)
Mean house or condo value by units in structure by units in structure - 3 or 4 ($)
Mean house or condo value by units in structure - 5 or more ($)
Mean house or condo value by units in structure - Boat, RV, van, etc. ($)
Mean house or condo value by units in structure - Mobile home ($)
Median house or condo value ($) - White
Median house or condo value ($) - Black or African American
Median house or condo value ($) - Asian
Median house or condo value ($) - Hispanic or Latino
Median house or condo value ($) - American Indian and Alaska Native
Median house or condo value ($) - Multirace
Median house or condo value ($) - Other Race
Median resident age
Resident age diversity
Median resident age - Males
Median resident age - Females
Median resident age - White
Median resident age - Black or African American
Median resident age - Asian
Median resident age - Hispanic or Latino
Median resident age - American Indian and Alaska Native
Median resident age - Multirace
Median resident age - Other Race
Median resident age - Males - White
Median resident age - Males - Black or African American
Median resident age - Males - Asian
Median resident age - Males - Hispanic or Latino
Median resident age - Males - American Indian and Alaska Native
Median resident age - Males - Multirace
Median resident age - Males - Other Race
Median resident age - Females - White
Median resident age - Females - Black or African American
Median resident age - Females - Asian
Median resident age - Females - Hispanic or Latino
Median resident age - Females - American Indian and Alaska Native
Median resident age - Females - Multirace
Median resident age - Females - Other Race
Commute - mean travel time to work (minutes)
Travel time to work - Less than 5 minutes (%)
Travel time to work - Less than 5 minutes (% change since 2000)
Travel time to work - 5 to 9 minutes (%)
Travel time to work - 5 to 9 minutes (% change since 2000)
Travel time to work - 10 to 19 minutes (%)
Travel time to work - 10 to 19 minutes (% change since 2000)
Travel time to work - 20 to 29 minutes (%)
Travel time to work - 20 to 29 minutes (% change since 2000)
Travel time to work - 30 to 39 minutes (%)
Travel time to work - 30 to 39 minutes (% change since 2000)
Travel time to work - 40 to 59 minutes (%)
Travel time to work - 40 to 59 minutes (% change since 2000)
Travel time to work - 60 to 89 minutes (%)
Travel time to work - 60 to 89 minutes (% change since 2000)
Travel time to work - 90 or more minutes (%)
Travel time to work - 90 or more minutes (% change since 2000)
Marital status - Never married (%)
Marital status - Now married (%)
Marital status - Separated (%)
Marital status - Widowed (%)
Marital status - Divorced (%)
Median family income ($)
Median family income (% change since 2000)
Median non-family income ($)
Median non-family income (% change since 2000)
Median per capita income ($)
Median per capita income (% change since 2000)
Median family income ($) - White
Median family income ($) - Black or African American
Median family income ($) - Asian
Median family income ($) - Hispanic or Latino
Median family income ($) - American Indian and Alaska Native
Median family income ($) - Multirace
Median family income ($) - Other Race
Median year house/condo built
Median year apartment built
Year house built - Built 2005 or later (%)
Year house built - Built 2000 to 2004 (%)
Year house built - Built 1990 to 1999 (%)
Year house built - Built 1980 to 1989 (%)
Year house built - Built 1970 to 1979 (%)
Year house built - Built 1960 to 1969 (%)
Year house built - Built 1950 to 1959 (%)
Year house built - Built 1940 to 1949 (%)
Year house built - Built 1939 or earlier (%)
Average household size
Household density (households per square mile)
Average household size - White
Average household size - Black or African American
Average household size - Asian
Average household size - Hispanic or Latino
Average household size - American Indian and Alaska Native
Average household size - Multirace
Average household size - Other Race
Occupied housing units (%)
Vacant housing units (%)
Owner occupied housing units (%)
Renter occupied housing units (%)
Vacancy status - For rent (%)
Vacancy status - For sale only (%)
Vacancy status - Rented or sold, not occupied (%)
Vacancy status - For seasonal, recreational, or occasional use (%)
Vacancy status - For migrant workers (%)
Vacancy status - Other vacant (%)
Residents with income below the poverty level (%)
Residents with income below 50% of the poverty level (%)
Children below poverty level (%)
Poor families by family type - Married-couple family (%)
Poor families by family type - Male, no wife present (%)
Poor families by family type - Female, no husband present (%)
Poverty status for native-born residents (%)
Poverty status for foreign-born residents (%)
Poverty among high school graduates not in families (%)
Poverty among people who did not graduate high school not in families (%)
Residents with income below the poverty level (%) - White
Residents with income below the poverty level (%) - Black or African American
Residents with income below the poverty level (%) - Asian
Residents with income below the poverty level (%) - Hispanic or Latino
Residents with income below the poverty level (%) - American Indian and Alaska Native
Residents with income below the poverty level (%) - Multirace
Residents with income below the poverty level (%) - Other Race
Air pollution - Air Quality Index (AQI)
Air pollution - CO
Air pollution - NO2
Air pollution - SO2
Air pollution - Ozone
Air pollution - PM10
Air pollution - PM25
Air pollution - Pb
Crime - Murders per 100,000 population
Crime - Rapes per 100,000 population
Crime - Robberies per 100,000 population
Crime - Assaults per 100,000 population
Crime - Burglaries per 100,000 population
Crime - Thefts per 100,000 population
Crime - Auto thefts per 100,000 population
Crime - Arson per 100,000 population
Crime - City-data.com crime index
Crime - Violent crime index
Crime - Property crime index
Crime - Murders per 100,000 population (5 year average)
Crime - Rapes per 100,000 population (5 year average)
Crime - Robberies per 100,000 population (5 year average)
Crime - Assaults per 100,000 population (5 year average)
Crime - Burglaries per 100,000 population (5 year average)
Crime - Thefts per 100,000 population (5 year average)
Crime - Auto thefts per 100,000 population (5 year average)
Crime - Arson per 100,000 population (5 year average)
Crime - City-data.com crime index (5 year average)
Crime - Violent crime index (5 year average)
Crime - Property crime index (5 year average)
1996 Presidential Elections Results (%) - Democratic Party (Clinton)
1996 Presidential Elections Results (%) - Republican Party (Dole)
1996 Presidential Elections Results (%) - Other
2000 Presidential Elections Results (%) - Democratic Party (Gore)
2000 Presidential Elections Results (%) - Republican Party (Bush)
2000 Presidential Elections Results (%) - Other
2004 Presidential Elections Results (%) - Democratic Party (Kerry)
2004 Presidential Elections Results (%) - Republican Party (Bush)
2004 Presidential Elections Results (%) - Other
2008 Presidential Elections Results (%) - Democratic Party (Obama)
2008 Presidential Elections Results (%) - Republican Party (McCain)
2008 Presidential Elections Results (%) - Other
2012 Presidential Elections Results (%) - Democratic Party (Obama)
2012 Presidential Elections Results (%) - Republican Party (Romney)
2012 Presidential Elections Results (%) - Other
2016 Presidential Elections Results (%) - Democratic Party (Clinton)
2016 Presidential Elections Results (%) - Republican Party (Trump)
2016 Presidential Elections Results (%) - Other
2020 Presidential Elections Results (%) - Democratic Party (Biden)
2020 Presidential Elections Results (%) - Republican Party (Trump)
2020 Presidential Elections Results (%) - Other
Ancestries Reported - Arab (%)
Ancestries Reported - Czech (%)
Ancestries Reported - Danish (%)
Ancestries Reported - Dutch (%)
Ancestries Reported - English (%)
Ancestries Reported - French (%)
Ancestries Reported - French Canadian (%)
Ancestries Reported - German (%)
Ancestries Reported - Greek (%)
Ancestries Reported - Hungarian (%)
Ancestries Reported - Irish (%)
Ancestries Reported - Italian (%)
Ancestries Reported - Lithuanian (%)
Ancestries Reported - Norwegian (%)
Ancestries Reported - Polish (%)
Ancestries Reported - Portuguese (%)
Ancestries Reported - Russian (%)
Ancestries Reported - Scotch-Irish (%)
Ancestries Reported - Scottish (%)
Ancestries Reported - Slovak (%)
Ancestries Reported - Subsaharan African (%)
Ancestries Reported - Swedish (%)
Ancestries Reported - Swiss (%)
Ancestries Reported - Ukrainian (%)
Ancestries Reported - United States (%)
Ancestries Reported - Welsh (%)
Ancestries Reported - West Indian (%)
Ancestries Reported - Other (%)
Educational Attainment - No schooling completed (%)
Educational Attainment - Less than high school (%)
Educational Attainment - High school or equivalent (%)
Educational Attainment - Less than 1 year of college (%)
Educational Attainment - 1 or more years of college (%)
Educational Attainment - Associate degree (%)
Educational Attainment - Bachelor's degree (%)
Educational Attainment - Master's degree (%)
Educational Attainment - Professional school degree (%)
Educational Attainment - Doctorate degree (%)
School Enrollment - Nursery, preschool (%)
School Enrollment - Kindergarten (%)
School Enrollment - Grade 1 to 4 (%)
School Enrollment - Grade 5 to 8 (%)
School Enrollment - Grade 9 to 12 (%)
School Enrollment - College undergrad (%)
School Enrollment - Graduate or professional (%)
School Enrollment - Not enrolled in school (%)
School enrollment - Public schools (%)
School enrollment - Private schools (%)
School enrollment - Not enrolled (%)
Median number of rooms in houses and condos
Median number of rooms in apartments
Housing units lacking complete plumbing facilities (%)
Housing units lacking complete kitchen facilities (%)
Density of houses
Urban houses (%)
Rural houses (%)
Households with people 60 years and over (%)
Households with people 65 years and over (%)
Households with people 75 years and over (%)
Households with one or more nonrelatives (%)
Households with no nonrelatives (%)
Population in households (%)
Family households (%)
Nonfamily households (%)
Population in families (%)
Family households with own children (%)
Median number of bedrooms in owner occupied houses
Mean number of bedrooms in owner occupied houses
Median number of bedrooms in renter occupied houses
Mean number of bedrooms in renter occupied houses
Median number of vehichles in owner occupied houses
Mean number of vehichles in owner occupied houses
Median number of vehichles in renter occupied houses
Mean number of vehichles in renter occupied houses
Mortgage status - with mortgage (%)
Mortgage status - with second mortgage (%)
Mortgage status - with home equity loan (%)
Mortgage status - with both second mortgage and home equity loan (%)
Mortgage status - without a mortgage (%)
Average family size
Average family size - White
Average family size - Black or African American
Average family size - Asian
Average family size - Hispanic or Latino
Average family size - American Indian and Alaska Native
Average family size - Multirace
Average family size - Other Race
Geographical mobility - Same house 1 year ago (%)
Geographical mobility - Moved within same county (%)
Geographical mobility - Moved from different county within same state (%)
Geographical mobility - Moved from different state (%)
Geographical mobility - Moved from abroad (%)
Place of birth - Born in state of residence (%)
Place of birth - Born in other state (%)
Place of birth - Native, outside of US (%)
Place of birth - Foreign born (%)
Housing units in structures - 1, detached (%)
Housing units in structures - 1, attached (%)
Housing units in structures - 2 (%)
Housing units in structures - 3 or 4 (%)
Housing units in structures - 5 to 9 (%)
Housing units in structures - 10 to 19 (%)
Housing units in structures - 20 to 49 (%)
Housing units in structures - 50 or more (%)
Housing units in structures - Mobile home (%)
Housing units in structures - Boat, RV, van, etc. (%)
House/condo owner moved in on average (years ago)
Renter moved in on average (years ago)
Year householder moved into unit - Moved in 1999 to March 2000 (%)
Year householder moved into unit - Moved in 1995 to 1998 (%)
Year householder moved into unit - Moved in 1990 to 1994 (%)
Year householder moved into unit - Moved in 1980 to 1989 (%)
Year householder moved into unit - Moved in 1970 to 1979 (%)
Year householder moved into unit - Moved in 1969 or earlier (%)
Means of transportation to work - Drove car alone (%)
Means of transportation to work - Carpooled (%)
Means of transportation to work - Public transportation (%)
Means of transportation to work - Bus or trolley bus (%)
Means of transportation to work - Streetcar or trolley car (%)
Means of transportation to work - Subway or elevated (%)
Means of transportation to work - Railroad (%)
Means of transportation to work - Ferryboat (%)
Means of transportation to work - Taxicab (%)
Means of transportation to work - Motorcycle (%)
Means of transportation to work - Bicycle (%)
Means of transportation to work - Walked (%)
Means of transportation to work - Other means (%)
Working at home (%)
Industry diversity
Most Common Industries - Agriculture, forestry, fishing and hunting, and mining (%)
Most Common Industries - Agriculture, forestry, fishing and hunting (%)
Most Common Industries - Mining, quarrying, and oil and gas extraction (%)
Most Common Industries - Construction (%)
Most Common Industries - Manufacturing (%)
Most Common Industries - Wholesale trade (%)
Most Common Industries - Retail trade (%)
Most Common Industries - Transportation and warehousing, and utilities (%)
Most Common Industries - Transportation and warehousing (%)
Most Common Industries - Utilities (%)
Most Common Industries - Information (%)
Most Common Industries - Finance and insurance, and real estate and rental and leasing (%)
Most Common Industries - Finance and insurance (%)
Most Common Industries - Real estate and rental and leasing (%)
Most Common Industries - Professional, scientific, and management, and administrative and waste management services (%)
Most Common Industries - Professional, scientific, and technical services (%)
Most Common Industries - Management of companies and enterprises (%)
Most Common Industries - Administrative and support and waste management services (%)
Most Common Industries - Educational services, and health care and social assistance (%)
Most Common Industries - Educational services (%)
Most Common Industries - Health care and social assistance (%)
Most Common Industries - Arts, entertainment, and recreation, and accommodation and food services (%)
Most Common Industries - Arts, entertainment, and recreation (%)
Most Common Industries - Accommodation and food services (%)
Most Common Industries - Other services, except public administration (%)
Most Common Industries - Public administration (%)
Occupation diversity
Most Common Occupations - Management, business, science, and arts occupations (%)
Most Common Occupations - Management, business, and financial occupations (%)
Most Common Occupations - Management occupations (%)
Most Common Occupations - Business and financial operations occupations (%)
Most Common Occupations - Computer, engineering, and science occupations (%)
Most Common Occupations - Computer and mathematical occupations (%)
Most Common Occupations - Architecture and engineering occupations (%)
Most Common Occupations - Life, physical, and social science occupations (%)
Most Common Occupations - Education, legal, community service, arts, and media occupations (%)
Most Common Occupations - Community and social service occupations (%)
Most Common Occupations - Legal occupations (%)
Most Common Occupations - Education, training, and library occupations (%)
Most Common Occupations - Arts, design, entertainment, sports, and media occupations (%)
Most Common Occupations - Healthcare practitioners and technical occupations (%)
Most Common Occupations - Health diagnosing and treating practitioners and other technical occupations (%)
Most Common Occupations - Health technologists and technicians (%)
Most Common Occupations - Service occupations (%)
Most Common Occupations - Healthcare support occupations (%)
Most Common Occupations - Protective service occupations (%)
Most Common Occupations - Fire fighting and prevention, and other protective service workers including supervisors (%)
Most Common Occupations - Law enforcement workers including supervisors (%)
Most Common Occupations - Food preparation and serving related occupations (%)
Most Common Occupations - Building and grounds cleaning and maintenance occupations (%)
Most Common Occupations - Personal care and service occupations (%)
Most Common Occupations - Sales and office occupations (%)
Most Common Occupations - Sales and related occupations (%)
Most Common Occupations - Office and administrative support occupations (%)
Most Common Occupations - Natural resources, construction, and maintenance occupations (%)
Most Common Occupations - Farming, fishing, and forestry occupations (%)
Most Common Occupations - Construction and extraction occupations (%)
Most Common Occupations - Installation, maintenance, and repair occupations (%)
Most Common Occupations - Production, transportation, and material moving occupations (%)
Most Common Occupations - Production occupations (%)
Most Common Occupations - Transportation occupations (%)
Most Common Occupations - Material moving occupations (%)
People in Group quarters - Institutionalized population (%)
People in Group quarters - Correctional institutions (%)
People in Group quarters - Federal prisons and detention centers (%)
People in Group quarters - Halfway houses (%)
People in Group quarters - Local jails and other confinement facilities (including police lockups) (%)
People in Group quarters - Military disciplinary barracks (%)
People in Group quarters - State prisons (%)
People in Group quarters - Other types of correctional institutions (%)
People in Group quarters - Nursing homes (%)
People in Group quarters - Hospitals/wards, hospices, and schools for the handicapped (%)
People in Group quarters - Hospitals/wards and hospices for chronically ill (%)
People in Group quarters - Hospices or homes for chronically ill (%)
People in Group quarters - Military hospitals or wards for chronically ill (%)
People in Group quarters - Other hospitals or wards for chronically ill (%)
People in Group quarters - Hospitals or wards for drug/alcohol abuse (%)
People in Group quarters - Mental (Psychiatric) hospitals or wards (%)
People in Group quarters - Schools, hospitals, or wards for the mentally retarded (%)
People in Group quarters - Schools, hospitals, or wards for the physically handicapped (%)
People in Group quarters - Institutions for the deaf (%)
People in Group quarters - Institutions for the blind (%)
People in Group quarters - Orthopedic wards and institutions for the physically handicapped (%)
People in Group quarters - Wards in general hospitals for patients who have no usual home elsewhere (%)
People in Group quarters - Wards in military hospitals for patients who have no usual home elsewhere (%)
People in Group quarters - Juvenile institutions (%)
People in Group quarters - Long-term care (%)
People in Group quarters - Homes for abused, dependent, and neglected children (%)
People in Group quarters - Residential treatment centers for emotionally disturbed children (%)
People in Group quarters - Training schools for juvenile delinquents (%)
People in Group quarters - Short-term care, detention or diagnostic centers for delinquent children (%)
People in Group quarters - Type of juvenile institution unknown (%)
People in Group quarters - Noninstitutionalized population (%)
People in Group quarters - College dormitories (includes college quarters off campus) (%)
People in Group quarters - Military quarters (%)
People in Group quarters - On base (%)
People in Group quarters - Barracks, unaccompanied personnel housing (UPH), (Enlisted/Officer), ;and similar group living quarters for military personnel (%)
People in Group quarters - Transient quarters for temporary residents (%)
People in Group quarters - Military ships (%)
People in Group quarters - Group homes (%)
People in Group quarters - Homes or halfway houses for drug/alcohol abuse (%)
People in Group quarters - Homes for the mentally ill (%)
People in Group quarters - Homes for the mentally retarded (%)
People in Group quarters - Homes for the physically handicapped (%)
People in Group quarters - Other group homes (%)
People in Group quarters - Religious group quarters (%)
People in Group quarters - Dormitories (%)
People in Group quarters - Agriculture workers' dormitories on farms (%)
People in Group quarters - Job Corps and vocational training facilities (%)
People in Group quarters - Other workers' dormitories (%)
People in Group quarters - Crews of maritime vessels (%)
People in Group quarters - Other nonhousehold living situations (%)
People in Group quarters - Other noninstitutional group quarters (%)
Residents speaking English at home (%)
Residents speaking English at home - Born in the United States (%)
Residents speaking English at home - Native, born elsewhere (%)
Residents speaking English at home - Foreign born (%)
Residents speaking Spanish at home (%)
Residents speaking Spanish at home - Born in the United States (%)
Residents speaking Spanish at home - Native, born elsewhere (%)
Residents speaking Spanish at home - Foreign born (%)
Residents speaking other language at home (%)
Residents speaking other language at home - Born in the United States (%)
Residents speaking other language at home - Native, born elsewhere (%)
Residents speaking other language at home - Foreign born (%)
Class of Workers - Employee of private company (%)
Class of Workers - Self-employed in own incorporated business (%)
Class of Workers - Private not-for-profit wage and salary workers (%)
Class of Workers - Local government workers (%)
Class of Workers - State government workers (%)
Class of Workers - Federal government workers (%)
Class of Workers - Self-employed workers in own not incorporated business and Unpaid family workers (%)
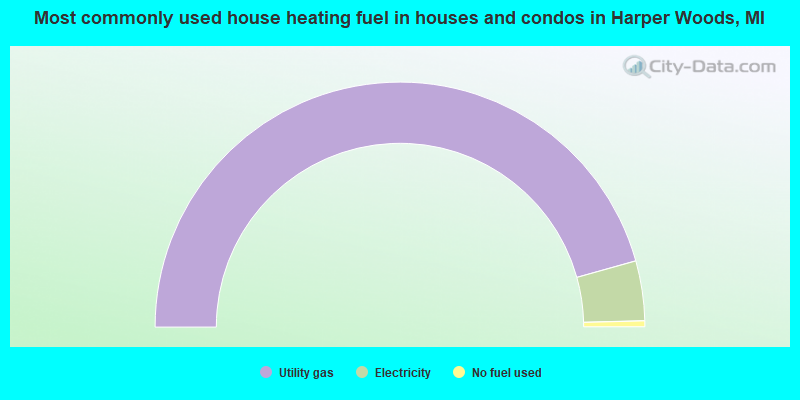
House heating fuel used in houses and condos - Utility gas (%)
House heating fuel used in houses and condos - Bottled, tank, or LP gas (%)
House heating fuel used in houses and condos - Electricity (%)
House heating fuel used in houses and condos - Fuel oil, kerosene, etc. (%)
House heating fuel used in houses and condos - Coal or coke (%)
House heating fuel used in houses and condos - Wood (%)
House heating fuel used in houses and condos - Solar energy (%)
House heating fuel used in houses and condos - Other fuel (%)
House heating fuel used in houses and condos - No fuel used (%)
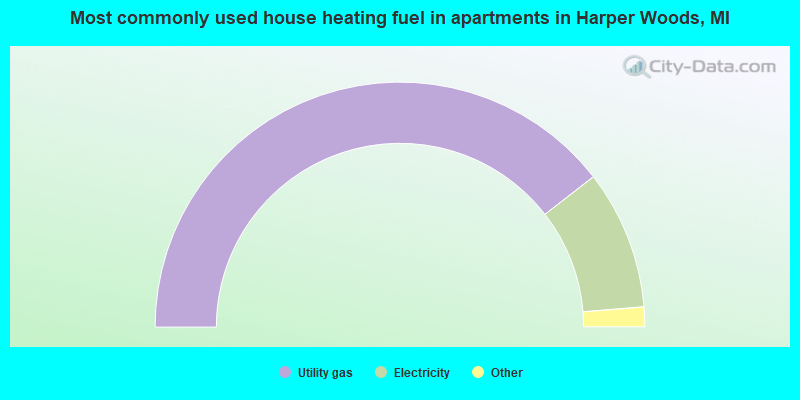
House heating fuel used in apartments - Utility gas (%)
House heating fuel used in apartments - Bottled, tank, or LP gas (%)
House heating fuel used in apartments - Electricity (%)
House heating fuel used in apartments - Fuel oil, kerosene, etc. (%)
House heating fuel used in apartments - Coal or coke (%)
House heating fuel used in apartments - Wood (%)
House heating fuel used in apartments - Solar energy (%)
House heating fuel used in apartments - Other fuel (%)
House heating fuel used in apartments - No fuel used (%)
Armed forces status - In Armed Forces (%)
Armed forces status - Civilian (%)
Armed forces status - Civilian - Veteran (%)
Armed forces status - Civilian - Nonveteran (%)
Fatal accidents locations in years 2005-2021
Fatal accidents locations in 2005
Fatal accidents locations in 2006
Fatal accidents locations in 2007
Fatal accidents locations in 2008
Fatal accidents locations in 2009
Fatal accidents locations in 2010
Fatal accidents locations in 2011
Fatal accidents locations in 2012
Fatal accidents locations in 2013
Fatal accidents locations in 2014
Fatal accidents locations in 2015
Fatal accidents locations in 2016
Fatal accidents locations in 2017
Fatal accidents locations in 2018
Fatal accidents locations in 2019
Fatal accidents locations in 2020
Fatal accidents locations in 2021
Alcohol use - People drinking some alcohol every month (%)
Alcohol use - People not drinking at all (%)
Alcohol use - Average days/month drinking alcohol
Alcohol use - Average drinks/week
Alcohol use - Average days/year people drink much
Audiometry - Average condition of hearing (%)
Audiometry - People that can hear a whisper from across a quiet room (%)
Audiometry - People that can hear normal voice from across a quiet room (%)
Audiometry - Ears ringing, roaring, buzzing (%)
Audiometry - Had a job exposure to loud noise (%)
Audiometry - Had off-work exposure to loud noise (%)
Blood Pressure & Cholesterol - Has high blood pressure (%)
Blood Pressure & Cholesterol - Checking blood pressure at home (%)
Blood Pressure & Cholesterol - Frequently checking blood cholesterol (%)
Blood Pressure & Cholesterol - Has high cholesterol level (%)
Consumer Behavior - Money monthly spent on food at supermarket/grocery store
Consumer Behavior - Money monthly spent on food at other stores
Consumer Behavior - Money monthly spent on eating out
Consumer Behavior - Money monthly spent on carryout/delivered foods
Consumer Behavior - Income spent on food at supermarket/grocery store (%)
Consumer Behavior - Income spent on food at other stores (%)
Consumer Behavior - Income spent on eating out (%)
Consumer Behavior - Income spent on carryout/delivered foods (%)
Current Health Status - General health condition (%)
Current Health Status - Blood donors (%)
Current Health Status - Has blood ever tested for HIV virus (%)
Current Health Status - Left-handed people (%)
Dermatology - People using sunscreen (%)
Diabetes - Diabetics (%)
Diabetes - Had a blood test for high blood sugar (%)
Diabetes - People taking insulin (%)
Diet Behavior & Nutrition - Diet health (%)
Diet Behavior & Nutrition - Milk product consumption (# of products/month)
Diet Behavior & Nutrition - Meals not home prepared (#/week)
Diet Behavior & Nutrition - Meals from fast food or pizza place (#/week)
Diet Behavior & Nutrition - Ready-to-eat foods (#/month)
Diet Behavior & Nutrition - Frozen meals/pizza (#/month)
Drug Use - People that ever used marijuana or hashish (%)
Drug Use - Ever used hard drugs (%)
Drug Use - Ever used any form of cocaine (%)
Drug Use - Ever used heroin (%)
Drug Use - Ever used methamphetamine (%)
Health Insurance - People covered by health insurance (%)
Kidney Conditions-Urology - Avg. # of times urinating at night
Medical Conditions - People with asthma (%)
Medical Conditions - People with anemia (%)
Medical Conditions - People with psoriasis (%)
Medical Conditions - People with overweight (%)
Medical Conditions - Elderly people having difficulties in thinking or remembering (%)
Medical Conditions - People who ever received blood transfusion (%)
Medical Conditions - People having trouble seeing even with glass/contacts (%)
Medical Conditions - People with arthritis (%)
Medical Conditions - People with gout (%)
Medical Conditions - People with congestive heart failure (%)
Medical Conditions - People with coronary heart disease (%)
Medical Conditions - People with angina pectoris (%)
Medical Conditions - People who ever had heart attack (%)
Medical Conditions - People who ever had stroke (%)
Medical Conditions - People with emphysema (%)
Medical Conditions - People with thyroid problem (%)
Medical Conditions - People with chronic bronchitis (%)
Medical Conditions - People with any liver condition (%)
Medical Conditions - People who ever had cancer or malignancy (%)
Mental Health - People who have little interest in doing things (%)
Mental Health - People feeling down, depressed, or hopeless (%)
Mental Health - People who have trouble sleeping or sleeping too much (%)
Mental Health - People feeling tired or having little energy (%)
Mental Health - People with poor appetite or overeating (%)
Mental Health - People feeling bad about themself (%)
Mental Health - People who have trouble concentrating on things (%)
Mental Health - People moving or speaking slowly or too fast (%)
Mental Health - People having thoughts they would be better off dead (%)
Oral Health - Average years since last visit a dentist
Oral Health - People embarrassed because of mouth (%)
Oral Health - People with gum disease (%)
Oral Health - General health of teeth and gums (%)
Oral Health - Average days a week using dental floss/device
Oral Health - Average days a week using mouthwash for dental problem
Oral Health - Average number of teeth
Pesticide Use - Households using pesticides to control insects (%)
Pesticide Use - Households using pesticides to kill weeds (%)
Physical Activity - People doing vigorous-intensity work activities (%)
Physical Activity - People doing moderate-intensity work activities (%)
Physical Activity - People walking or bicycling (%)
Physical Activity - People doing vigorous-intensity recreational activities (%)
Physical Activity - People doing moderate-intensity recreational activities (%)
Physical Activity - Average hours a day doing sedentary activities
Physical Activity - Average hours a day watching TV or videos
Physical Activity - Average hours a day using computer
Physical Functioning - People having limitations keeping them from working (%)
Physical Functioning - People limited in amount of work they can do (%)
Physical Functioning - People that need special equipment to walk (%)
Physical Functioning - People experiencing confusion/memory problems (%)
Physical Functioning - People requiring special healthcare equipment (%)
Prescription Medications - Average number of prescription medicines taking
Preventive Aspirin Use - Adults 40+ taking low-dose aspirin (%)
Reproductive Health - Vaginal deliveries (%)
Reproductive Health - Cesarean deliveries (%)
Reproductive Health - Deliveries resulted in a live birth (%)
Reproductive Health - Pregnancies resulted in a delivery (%)
Reproductive Health - Women breastfeeding newborns (%)
Reproductive Health - Women that had a hysterectomy (%)
Reproductive Health - Women that had both ovaries removed (%)
Reproductive Health - Women that have ever taken birth control pills (%)
Reproductive Health - Women taking birth control pills (%)
Reproductive Health - Women that have ever used Depo-Provera or injectables (%)
Reproductive Health - Women that have ever used female hormones (%)
Sexual Behavior - People 18+ that ever had sex (vaginal, anal, or oral) (%)
Sexual Behavior - Males 18+ that ever had vaginal sex with a woman (%)
Sexual Behavior - Males 18+ that ever performed oral sex on a woman (%)
Sexual Behavior - Males 18+ that ever had anal sex with a woman (%)
Sexual Behavior - Males 18+ that ever had any sex with a man (%)
Sexual Behavior - Females 18+ that ever had vaginal sex with a man (%)
Sexual Behavior - Females 18+ that ever performed oral sex on a man (%)
Sexual Behavior - Females 18+ that ever had anal sex with a man (%)
Sexual Behavior - Females 18+ that ever had any kind of sex with a woman (%)
Sexual Behavior - Average age people first had sex
Sexual Behavior - Average number of female sex partners in lifetime (males 18+)
Sexual Behavior - Average number of female vaginal sex partners in lifetime (males 18+)
Sexual Behavior - Average age people first performed oral sex on a woman (18+)
Sexual Behavior - Average number of woman performed oral sex on in lifetime (18+)
Sexual Behavior - Average number of male sex partners in lifetime (males 18+)
Sexual Behavior - Average number of male anal sex partners in lifetime (males 18+)
Sexual Behavior - Average age people first performed oral sex on a man (18+)
Sexual Behavior - Average number of male oral sex partners in lifetime (18+)
Sexual Behavior - People using protection when performing oral sex (%)
Sexual Behavior - Average number of times people have vaginal or anal sex a year
Sexual Behavior - People having sex without condom (%)
Sexual Behavior - Average number of male sex partners in lifetime (females 18+)
Sexual Behavior - Average number of male vaginal sex partners in lifetime (females 18+)
Sexual Behavior - Average number of female sex partners in lifetime (females 18+)
Sexual Behavior - Circumcised males 18+ (%)
Sleep Disorders - Average hours sleeping at night
Sleep Disorders - People that has trouble sleeping (%)
Smoking-Cigarette Use - People smoking cigarettes (%)
Taste & Smell - People 40+ having problems with smell (%)
Taste & Smell - People 40+ having problems with taste (%)
Taste & Smell - People 40+ that ever had wisdom teeth removed (%)
Taste & Smell - People 40+ that ever had tonsils teeth removed (%)
Taste & Smell - People 40+ that ever had a loss of consciousness because of a head injury (%)
Taste & Smell - People 40+ that ever had a broken nose or other serious injury to face or skull (%)
Taste & Smell - People 40+ that ever had two or more sinus infections (%)
Weight - Average height (inches)
Weight - Average weight (pounds)
Weight - Average BMI
Weight - People that are obese (%)
Weight - People that ever were obese (%)
Weight - People trying to lose weight (%)
According to our research of Michigan and other state lists, there were 28 registered sex offenders living in Harper Woods, Michigan as of April 28, 2024 . The ratio of all residents to sex offenders in Harper Woods is 491 to 1.The ratio of registered sex offenders to all residents in this city is lower than the state average.
Officers per 1,000 residents here:
1.91Michigan average:
1.86
Latest news from Harper Woods, MI collected exclusively by city-data.com from local newspapers, TV, and radio stations
Ancestries: Italian (3.2%), German (3.0%), Polish (2.2%), Lebanese (2.0%), English (1.6%).
Current Local Time:
Land area: 2.58 square miles.
Population density: 5,875 people per square mile (average).
361 residents are foreign born (1.4% Asia , 0.4% Europe ).
This city:
2.4%Michigan:
6.9%
Median real estate property taxes paid for housing units with mortgages in 2022: $3,321 (2.1%)Median real estate property taxes paid for housing units with no mortgage in 2022: $3,013 (2.0%)
Nearest city with pop. 50,000+: St. Clair Shores, MI
Nearest city with pop. 200,000+: Detroit, MI
Nearest city with pop. 1,000,000+: Chicago, IL
Nearest cities:
Latitude: 42.44 N, Longitude: 82.92 W
Daytime population change due to commuting: -3,864 (-25.6%)Workers who live and work in this city: 821 (11.8%)
Harper Woods tourist attractions:
Single-family new house construction building permits:
2022: 1 building , cost: $311,7002021: 1 building , cost: $285,0002019: 1 building , cost: $138,0002014: 1 building , cost: $112,6002005: 2 buildings , average cost: $173,800Unemployment in December 2023:
Most common occupations in Harper Woods, MI (%)
Both Males Females
Other management occupations, except farmers and farm managers (4.5%)
Secretaries and administrative assistants (4.2%)
Other office and administrative support workers, including supervisors (4.0%)
Other sales and related occupations, including supervisors (3.6%)
Preschool, kindergarten, elementary, and middle school teachers (3.6%)
Sales representatives, services, wholesale and manufacturing (3.2%)
Other production occupations, including supervisors (3.1%)
Other management occupations, except farmers and farm managers (5.0%)
Metal workers and plastic workers (4.7%)
Other production occupations, including supervisors (4.6%)
Sales representatives, services, wholesale and manufacturing (3.9%)
Driver/sales workers and truck drivers (3.7%)
Engineers (3.1%)
Computer specialists (3.1%)
Secretaries and administrative assistants (8.4%)
Registered nurses (5.6%)
Other office and administrative support workers, including supervisors (5.6%)
Preschool, kindergarten, elementary, and middle school teachers (5.1%)
Other sales and related occupations, including supervisors (4.5%)
Other management occupations, except farmers and farm managers (4.0%)
Retail sales workers, except cashiers (3.4%)
Tornado activity:
Harper Woods-area historical tornado activity is slightly above Michigan state average. It is 14% greater than the overall U.S. average.
On 7/4/1957, a category F4 (max. wind speeds 207-260 mph) tornado 11.5 miles away from the Harper Woods city center injured 6 people and caused between $50,000 and $500,000 in damages.
On 5/8/1964, a category F4 tornado 16.8 miles away from the city center killed 11 people and injured 224 people and caused between $500,000 and $5,000,000 in damages.
Earthquake activity:
Harper Woods-area historical earthquake activity is significantly above Michigan state average. It is 49% smaller than the overall U.S. average. On 9/25/1998 at 19:52:52, a magnitude 5.2 (4.8 MB, 4.3 MS, 5.2 LG, 4.5 MW, Depth: 3.1 mi, Class: Moderate, Intensity: VI - VII) earthquake occurred 145.6 miles away from the city center On 1/31/1986 at 16:46:43, a magnitude 5.0 (5.0 MB) earthquake occurred 107.6 miles away from Harper Woods center On 7/12/1986 at 08:19:37, a magnitude 4.5 (4.5 MB, Class: Light, Intensity: IV - V) earthquake occurred 151.3 miles away from the city center On 7/27/1980 at 18:52:21, a magnitude 5.2 (5.1 MB, 4.7 MS, 5.0 UK, 5.2 UK) earthquake occurred 297.7 miles away from Harper Woods center On 8/23/2011 at 17:51:04, a magnitude 5.8 (5.8 MW, Depth: 3.7 mi) earthquake occurred 409.2 miles away from Harper Woods center On 5/2/2015 at 16:23:07, a magnitude 4.2 (4.2 MW, Depth: 2.8 mi) earthquake occurred 128.8 miles away from Harper Woods center Magnitude types: regional Lg-wave magnitude (LG), body-wave magnitude (MB), surface-wave magnitude (MS), moment magnitude (MW) Natural disasters: The number of natural disasters in Wayne County (14) is near the US average (15).Major Disasters (Presidential) Declared: 9Emergencies Declared: 4Storms: 9, Floods: 7, Tornadoes: 3, Blizzard: 1, Hurricane: 1, Power Outage: 1, Snowstorm: 1, Winter Storm: 1, Other: 1 (Note: some incidents may be assigned to more than one category). Hospitals and medical centers in Harper Woods: FAMILY FIRST HOME CARE, L L C (19959 VERNIER RD, SUITE 1A)
FUSION HOME HEALTH CARE AGENCY (20390 HARPER AVENUE)
HENRY FORD CONT CARE CTR-BELMO (19840 HARPER AVE)
Amtrak stations near Harper Woods: 9 miles: WINDSOR (298 WALKER RD.) Services: ticket office.
9 miles: DETROIT (11 W. BALTIMORE AVE.) Services: ticket office, partially wheelchair accessible, enclosed waiting area, public restrooms, public payphones, free short-term parking, call for car rental service, taxi stand, public transit connection.
12 miles: ROYAL OAK (201 S. SHERMAN DR.) Services: enclosed waiting area, public payphones, vending machines, paid short-term parking, taxi stand, intercity bus service, public transit connection.
Colleges/universities with over 2000 students nearest to Harper Woods:
Macomb Community College (about 6 miles; Warren, MI ; Full-time enrollment: 15,669)
Baker College of Clinton Township (about 9 miles; Clinton Township, MI ; FT enrollment: 3,413)
Wayne State University (about 10 miles; Detroit, MI ; FT enrollment: 20,204)
Wayne County Community College District (about 11 miles; Detroit, MI ; FT enrollment: 10,554)
University of Detroit Mercy (about 11 miles; Detroit, MI ; FT enrollment: 3,406)
Lawrence Technological University (about 17 miles; Southfield, MI ; FT enrollment: 2,430)
University of Michigan-Dearborn (about 18 miles; Dearborn, MI ; FT enrollment: 6,712)
Public high schools in Harper Woods: CHANDLER PARK ACADEMY - HIGH SCHOOL Location: 20254 KELLY ROAD, Grades: 9-12, Charter school )
HARPER WOODS HIGH SCHOOL Location: 20225 BEACONSFIELD ST, Grades: 9-12)
HARPER ACADEMY Location: 20225 BEACONSFIELD, Grades: 7-12)
DIPLOMA SUCCESS COMMUNITY SCHOOL Location: 19344 KELLY, Grades: 9-12)
HARPER WOODS VIRTUAL ACADEMY Location: 19344 KELLY RD, Grades: 6-12)
Public elementary/middle schools in Harper Woods: CHANDLER PARK ACADEMY - MIDDLE SCHOOL Students: 946, Location: 20100 KELLY RD, Grades: 6-8, Charter school )CHARLES A. POUPARD ELEM. SCHOOL Students: 357, Location: 20655 LENNON ST, Grades: KG-5)BEACON ELEMENTARY SCHOOL Students: 355, Location: 19475 BEACONSFIELD ST, Grades: PK-3)TYRONE ELEMENTARY SCHOOL Students: 294, Location: 19525 TYRONE ST, Grades: 4-6)CHANDLER PARK ACADEMY - ELEMENTARY Location: 20200 KELLY RD, Grades: PK-5, Charter school )
STARR DETROIT ACADEMY Location: 19360 HARPER AVE, Grades: KG-7, Charter school )
HARPER WOODS MIDDLE SCHOOL Location: 20225 BEACONSFIELD ST, Grades: 7-8)
See full list of schools located in Harper Woods Library in Harper Woods: HARPER WOODS PUBLIC LIBRARY Operating income: $485,087; Location: 19601 HARPER AVENUE; 45,425 books ; 1,330 audio materials ; 3,260 video materials ; 2 local licensed databases ; 2 other licensed databases ; 63 print serial subscriptions ; 48 electronic serial subscriptions )
Birthplace of: James Douglas - College basketball player (Missouri Tigers), Michael Bramos - College basketball player (Miami (OHIO) RedHawks).
Wayne County has a predicted average indoor radon screening level less than 2 pCi/L (pico curies per liter) - Low Potential Average household size: This city:
2.4 peopleMichigan:
2.5 people
Percentage of family households: This city:
62.1%Whole state:
66.0%
Percentage of households with unmarried partners: This city:
5.7%Whole state:
6.4%
Likely homosexual households (counted as self-reported same-sex unmarried-partner households)
Lesbian couples: 0.4% of all households Gay men: 0.2% of all households
People in group quarters in Harper Woods in 2010:
146 people in nursing facilities/skilled-nursing facilities
31 people in group homes intended for adults
5 people in residential treatment centers for adults
4 people in group homes for juveniles (non-correctional)
2 people in other noninstitutional facilities
People in group quarters in Harper Woods in 2000:
126 people in nursing homes
7 people in other noninstitutional group quarters
6 people in homes for the mentally retarded
4 people in homes for the physically handicapped
3 people in religious group quarters
Banks with branches in Harper Woods (2011 data):
JPMorgan Chase Bank, National Association: Kelly-Woodcrest Branch at 19616 Kelly Road, branch established on 1952/09/16; Vernier-Harper Branch at 20675 Vernier Road, branch established on 1965/06/11. Info updated 2011/11/10: Bank assets: $1,811,678.0 mil, Deposits: $1,190,738.0 mil, headquarters in Columbus, OH, positive income , International Specialization, 5577 total offices , Holding Company: Jpmorgan Chase & Co.
RBS Citizens, National Association: Harper Woods at 19601 Vernier, branch established on 1934/05/01. Info updated 2007/09/19: Bank assets: $106,940.6 mil, Deposits: $75,690.2 mil, headquarters in Providence, RI, positive income , 1135 total offices , Holding Company: Uk Financial Investments Limited
Guaranty Bank: Harper Woods Branch at 19230 Harper, branch established on 2004/06/30. Info updated 2011/07/21: Bank assets: $1,179.1 mil, Deposits: $1,102.7 mil, headquarters in Milwaukee, WI, negative income in the last year , Mortgage Lending Specialization, 166 total offices
For population 15 years and over in Harper Woods:
Never married: 51.8%Now married: 26.6%Separated: 1.1%Widowed: 7.3%Divorced: 13.2% For population 25 years and over in Harper Woods:
High school or higher: 94.1%Bachelor's degree or higher: 26.4%Graduate or professional degree: 9.6%Unemployed: 4.5%Mean travel time to work (commute): 23.5 minutes
Education Gini index (Inequality in education) Here:
8.8Michigan average:
11.0
Religion statistics for Harper Woods, MI (based on Wayne County data)
Religion Adherents Congregations Catholic 297,283 151 Evangelical Protestant 183,985 527 Black Protestant 124,432 282 Mainline Protestant 85,387 231 Other 79,840 116 Orthodox 17,580 23 None 1,032,077 -
Source: Clifford Grammich, Kirk Hadaway, Richard Houseal, Dale E.Jones, Alexei Krindatch, Richie Stanley and Richard H.Taylor. 2012. 2010 U.S.Religion Census: Religious Congregations & Membership Study. Association of Statisticians of American Religious Bodies. Jones, Dale E., et al. 2002. Congregations and Membership in the United States 2000. Nashville, TN: Glenmary Research Center. Graphs represent county-level data
Food Environment Statistics: Number of grocery stores : 556Wayne County :
2.81 / 10,000 pop.Michigan :
2.34 / 10,000 pop.
Number of supercenters and club stores : 18This county :
0.09 / 10,000 pop.Michigan :
0.18 / 10,000 pop.
Number of convenience stores (no gas) : 294Wayne County :
1.48 / 10,000 pop.Michigan :
1.52 / 10,000 pop.
Number of convenience stores (with gas) : 523Here :
2.64 / 10,000 pop.Michigan :
2.99 / 10,000 pop.
Number of full-service restaurants : 1,019This county :
5.14 / 10,000 pop.Michigan :
6.80 / 10,000 pop.
Adult diabetes rate : This county :
11.6%State :
9.7%
Adult obesity rate : This county :
33.2%Michigan :
29.7%
Low-income preschool obesity rate : This county :
12.9%State :
13.4%
Health and Nutrition: Healthy diet rate : Harper Woods:
57.3%Michigan:
50.3%
Average overall health of teeth and gums : Harper Woods:
58.0%Michigan:
47.9%
Average BMI : Harper Woods:
28.0Michigan:
28.7
People feeling badly about themselves : People not drinking alcohol at all : This city:
8.1%Michigan:
10.4%
Average hours sleeping at night : This city:
7.0Michigan:
6.8
Overweight people : Harper Woods:
34.1%Michigan:
34.1%
General health condition : Average condition of hearing : Harper Woods:
81.4%Michigan:
79.6%
More about Health and Nutrition of Harper Woods, MI Residents
Local government employment and payroll (March 2022)
Function
Full-time employees
Monthly full-time payroll
Average yearly full-time wage
Part-time employees
Monthly part-time payroll
Police Protection - Officers
22 $180,458 $98,432 3 $6,532 Other and Unallocable
8 $35,052 $52,578 4 $13,264 Judicial and Legal
7 $25,006 $42,867 4 $8,056 Firefighters
6 $81,125 $162,250 0 $0 Financial Administration
5 $24,472 $58,733 0 $0 Police - Other
5 $18,673 $44,815 16 $14,696 Local Libraries
3 $13,286 $53,144 7 $5,009 Parks and Recreation
3 $12,668 $50,672 5 $4,823 Other Government Administration
2 $15,766 $94,596 0 $0 Housing and Community Development (Local)
2 $11,218 $67,308 0 $0 Correction
1 $4,517 $54,204 0 $0
Totals for Government
64 $422,240 $79,170 39 $52,379
Harper Woods government finances - Expenditure in 2018 (per resident):
Current Operations - General - Other: $6,811,000 ($449.07)
Police Protection: $3,431,000 ($226.21)Sewerage: $2,137,000 ($140.90)Water Utilities: $1,910,000 ($125.93)Regular Highways: $1,876,000 ($123.69)Solid Waste Management: $850,000 ($56.04)Local Fire Protection: $775,000 ($51.10)Financial Administration: $584,000 ($38.50)Judicial and Legal Services: $514,000 ($33.89)Libraries: $439,000 ($28.94)Parks and Recreation: $403,000 ($26.57)Central Staff Services: $373,000 ($24.59)Protective Inspection and Regulation - Other: $360,000 ($23.74)Correctional Institutions: $192,000 ($12.66)General - Interest on Debt: $170,000 ($11.21)
Other Capital Outlay - Regular Highways: $568,000 ($37.45)
Police Protection: $154,000 ($10.15)General - Other: $135,000 ($8.90)Water Utilities: $71,000 ($4.68)Local Fire Protection: $22,000 ($1.45)Sewerage: $8,000 ($0.53)Total Salaries and Wages: $5,604,000 ($369.49)
Harper Woods government finances - Revenue in 2018 (per resident):
Charges - Sewerage: $2,156,000 ($142.15)
Other: $1,017,000 ($67.05)Solid Waste Management: $400,000 ($26.37)Federal Intergovernmental - Other: $280,000 ($18.46)
Miscellaneous - General Revenue - Other: $2,380,000 ($156.92)
Special Assessments: $1,989,000 ($131.14)Fines and Forfeits: $852,000 ($56.17)Interest Earnings: $30,000 ($1.98)Revenue - Water Utilities: $1,929,000 ($127.18)
State Intergovernmental - General Local Government Support: $1,742,000 ($114.85)
Highways: $1,142,000 ($75.30)Tax - Property: $7,931,000 ($522.91)
Occupation and Business License - Other: $430,000 ($28.35)
Harper Woods government finances - Debt in 2018 (per resident):
Long Term Debt - Beginning Outstanding - Unspecified Public Purpose: $5,731,000 ($377.86)
Outstanding Unspecified Public Purpose: $5,720,000 ($377.13)Retired Unspecified Public Purpose: $427,000 ($28.15)Issue, Unspecified Public Purpose: $416,000 ($27.43)
Harper Woods government finances - Cash and Securities in 2018 (per resident):
Other Funds - Cash and Securities: $6,039,000 ($398.17)
4.12% of this county's 2021 resident taxpayers lived in other counties in 2020 ($55,756 average adjusted gross income )
Here:
4.12%Michigan average:
5.83%
0.01% of residents moved from foreign countries ($67 average AGI )Wayne County:
0.01%Michigan average:
0.00%
Top counties from which taxpayers relocated into this county between 2020 and 2021:
5.14% of this county's 2020 resident taxpayers moved to other counties in 2021 ($70,859 average adjusted gross income )
Here:
5.14%Michigan average:
5.95%
0.00% of residents moved to foreign countries ($38 average AGI )Wayne County:
0.00%Michigan average:
0.00%
Top counties to which taxpayers relocated from this county between 2020 and 2021:
Businesses in Harper Woods, MI
Name Count Name Count
Applebee's 1 Lowe's 1 CVS 1 Macy's 1 Charlotte Russe 1 McDonald's 1 FedEx 2 Motherhood Maternity 1 Finish Line 1 Nike 11 Foot Locker 1 Payless 1 GNC 1 Pier 1 Imports 1 GameStop 1 Sears 2 H&R Block 2 Starbucks 1 Home Depot 1 Subway 2 Jimmy Jazz 1 T-Mobile 1 Jones New York 2 Taco Bell 1 KFC 1 Target 1 Kroger 1 Tim Hortons 1 Lane Furniture 1 UPS 1 LensCrafters 1 Wendy's 1
Strongest AM radio stations in Harper Woods:
WWJ (950 AM; 50 kW; DETROIT, MI; Owner: INFINITY BROADCASTING OPERATIONS, INC.)
WXYT (1270 AM; 50 kW; DETROIT, MI; Owner: INFINITY BROADCASTING CORP. OF DETROIT)
WJR (760 AM; 50 kW; DETROIT, MI; Owner: ABC, INC.)
WDFN (1130 AM; 50 kW; DETROIT, MI; Owner: AMFM RADIO LICENSES, L.L.C.)
WCHB (1200 AM; 50 kW; TAYLOR, MI; Owner: RADIO ONE OF DETROIT, LLC)
WFDF (910 AM; 50 kW; FLINT, MI; Owner: ABC, INC.)
WUFL (1030 AM; daytime; 5 kW; STERLING HEIGHTS, MI; Owner: FAMILY LIFE BROADCASTING SYSTEM)
WXDX (1310 AM; 5 kW; DEARBORN, MI; Owner: AMFM RADIO LICENSES, L.L.C.)
WOAP (1080 AM; 50 kW; OWOSSO, MI)
WEXL (1340 AM; 1 kW; ROYAL OAK, MI; Owner: WMUZ RADIO, INC.)
WQBH (1400 AM; 1 kW; DETROIT, MI; Owner: QUEEN'S BROADCASTING CORP.)
WDEO (990 AM; 9 kW; YPSILANTI, MI; Owner: WORD BROADCASTERS, INC.)
WKNR (850 AM; 50 kW; CLEVELAND, OH; Owner: CARON BROADCASTING, INC.)
Strongest FM radio stations in Harper Woods:
WMXD (92.3 FM; DETROIT, MI; Owner: AMFM RADIO LICENSES, L.L.C.)
WDTW (106.7 FM; DETROIT, MI; Owner: AMFM RADIO LICENSES, L.L.C.)
WDMK (102.7 FM; MOUNT CLEMENS, MI; Owner: RADIO ONE OF DETROIT, LLC)
WMGC-FM (105.1 FM; DETROIT, MI; Owner: GREATER BOSTON RADIO, INC.)
WCSX (94.7 FM; BIRMINGHAM, MI; Owner: GREATER BOSTON RADIO, INC.)
WDET-FM (101.9 FM; DETROIT, MI; Owner: WAYNE STATE UNIVERSITY)
WDVD (96.3 FM; DETROIT, MI; Owner: ABC, INC.)
WKRK-FM (97.1 FM; DETROIT, MI; Owner: INFINITY BROADCASTING OPERATIONS, INC.)
WJLB (97.9 FM; DETROIT, MI; Owner: AMFM RADIO LICENSES, L.L.C.)
WDTR-FM (90.9 FM; DETROIT, MI; Owner: BOARD OF EDUCATION, CITY OF DETROIT)
WYCD (99.5 FM; DETROIT, MI; Owner: INFINITY BROADCASTING CORPORATION OF MICHIGAN)
WRIF (101.1 FM; DETROIT, MI; Owner: GREATER BOSTON RADIO, INC.)
WNIC (100.3 FM; DEARBORN, MI; Owner: AMFM RADIO LICENSES, L.L.C.)
WGPR (107.5 FM; DETROIT, MI; Owner: WGPR, INC.)
WDTJ (105.9 FM; DETROIT, MI; Owner: RADIO ONE OF DETROIT, LLC)
WDRQ (93.1 FM; DETROIT, MI; Owner: ABC, INC.)
WVMV (98.7 FM; DETROIT, MI; Owner: INFINITY BROADCASTING OPERATIONS, INC.)
WOMC (104.3 FM; DETROIT, MI; Owner: INFINITY BROADCASTING CORPORATION OF MICHIGAN)
WKQI (95.5 FM; DETROIT, MI; Owner: AMFM RADIO LICENSES, L.L.C.)
WMUZ (103.5 FM; DETROIT, MI; Owner: WMUZ RADIO, INC.)
TV broadcast stations around Harper Woods:
W48AV (Channel 48; DETROIT, MI; Owner: PAXSON COMMUNICATIONS LICENSE COMPANY, LLC)
WADL (Channel 38; MOUNT CLEMENS, MI; Owner: ADELL BROADCASTING CORPORATION)
WWJ-TV (Channel 62; DETROIT, MI; Owner: CBS BROADCASTING INC.)
WJBK (Channel 2; DETROIT, MI; Owner: FOX TELEVISION STATIONS, INC.)
WDWB (Channel 20; DETROIT, MI; Owner: WXON LICENSE, INC.)
WTVS (Channel 56; DETROIT, MI; Owner: DETROIT EDUC. TV FOUNDATION)
WBXD-CA (Channel 5; DETROIT, MI; Owner: THE BOX WORLDWIDE LLC)
WXYZ-TV (Channel 7; DETROIT, MI; Owner: CHANNEL 7 OF DETROIT, INC.)
WDIV-TV (Channel 4; DETROIT, MI; Owner: POST-NEWSWEEK STATIONS, MICHIGAN, INC.)
WLPC-LP (Channel 26; DETROIT, MI; Owner: GLENN R. AND KARIN A. PLUMMER)
WKBD (Channel 50; DETROIT, MI; Owner: VIACOM STATIONS GROUP OF DETROIT INC.)
WDWO-CA (Channel 18; DETROIT, MI; Owner: TCT OF MICHIGAN, INC.)
W33BY (Channel 68; DETROIT, MI; Owner: HIGHLAND PARK BROADCASTING, L.P.)
WFUM (Channel 28; FLINT, MI; Owner: UNIVERSITY OF MICHIGAN)
FCC Registered Antenna Towers: 21 (
See the full list of FCC Registered Antenna Towers in Harper Woods )
FCC Registered Broadcast Land Mobile Towers: 6
19600 E 8 Mile Rd (Lat: 42.450861 Lon: -82.926583), Call Sign: KQH534, Licensee ID: L00066439, Assigned Frequencies: 158.760 MHz, Grant Date: 04/07/2004, Expiration Date: 02/08/2014, Cancellation Date: 04/12/2014, Registrant: City Of Harper Woods Lat: 42.449722 Lon: -82.933056, Call Sign: WPVA672, Assigned Frequencies: 452.250 MHz, 457.250 MHz, 461.200 MHz, 461.950 MHz, 466.950 MHz, 467.875 MHz, 467.925 MHz, 462.225 MHz, 467.225 MHz, 466.925 MHz, 466.900 MHz, Grant Date: 06/07/2002, Expiration Date: 06/07/2012, Cancellation Date: 08/11/2012, Certifier: Robyn Jessen, Registrant: Advanced Wireless Communications, 20809 Kensington Blvd, Lakeville, MN 55044-7486, Phone: (952) 469-5400, Fax: (952) 469-0170Lat: 42.447806 Lon: -83.212417, Call Sign: WPWL388, Assigned Frequencies: 464.637 MHz, Grant Date: 12/12/2002, Expiration Date: 12/12/2012, Cancellation Date: 02/16/2013, Certifier: Linda Magyar, Registrant: Business Radio Licensing, 26941 Cabot Road #134, Laguna Hills, CA 92653, Phone: (949) 348-8510, Fax: (949) 348-8514Lat: 42.444139 Lon: -82.932333, Call Sign: WQEU690, Assigned Frequencies: 72.1800 MHz, 72.2600 MHz, Grant Date: 01/30/2016, Expiration Date: 04/19/2026, Certifier: Joan Deaton, Registrant: Federal License Management, 1784 E. 3rd Street Suite 269, Williamsport, PA 17701-3862, Phone: (570) 505-3894, Fax: (570) 651-9032, Email:
Lat: 42.444278 Lon: -82.934917, Call Sign: WRCJ661, Assigned Frequencies: 452.737 MHz, 457.737 MHz, 452.837 MHz, 457.837 MHz, 464.362 MHz, Grant Date: 10/22/2018, Expiration Date: 10/22/2028, Certifier: James Dennis, Registrant: Bearcom, 4009 Distribution Drive, Bldg 200, Garland, TX 75041, Phone: (800) 458-9887, Email:
HARPER WOODS S.D., 20570 Kelly Road (Lat: 42.448722 Lon: -82.940306), Call Sign: WRDA750, Assigned Frequencies: 452.112 MHz, Grant Date: 03/14/2019, Expiration Date: 03/14/2029, Certifier: James Dennis, Registrant: Visiplex, Inc., 1287 North Barclay Boulevard, Buffalo Grove, IL 60089, Phone: (847) 229-0250, Fax: (847) 229-0259, Email:
FCC Registered Microwave Towers: 5
Se Cor Of I94 At Roscommon & Pedestrian Bridge (Lat: 42.428639 Lon: -82.925167), Overall height: 38.1 m, Call Sign: WPNE812, Assigned Frequencies: 23275.0 MHz, Grant Date: 05/09/2012, Expiration Date: 06/30/2022, Cancellation Date: 03/26/2020, Registrant: Michigan Department Of Transportation, 8885 Ricks Road, Lansing, MI 48909, Phone: (517) 636-0635, Email:
DET 0103, 19420 Harper Avenue (Lat: 42.428056 Lon: -82.923889), Type: Pole, Structure height: 45.7 m, Call Sign: WQED938, Assigned Frequencies: 19360.0 MHz, 19320.0 MHz, Grant Date: 01/04/2006, Expiration Date: 07/03/2006, Cancellation Date: 09/02/2006, Certifier: Eric M Botto, Registrant: Fletcher, Heald & Hildreth, P.L.C., 11th Floor, 1300 N. 17th Street, Arlington, VA 22209, Phone: (703) 812-0400, Fax: (703) 812-0486, Email:
DET0103, 19420 Harper Avenue (Lat: 42.428056 Lon: -82.923889), Type: Pole, Structure height: 45.7 m, Call Sign: WQEF589, Licensee ID: L01728370, Assigned Frequencies: 19360.0 MHz, 19320.0 MHz, Grant Date: 01/13/2006, Expiration Date: 01/13/2016, Cancellation Date: 09/05/2013, Certifier: Joseph M Sandri Jr., Registrant: Fibertower Network Services, Corp., Debtor-In-Possession, 1875 Eye Street, Nw, 5th Floor, Room 505, Washington, DC 20006, Phone: (202) 223-1028, Email:
DET1183, 19410 Harper Ave (Lat: 42.428306 Lon: -82.925000), Type: Mtower, Structure height: 44.2 m, Call Sign: WQRK546, Assigned Frequencies: 19585.0 MHz, 19585.0 MHz, 19585.0 MHz, 19585.0 MHz, 19585.0 MHz, Grant Date: 06/05/2013, Expiration Date: 06/05/2023, Cancellation Date: 06/25/2014, Certifier: David Werblow, Registrant: T-Mobile License LLC, 12920 Se 38th Street, Bellevue, WA 98006, Phone: (425) 383-5178, Fax: (425) 383-4840, Email:
DE03XC131, 18000 Vernier Road (Lat: 42.448222 Lon: -82.937500), Type: Stack, Structure height: 38.4 m, Call Sign: WQXY286, Assigned Frequencies: 22025.0 MHz, 22025.0 MHz, 22025.0 MHz, 22025.0 MHz, 22025.0 MHz, 22025.0 MHz, 22025.0 MHz, Grant Date: 07/12/2016, Expiration Date: 07/12/2026, Cancellation Date: 04/06/2022, Certifier: David Werblow, Registrant: Dla Piper LLP, 500 8th Street, Nw, Washington, DC 20004, Phone: (202) 799-4216, Fax: (202) 799-5616, Email:
FCC Registered Amateur Radio Licenses: 27 (
See the full list of FCC Registered Amateur Radio Licenses in Harper Woods )
FAA Registered Aircraft Manufacturers and Dealers: 1 (
See the full list of FAA Registered Manufacturers and Dealers in Harper Woods )
FAA Registered Aircraft: 16 (
See the full list of FAA Registered Aircraft )
Home Mortgage Disclosure Act Aggregated Statistics For Year 2009(Based on 4 full tracts) A) FHA, FSA/RHS & VA B) Conventional C) Refinancings D) Home Improvement Loans F) Non-occupant Loans on G) Loans On Manufactured Number Average Value Number Average Value Number Average Value Number Average Value Number Average Value Number Average Value
LOANS ORIGINATED 70 $69,302 14 $52,703 73 $102,686 8 $28,871 8 $39,722 0 $0 APPLICATIONS APPROVED, NOT ACCEPTED 8 $53,988 1 $27,950 17 $86,298 2 $2,000 3 $30,000 0 $0 APPLICATIONS DENIED 38 $75,327 10 $47,193 69 $93,823 26 $22,228 17 $57,155 1 $26,000 APPLICATIONS WITHDRAWN 11 $61,455 2 $55,500 27 $107,372 6 $57,997 7 $46,409 0 $0 FILES CLOSED FOR INCOMPLETENESS 1 $79,850 0 $0 8 $99,109 3 $72,277 0 $0 0 $0
Aggregated Statistics For Year 2008(Based on 4 full tracts) A) FHA, FSA/RHS & VA B) Conventional C) Refinancings D) Home Improvement Loans F) Non-occupant Loans on G) Loans On Manufactured Number Average Value Number Average Value Number Average Value Number Average Value Number Average Value Number Average Value
LOANS ORIGINATED 59 $92,626 55 $62,483 113 $109,435 15 $15,189 37 $58,662 1 $18,000 APPLICATIONS APPROVED, NOT ACCEPTED 2 $75,000 7 $119,563 23 $109,042 6 $21,662 4 $72,395 0 $0 APPLICATIONS DENIED 28 $80,290 22 $66,555 128 $109,780 43 $20,687 21 $61,089 1 $73,860 APPLICATIONS WITHDRAWN 9 $101,994 3 $67,667 44 $118,174 1 $127,000 2 $88,420 0 $0 FILES CLOSED FOR INCOMPLETENESS 1 $70,000 4 $74,945 13 $129,145 2 $41,945 3 $78,333 0 $0
Aggregated Statistics For Year 2007(Based on 4 full tracts) A) FHA, FSA/RHS & VA B) Conventional C) Refinancings D) Home Improvement Loans E) Loans on Dwellings For 5+ Families F) Non-occupant Loans on Number Average Value Number Average Value Number Average Value Number Average Value Number Average Value Number Average Value
LOANS ORIGINATED 27 $110,968 180 $90,585 204 $94,455 25 $25,630 1 $42,000 55 $75,614 APPLICATIONS APPROVED, NOT ACCEPTED 2 $66,935 49 $97,161 57 $105,919 4 $44,495 0 $0 8 $79,216 APPLICATIONS DENIED 10 $105,318 121 $97,149 283 $112,365 77 $28,391 0 $0 35 $82,281 APPLICATIONS WITHDRAWN 5 $98,400 20 $100,674 78 $118,517 2 $41,925 0 $0 5 $93,912 FILES CLOSED FOR INCOMPLETENESS 1 $108,790 11 $116,260 23 $98,742 4 $46,435 0 $0 8 $85,815
Aggregated Statistics For Year 2006(Based on 4 full tracts) A) FHA, FSA/RHS & VA B) Conventional C) Refinancings D) Home Improvement Loans E) Loans on Dwellings For 5+ Families F) Non-occupant Loans on Number Average Value Number Average Value Number Average Value Number Average Value Number Average Value Number Average Value
LOANS ORIGINATED 36 $111,080 372 $81,144 337 $90,557 30 $27,956 1 $66,000 77 $69,109 APPLICATIONS APPROVED, NOT ACCEPTED 3 $149,667 96 $93,830 107 $102,920 11 $28,977 0 $0 18 $81,026 APPLICATIONS DENIED 2 $160,500 204 $101,003 383 $109,170 83 $40,523 0 $0 43 $83,037 APPLICATIONS WITHDRAWN 6 $118,933 57 $96,273 147 $113,022 12 $59,708 0 $0 14 $76,660 FILES CLOSED FOR INCOMPLETENESS 1 $158,000 7 $104,041 60 $114,769 2 $32,500 0 $0 3 $60,900
Aggregated Statistics For Year 2005(Based on 4 full tracts) A) FHA, FSA/RHS & VA B) Conventional C) Refinancings D) Home Improvement Loans E) Loans on Dwellings For 5+ Families F) Non-occupant Loans on G) Loans On Manufactured Number Average Value Number Average Value Number Average Value Number Average Value Number Average Value Number Average Value Number Average Value
LOANS ORIGINATED 61 $126,828 440 $87,885 480 $99,232 37 $28,037 2 $3,932,000 100 $72,473 0 $0 APPLICATIONS APPROVED, NOT ACCEPTED 7 $135,547 88 $80,043 88 $102,597 9 $36,422 0 $0 15 $80,861 2 $93,500 APPLICATIONS DENIED 11 $125,363 166 $86,563 385 $115,626 81 $42,088 0 $0 39 $75,495 4 $41,958 APPLICATIONS WITHDRAWN 5 $133,864 73 $172,934 203 $118,323 18 $99,503 0 $0 10 $93,937 0 $0 FILES CLOSED FOR INCOMPLETENESS 1 $82,840 21 $86,011 87 $119,598 4 $62,738 0 $0 6 $56,165 0 $0
Aggregated Statistics For Year 2004(Based on 4 full tracts) A) FHA, FSA/RHS & VA B) Conventional C) Refinancings D) Home Improvement Loans E) Loans on Dwellings For 5+ Families F) Non-occupant Loans on G) Loans On Manufactured Number Average Value Number Average Value Number Average Value Number Average Value Number Average Value Number Average Value Number Average Value
LOANS ORIGINATED 93 $121,610 341 $97,454 523 $104,330 33 $29,193 2 $57,955 71 $87,451 0 $0 APPLICATIONS APPROVED, NOT ACCEPTED 8 $106,472 51 $110,579 113 $106,640 6 $19,667 0 $0 13 $80,000 2 $137,500 APPLICATIONS DENIED 17 $115,274 113 $102,945 277 $112,118 38 $29,188 0 $0 34 $98,780 3 $55,273 APPLICATIONS WITHDRAWN 8 $100,389 40 $86,642 129 $112,679 13 $89,217 0 $0 11 $84,865 0 $0 FILES CLOSED FOR INCOMPLETENESS 4 $135,500 8 $109,162 113 $116,663 3 $13,327 0 $0 5 $88,400 0 $0
Aggregated Statistics For Year 2003(Based on 4 full tracts) A) FHA, FSA/RHS & VA B) Conventional C) Refinancings D) Home Improvement Loans F) Non-occupant Loans on Number Average Value Number Average Value Number Average Value Number Average Value Number Average Value
LOANS ORIGINATED 126 $116,560 273 $100,315 1,151 $100,890 46 $10,538 73 $74,829 APPLICATIONS APPROVED, NOT ACCEPTED 6 $126,138 29 $117,391 156 $101,986 7 $11,129 14 $81,494 APPLICATIONS DENIED 9 $112,358 52 $101,995 377 $117,125 71 $17,042 22 $82,878 APPLICATIONS WITHDRAWN 3 $123,203 17 $121,439 179 $103,926 6 $33,655 9 $84,721 FILES CLOSED FOR INCOMPLETENESS 6 $92,578 7 $104,980 59 $107,605 3 $30,310 3 $110,287
Aggregated Statistics For Year 2002(Based on 4 full tracts) A) FHA, FSA/RHS & VA B) Conventional C) Refinancings D) Home Improvement Loans E) Loans on Dwellings For 5+ Families F) Non-occupant Loans on Number Average Value Number Average Value Number Average Value Number Average Value Number Average Value Number Average Value
LOANS ORIGINATED 154 $112,912 257 $102,780 859 $98,038 51 $17,518 1 $2,850,000 64 $80,499 APPLICATIONS APPROVED, NOT ACCEPTED 6 $102,727 21 $102,666 120 $94,412 15 $12,797 0 $0 10 $63,632 APPLICATIONS DENIED 11 $104,440 31 $101,824 204 $85,663 46 $11,842 0 $0 13 $88,467 APPLICATIONS WITHDRAWN 9 $106,042 23 $115,080 148 $99,432 5 $54,964 0 $0 6 $66,247 FILES CLOSED FOR INCOMPLETENESS 3 $107,863 7 $94,803 58 $102,254 0 $0 0 $0 1 $75,860
Aggregated Statistics For Year 2001(Based on 4 full tracts) A) FHA, FSA/RHS & VA B) Conventional C) Refinancings D) Home Improvement Loans E) Loans on Dwellings For 5+ Families F) Non-occupant Loans on Number Average Value Number Average Value Number Average Value Number Average Value Number Average Value Number Average Value
LOANS ORIGINATED 150 $109,838 277 $97,593 747 $94,731 73 $20,388 1 $888,000 55 $72,290 APPLICATIONS APPROVED, NOT ACCEPTED 2 $91,910 35 $78,789 65 $83,726 31 $23,472 0 $0 1 $75,000 APPLICATIONS DENIED 13 $104,552 42 $74,881 240 $87,094 79 $12,592 0 $0 11 $53,616 APPLICATIONS WITHDRAWN 6 $117,445 18 $100,519 163 $92,243 8 $25,490 0 $0 7 $85,687 FILES CLOSED FOR INCOMPLETENESS 1 $64,880 1 $64,000 40 $99,776 1 $15,000 0 $0 0 $0
Aggregated Statistics For Year 2000(Based on 4 full tracts) A) FHA, FSA/RHS & VA B) Conventional C) Refinancings D) Home Improvement Loans F) Non-occupant Loans on Number Average Value Number Average Value Number Average Value Number Average Value Number Average Value
LOANS ORIGINATED 163 $101,528 255 $96,616 211 $81,776 102 $10,799 32 $71,714 APPLICATIONS APPROVED, NOT ACCEPTED 3 $52,000 24 $77,270 49 $72,197 29 $14,957 2 $65,500 APPLICATIONS DENIED 10 $112,838 43 $80,044 132 $74,080 84 $16,077 11 $59,467 APPLICATIONS WITHDRAWN 6 $108,087 26 $84,382 64 $76,790 9 $56,306 2 $81,000 FILES CLOSED FOR INCOMPLETENESS 2 $77,890 3 $96,320 38 $91,924 1 $10,000 0 $0
Aggregated Statistics For Year 1999(Based on 4 full tracts) A) FHA, FSA/RHS & VA B) Conventional C) Refinancings D) Home Improvement Loans F) Non-occupant Loans on Number Average Value Number Average Value Number Average Value Number Average Value Number Average Value
LOANS ORIGINATED 140 $95,255 268 $91,012 413 $76,084 106 $17,282 39 $58,295 APPLICATIONS APPROVED, NOT ACCEPTED 3 $133,490 15 $71,865 71 $79,862 24 $13,595 4 $70,730 APPLICATIONS DENIED 13 $91,838 24 $90,651 114 $72,161 65 $14,612 3 $20,413 APPLICATIONS WITHDRAWN 5 $81,432 20 $84,268 78 $76,991 9 $49,689 3 $70,180 FILES CLOSED FOR INCOMPLETENESS 0 $0 6 $112,152 33 $79,973 0 $0 1 $100,460
Detailed HMDA statistics for the following Tracts:
5513.00
, 5514.00 , 5515.00 , 5516.00
Private Mortgage Insurance Companies Aggregated Statistics For Year 2009(Based on 4 full tracts) A) Conventional B) Refinancings C) Non-occupant Loans on Number Average Value Number Average Value Number Average Value
LOANS ORIGINATED 3 $91,333 1 $74,860 0 $0 APPLICATIONS APPROVED, NOT ACCEPTED 3 $65,000 0 $0 2 $47,500 APPLICATIONS DENIED 1 $39,000 0 $0 1 $39,000 APPLICATIONS WITHDRAWN 0 $0 0 $0 0 $0 FILES CLOSED FOR INCOMPLETENESS 0 $0 0 $0 0 $0
Aggregated Statistics For Year 2008(Based on 4 full tracts) A) Conventional B) Refinancings C) Non-occupant Loans on Number Average Value Number Average Value Number Average Value
LOANS ORIGINATED 16 $81,116 7 $130,227 3 $41,977 APPLICATIONS APPROVED, NOT ACCEPTED 16 $100,772 12 $134,393 3 $90,240 APPLICATIONS DENIED 7 $55,714 2 $200,000 5 $79,800 APPLICATIONS WITHDRAWN 0 $0 1 $89,830 0 $0 FILES CLOSED FOR INCOMPLETENESS 2 $98,930 1 $71,860 1 $71,860
Aggregated Statistics For Year 2007(Based on 4 full tracts) A) Conventional B) Refinancings C) Non-occupant Loans on Number Average Value Number Average Value Number Average Value
LOANS ORIGINATED 79 $102,900 17 $125,234 10 $100,259 APPLICATIONS APPROVED, NOT ACCEPTED 14 $102,104 7 $134,481 2 $66,445 APPLICATIONS DENIED 5 $108,200 1 $85,840 0 $0 APPLICATIONS WITHDRAWN 3 $120,560 3 $124,267 0 $0 FILES CLOSED FOR INCOMPLETENESS 0 $0 1 $99,810 0 $0
Aggregated Statistics For Year 2006(Based on 4 full tracts) A) Conventional B) Refinancings C) Non-occupant Loans on Number Average Value Number Average Value Number Average Value
LOANS ORIGINATED 47 $110,802 27 $118,969 7 $85,499 APPLICATIONS APPROVED, NOT ACCEPTED 6 $111,385 6 $127,587 0 $0 APPLICATIONS DENIED 0 $0 0 $0 0 $0 APPLICATIONS WITHDRAWN 3 $94,903 3 $134,000 1 $71,860 FILES CLOSED FOR INCOMPLETENESS 0 $0 0 $0 0 $0
Aggregated Statistics For Year 2005(Based on 4 full tracts) A) Conventional B) Refinancings C) Non-occupant Loans on Number Average Value Number Average Value Number Average Value
LOANS ORIGINATED 65 $118,961 37 $121,845 12 $77,255 APPLICATIONS APPROVED, NOT ACCEPTED 9 $99,626 11 $127,249 4 $90,725 APPLICATIONS DENIED 1 $58,000 1 $94,820 1 $58,000 APPLICATIONS WITHDRAWN 5 $136,438 7 $114,313 1 $82,840 FILES CLOSED FOR INCOMPLETENESS 0 $0 0 $0 0 $0
Aggregated Statistics For Year 2004(Based on 4 full tracts) A) Conventional B) Refinancings C) Non-occupant Loans on Number Average Value Number Average Value Number Average Value
LOANS ORIGINATED 83 $113,400 45 $128,748 20 $94,894 APPLICATIONS APPROVED, NOT ACCEPTED 15 $122,404 24 $127,919 7 $87,213 APPLICATIONS DENIED 3 $107,183 2 $97,500 2 $132,370 APPLICATIONS WITHDRAWN 3 $82,177 6 $134,473 2 $98,930 FILES CLOSED FOR INCOMPLETENESS 0 $0 0 $0 0 $0
Aggregated Statistics For Year 2003(Based on 4 full tracts) A) Conventional B) Refinancings C) Non-occupant Loans on Number Average Value Number Average Value Number Average Value
LOANS ORIGINATED 88 $114,275 130 $119,456 20 $84,398 APPLICATIONS APPROVED, NOT ACCEPTED 14 $113,838 40 $125,216 6 $68,122 APPLICATIONS DENIED 2 $79,410 3 $88,570 0 $0 APPLICATIONS WITHDRAWN 4 $135,000 12 $136,633 0 $0 FILES CLOSED FOR INCOMPLETENESS 0 $0 0 $0 0 $0
Aggregated Statistics For Year 2002(Based on 4 full tracts) A) Conventional B) Refinancings C) Non-occupant Loans on Number Average Value Number Average Value Number Average Value
LOANS ORIGINATED 108 $118,637 111 $116,429 11 $96,296 APPLICATIONS APPROVED, NOT ACCEPTED 4 $153,462 30 $113,506 1 $85,000 APPLICATIONS DENIED 2 $56,430 3 $133,667 2 $56,430 APPLICATIONS WITHDRAWN 7 $118,406 8 $119,406 0 $0 FILES CLOSED FOR INCOMPLETENESS 1 $110,000 0 $0 0 $0
Aggregated Statistics For Year 2001(Based on 4 full tracts) A) Conventional B) Refinancings C) Non-occupant Loans on Number Average Value Number Average Value Number Average Value
LOANS ORIGINATED 115 $107,562 100 $117,129 13 $78,946 APPLICATIONS APPROVED, NOT ACCEPTED 17 $113,429 23 $119,327 2 $44,965 APPLICATIONS DENIED 2 $104,800 2 $112,425 0 $0 APPLICATIONS WITHDRAWN 1 $102,000 6 $112,973 0 $0 FILES CLOSED FOR INCOMPLETENESS 1 $171,000 0 $0 0 $0
Aggregated Statistics For Year 2000(Based on 4 full tracts) A) Conventional B) Refinancings C) Non-occupant Loans on Number Average Value Number Average Value Number Average Value
LOANS ORIGINATED 107 $101,837 21 $98,260 11 $67,845 APPLICATIONS APPROVED, NOT ACCEPTED 3 $69,957 4 $131,695 1 $52,000 APPLICATIONS DENIED 3 $117,630 2 $116,440 1 $59,890 APPLICATIONS WITHDRAWN 0 $0 1 $88,000 0 $0 FILES CLOSED FOR INCOMPLETENESS 0 $0 0 $0 0 $0
Aggregated Statistics For Year 1999(Based on 4 full tracts) A) Conventional B) Refinancings C) Non-occupant Loans on Number Average Value Number Average Value Number Average Value
LOANS ORIGINATED 120 $100,988 33 $93,332 9 $69,023 APPLICATIONS APPROVED, NOT ACCEPTED 2 $59,640 5 $87,218 1 $44,320 APPLICATIONS DENIED 3 $108,673 4 $128,958 0 $0 APPLICATIONS WITHDRAWN 1 $203,590 1 $98,800 0 $0 FILES CLOSED FOR INCOMPLETENESS 1 $98,630 1 $94,910 0 $0
Detailed PMIC statistics for the following Tracts:
5513.00
, 5514.00 , 5515.00 , 5516.00
Most common first names in Harper Woods, MI among deceased individuals Name Count Lived (average)
Mary 200 81.4 years John 172 75.8 years Joseph 124 76.1 years Helen 114 80.3 years William 108 75.5 years Margaret 97 79.4 years George 90 74.9 years Edward 83 74.9 years Robert 80 72.8 years Charles 77 77.0 years
Most common last names in Harper Woods, MI among deceased individuals Last name Count Lived (average)
Smith 39 78.2 years Miller 32 78.3 years Brown 16 80.1 years Young 14 81.9 years Wilson 14 78.9 years Schultz 14 77.1 years Johnson 14 74.2 years Jones 11 80.1 years Taylor 11 66.3 years Moore 10 66.1 years
Harper Woods compared to Michigan state average:
Median house value below state average. Unemployed percentage significantly below state average. Black race population percentage significantly above state average. Hispanic race population percentage significantly below state average. Foreign-born population percentage significantly below state average. Length of stay since moving in significantly above state average. Harper Woods on our top lists :
#19 on the list of "Top 101 cities with the highest number of auto thefts per 100,000 residents, excludes tourist destinations and others with a lot of outsiders visiting based on city industries data (population 5,000+)"
#26 on the list of "Top 100 cities with lowest ratio of median house value to median household income (pop. 5,000+)"
#57 on the list of "Top 101 cities with the largest city-data.com crime index increase from 2002 to 2012 (population 5,000+)"
#89 on the list of "Top 101 cities with the largest city-data.com crime index per police officer (population 5,000+)"
#99 on the list of "Top 101 cities with the highest city-data.com crime index, excludes tourist destinations and others with a lot of outsiders visiting based on city industries data (population 5,000+)"
#3 on the list of "Top 101 counties with the most Black Protestant adherents"
#4 on the list of "Top 101 counties with the most Catholic congregations"
#4 on the list of "Top 101 counties with the most Black Protestant congregations"
#4 on the list of "Top 101 counties with the highest surface withdrawal of fresh water for public supply"
#5 on the list of "Top 101 counties with the largest number of people moving out compared to moving in (pop. 50,000+)"
Top Patent Applicants
Michael Muller (9)
Jagannath Gopal Krishnan (3)
August Thomas Vaught (3)
David P. Schankin (3)
Dane Winbigler (2)
David Paul Schankin (2)
Dane R. Winbigler (2)
Steven Potvin (2)
Barbara Jean Walter (1)
Robert James Messina (1)
Total of 34 patent applications in 2008-2024.

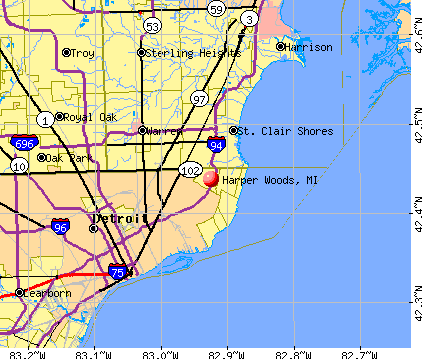


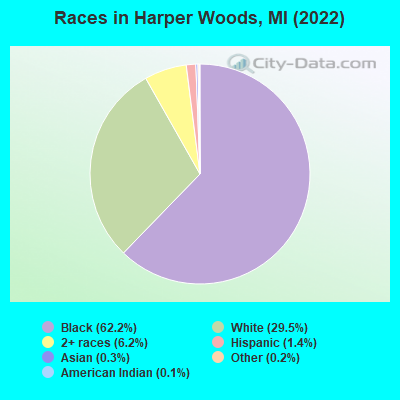
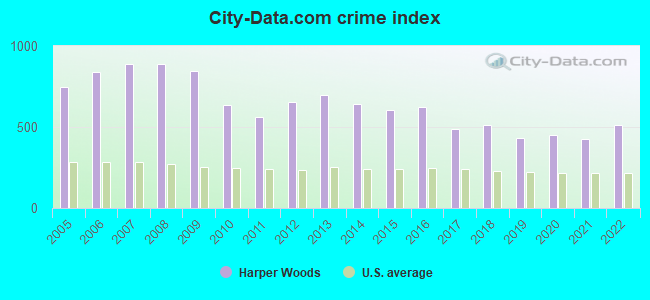
 Recent articles from our blog. Our writers, many of them Ph.D. graduates or candidates, create easy-to-read articles on a wide variety of topics.

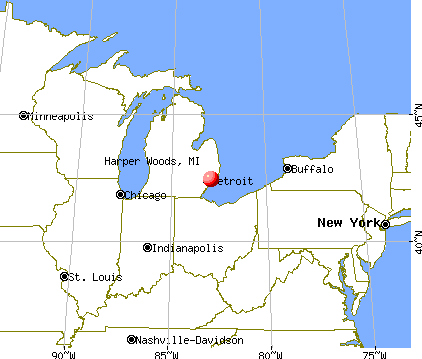
 (3.7 miles
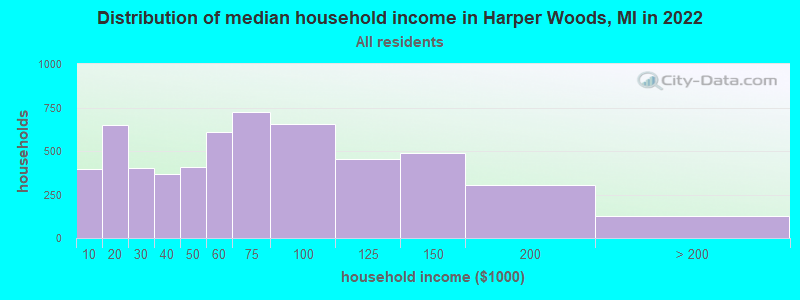
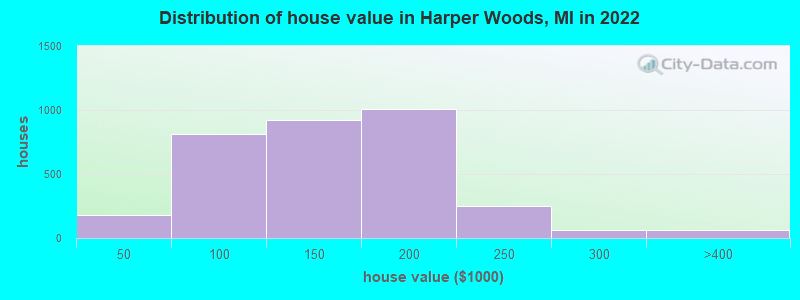
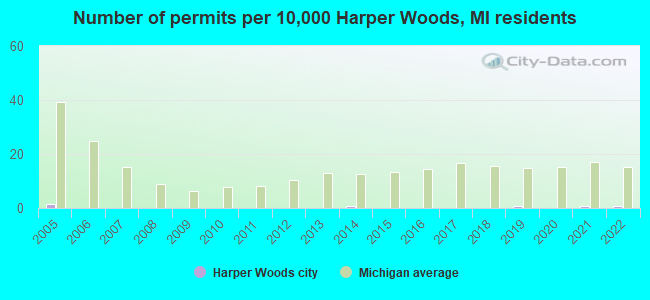
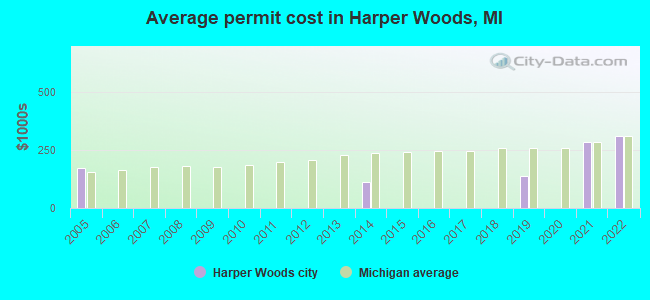
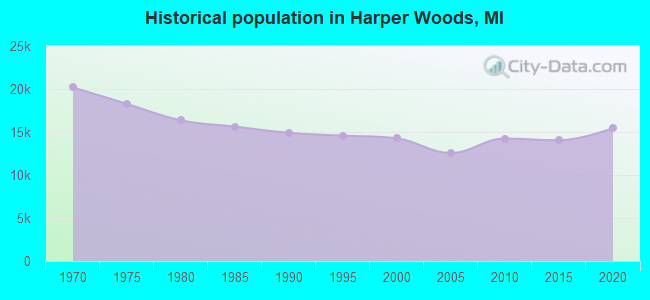
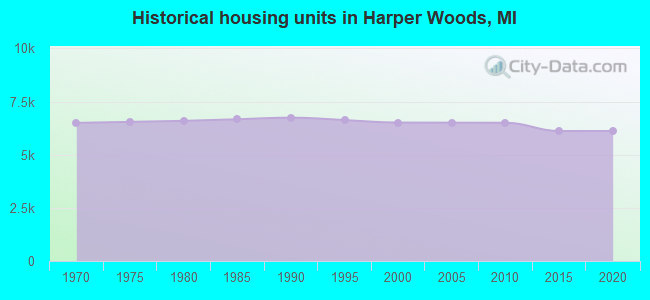
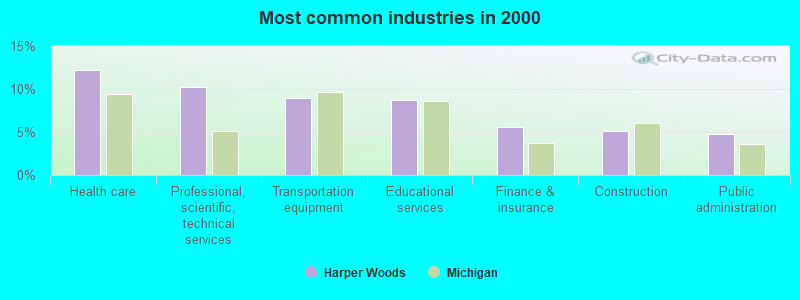
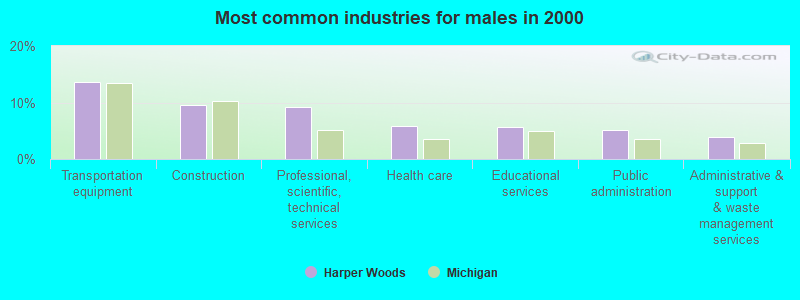
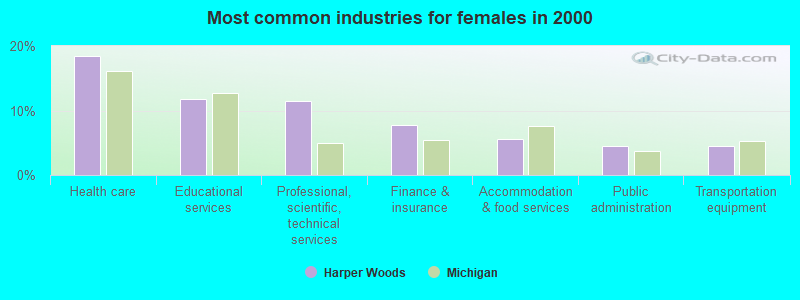
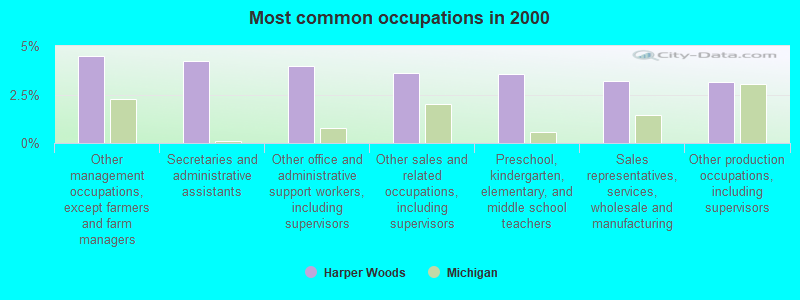
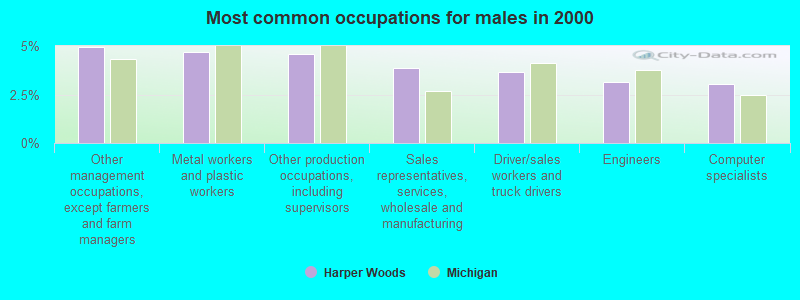
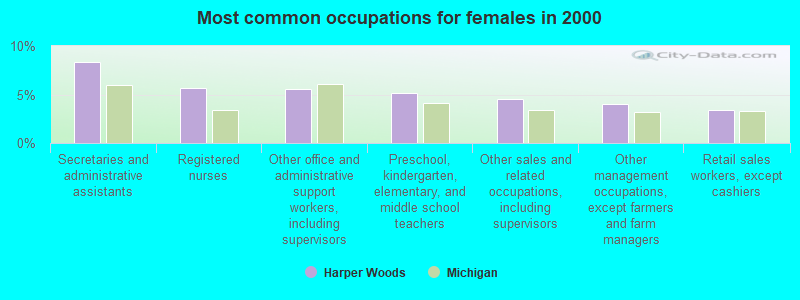


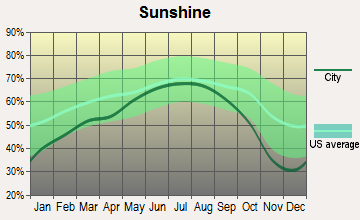

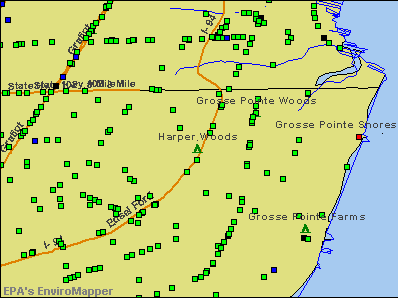

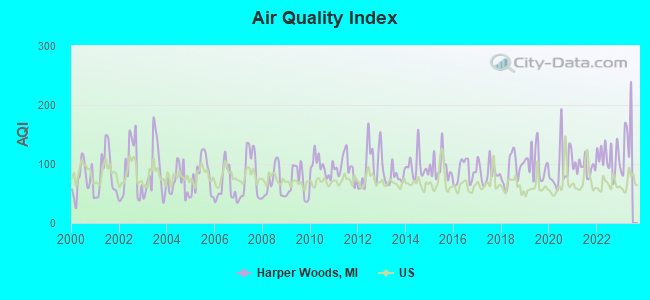
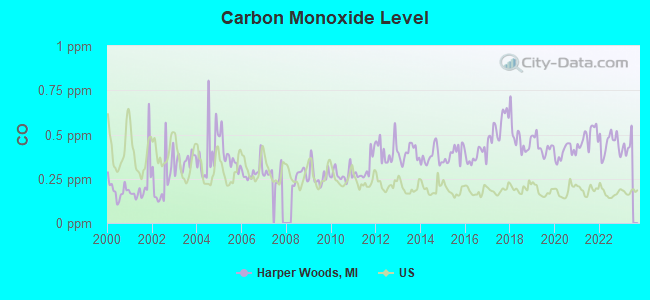
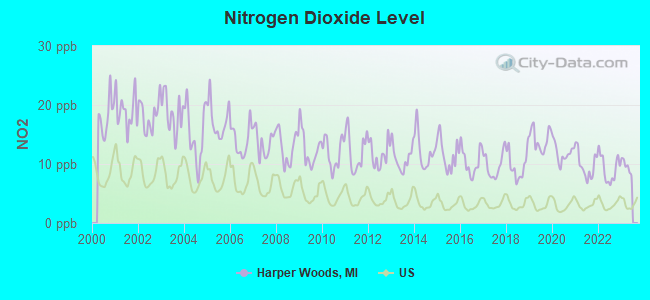
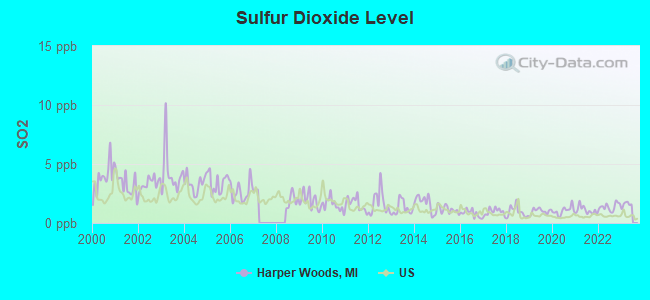
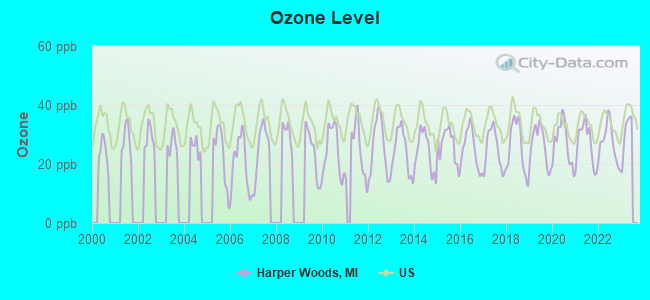
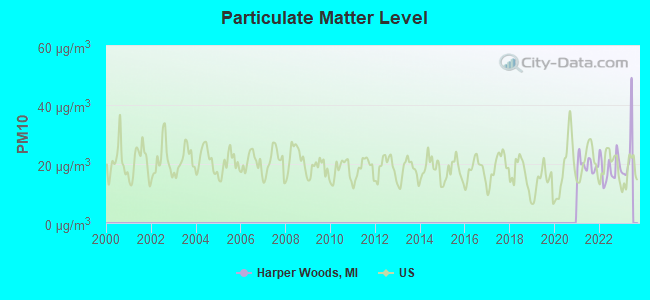
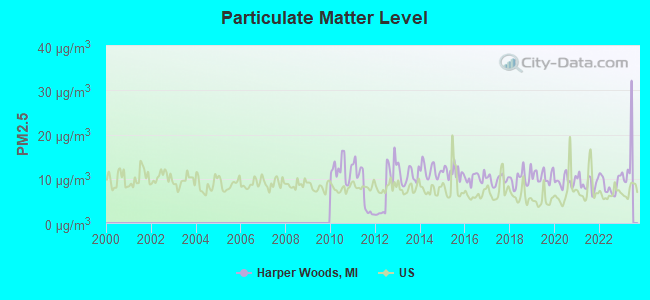
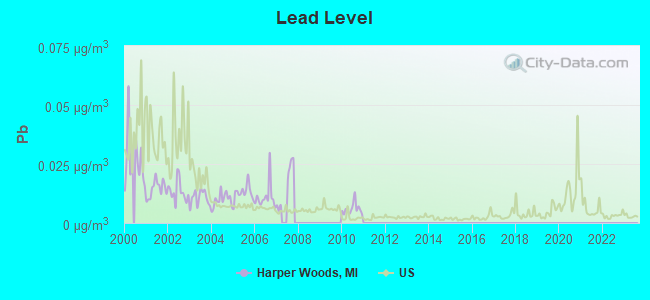

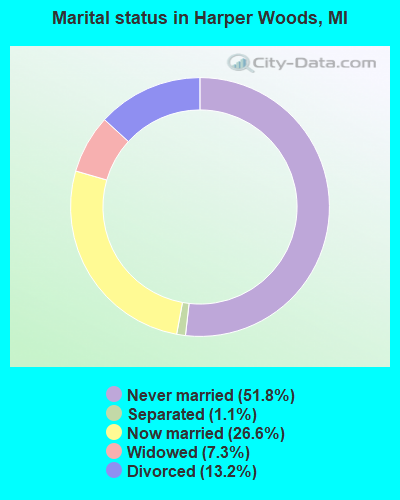
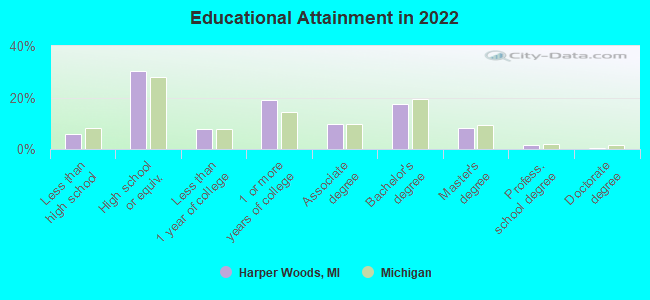
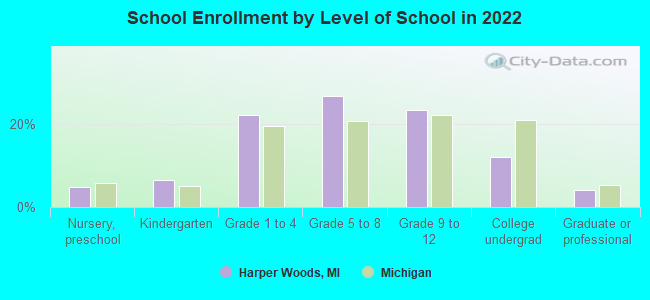
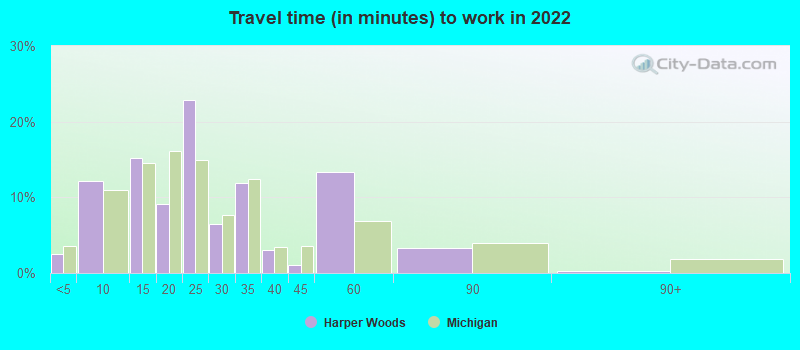
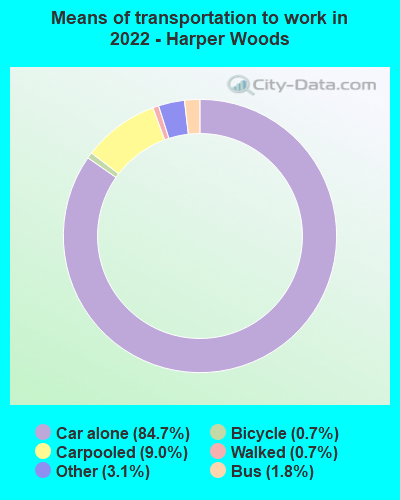
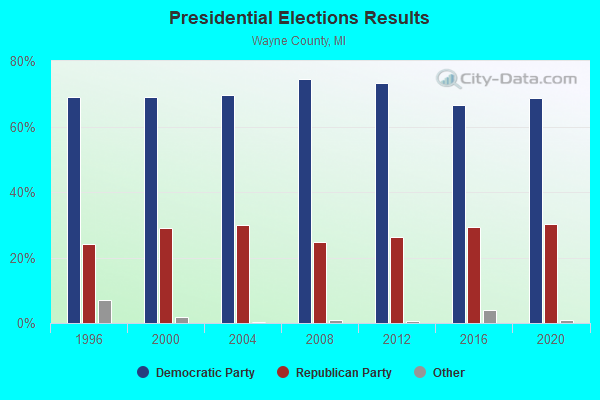
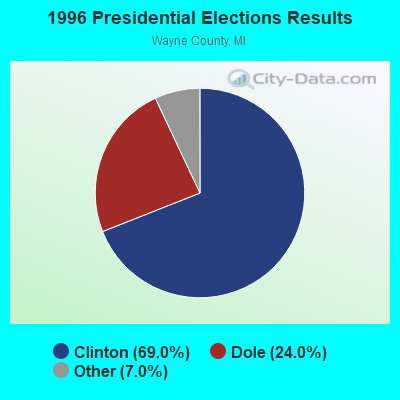
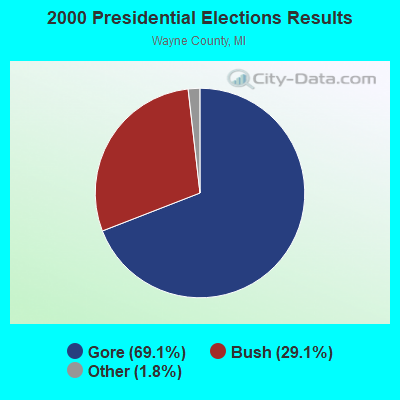
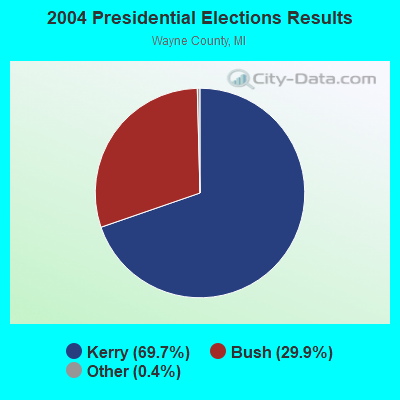
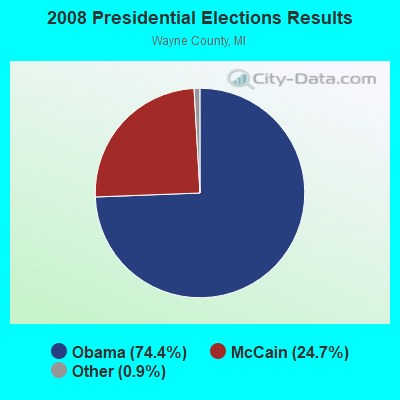
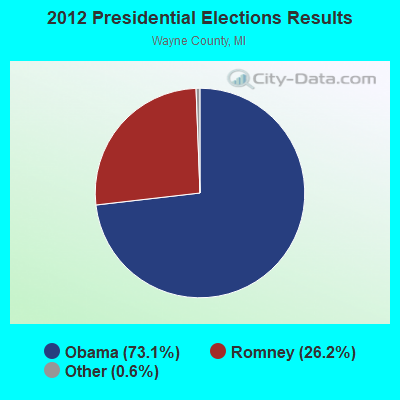
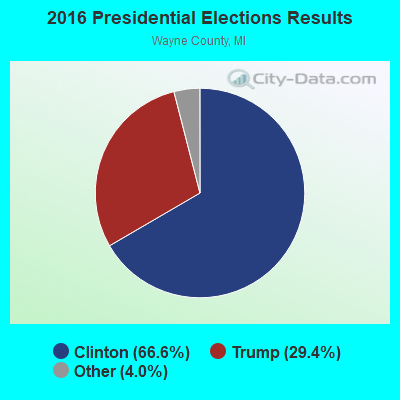
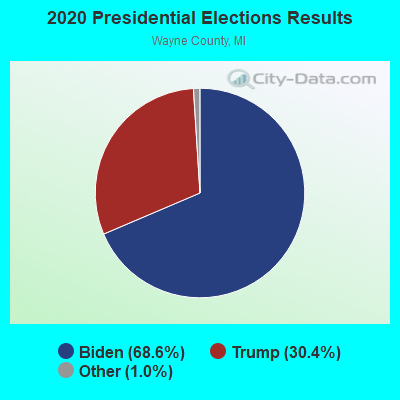

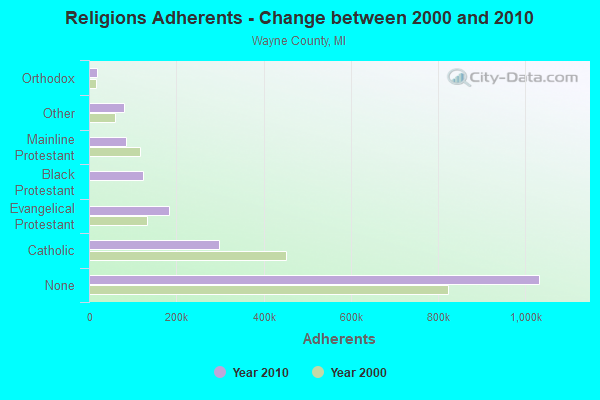
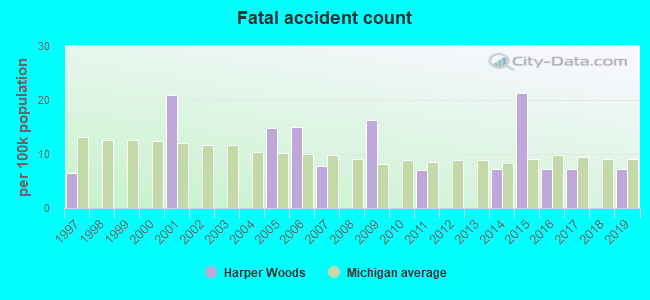

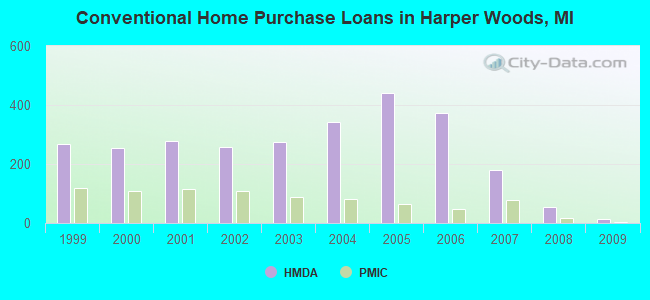
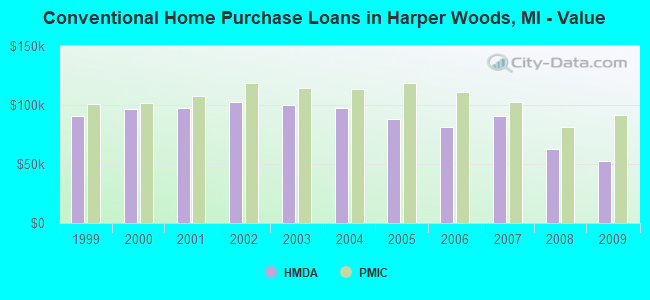
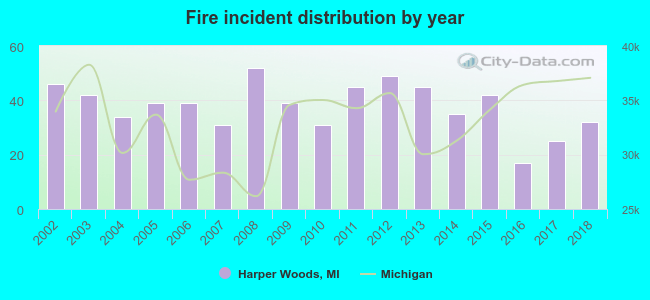 Based on the data from the years 2002 - 2018 the average number of fires per year is 38. The highest number of fire incidents - 52 took place in 2008, and the least - 17 in 2016. The data has a dropping trend.
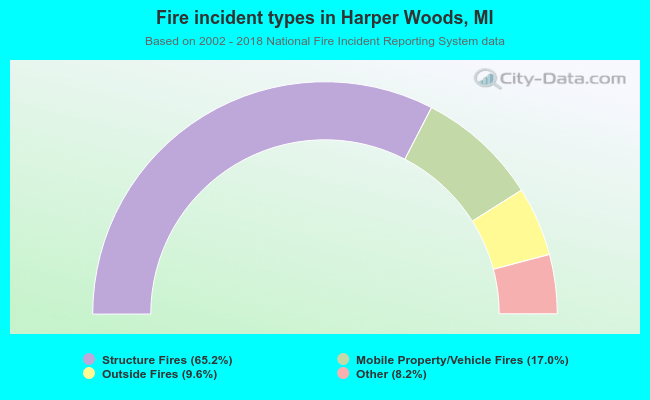 When looking into fire subcategories, the most reports belonged to: Structure Fires (65.2%), and Mobile Property/Vehicle Fires (17.0%).