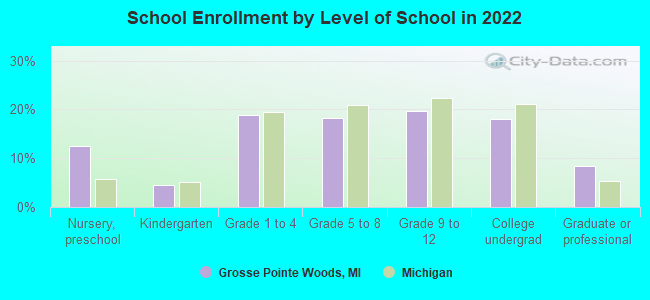
Grosse Pointe Woods, Michigan
Submit your own pictures of this city and show them to the world
- OSM Map
- General Map
- Google Map
- MSN Map
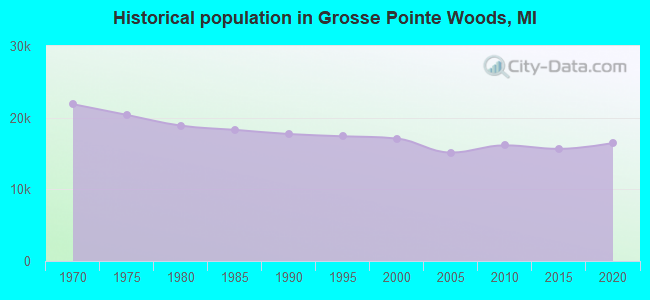
Population change since 2000: -5.5%
 |
| Males: 7,512 | |
| Females: 8,625 |
| Median resident age: | 44.9 years |
| Michigan median age: | 40.3 years |
Zip codes: 48236.
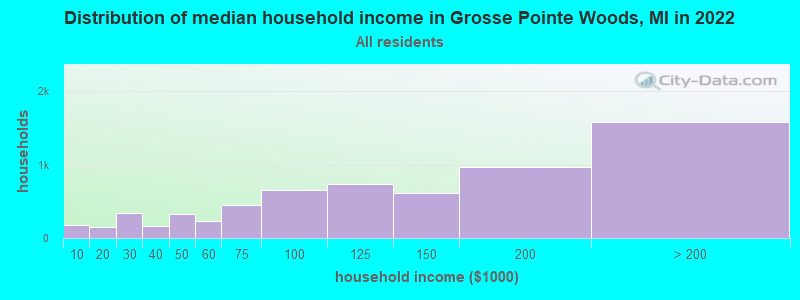
| Grosse Pointe Woods: | $122,733 |
| MI: | $66,986 |
Estimated per capita income in 2022: $59,775 (it was $38,653 in 2000)
Grosse Pointe Woods city income, earnings, and wages data
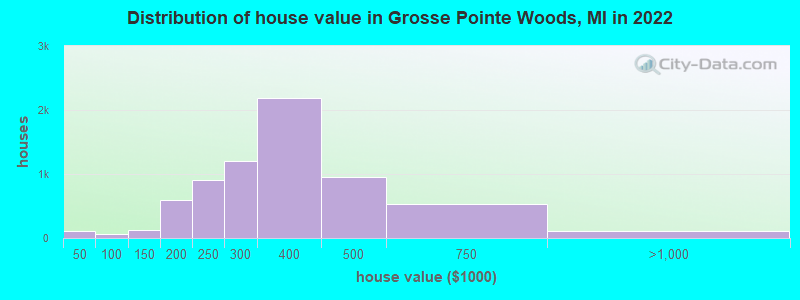
Estimated median house or condo value in 2022: $338,795 (it was $231,800 in 2000)
| Grosse Pointe Woods: | $338,795 |
| MI: | $224,400 |
Mean prices in 2022: all housing units: $218,544; detached houses: $224,524; townhouses or other attached units: $219,041; in 2-unit structures: $149,371; in 3-to-4-unit structures: $201,136; in 5-or-more-unit structures: $186,505; mobile homes: $50,472; occupied boats, rvs, vans, etc.: $95,764
Median gross rent in 2022: $1,725.
Grosse Pointe Woods, MI residents, houses, and apartments details
(3.7% for White Non-Hispanic residents, 10.5% for Black residents, 35.7% for Hispanic or Latino residents, 18.9% for other race residents, 2.1% for two or more races residents)
Detailed information about poverty and poor residents in Grosse Pointe Woods, MI

Compare current foreclosures near Grosse Pointe Woods, MI:
| Photo | Address | Area | Beds / Baths | Price | Details |
|---|---|---|---|---|---|

|
#1
Fisher Rd
Grosse Pointe, MI 48230
|
1,205 sq. feet
|
1 baths 3 beds |
$349,900
|
show details |

|
#2
Montrose St
Detroit, MI 48227
|
1,310 sq. feet
|
1 baths 3 beds |
$95,500
|
show details |

|
#3
Winder St Apt 206
Detroit, MI 48201
|
770 sq. feet
|
1 baths 1 beds |
$309,900
|
show details |

|
#4
Bedford St
Detroit, MI 48224
|
1,081 sq. feet
|
1 baths 3 beds |
$52,500
|
show details |

|
#5
Manhattan St
Oak Park, MI 48237
|
1,336 sq. feet
|
1 baths 3 beds |
$305,000
|
show details |

|
#6
W Buena Vista St
Detroit, MI 48238
|
2,852 sq. feet
|
3 baths 4 beds |
$40,000
|
show details |

|
#7
Somerset Ave
Detroit, MI 48224
|
1,171 sq. feet
|
1 baths 3 beds |
$14,900
|
show details |

|
#8
Roselawn St
Detroit, MI 48204
|
1,368 sq. feet
|
2 baths 4 beds |
$54,900
|
show details |

|
#9
Toepfer Rd
Warren, MI 48091
|
1,092 sq. feet
|
1 baths 3 beds |
$159,000
|
show details |

|
#10
Piper Ave
Eastpointe, MI 48021
|
721 sq. feet
|
1 baths 2 beds |
$67,900
|
show details |
| Photo | Address | Area | Beds / Baths | Price | Details |
|---|---|---|---|---|---|

|
#11
Desoto St
Detroit, MI 48238
|
1,500 sq. feet
|
1 baths 3 beds |
$71,250
|
show details |

|
#12
Greensboro St
Detroit, MI 48224
|
1,038 sq. feet
|
1 baths 2 beds |
$84,900
|
show details |

|
#13
Orleans St # 49
Detroit, MI 48207
|
- sq. feet
|
2 baths 3 beds |
$99,900
|
show details |

|
#14
Mcclellan St
Detroit, MI 48214
|
- sq. feet
|
2 baths 4 beds |
$35,000
|
show details |

|
#15
Georgiana Ave
Warren, MI 48089
|
1,233 sq. feet
|
1 baths - beds |
$4,500
|
show details |

|
#16
Danbury St
Highland Park, MI 48203
|
728 sq. feet
|
1 baths - beds |
$14,900
|
show details |

|
#17
Collingwood St
Detroit, MI 48206
|
1,424 sq. feet
|
1 baths - beds |
$19,900
|
show details |

|
#18
Springfield St
Detroit, MI 48213
|
876 sq. feet
|
1 baths - beds |
$13,900
|
show details |

|
#19
Chicago Blvd
Detroit, MI 48206
|
3,872 sq. feet
|
3 baths 5 beds |
show details | |

|
#20
Davison St
Sterling Heights, MI 48310
|
1,553 sq. feet
|
1 baths 3 beds |
show details |
| Photo | Address | Area | Beds / Baths | Price | Details |
|---|---|---|---|---|---|

|
#21
Pinehurst St
Detroit, MI 48221
|
1,587 sq. feet
|
1 baths 3 beds |
show details | |

|
#22
Riverside Dr
Mount Clemens, MI 48043
|
1,580 sq. feet
|
2 baths 3 beds |
show details | |

|
#23
Fairport St
Detroit, MI 48205
|
1,266 sq. feet
|
1 baths 3 beds |
show details | |

|
#24
Eastwood Blvd
Warren, MI 48089
|
1,002 sq. feet
|
1 baths 3 beds |
show details | |

|
#25
Mendota St
Detroit, MI 48221
|
879 sq. feet
|
1 baths 3 beds |
show details | |

|
#26
Waltz Ave
Warren, MI 48091
|
700 sq. feet
|
1 baths 3 beds |
show details | |

|
#27
Peerless St
Detroit, MI 48224
|
1,293 sq. feet
|
1 baths 3 beds |
show details | |

|
#28
Goodwill Ln
Macomb, MI 48044
|
2,964 sq. feet
|
2 baths 4 beds |
show details | |

|
#29
Ridgedale St
Oak Park, MI 48237
|
1,523 sq. feet
|
1 baths 3 beds |
show details | |

|
#30
Rosenbusch Blvd
Warren, MI 48089
|
903 sq. feet
|
1 baths 3 beds |
show details |
| Photo | Address | Area | Beds / Baths | Price | Details |
|---|---|---|---|---|---|

|
#31
Wayburn St
Detroit, MI 48224
|
1,200 sq. feet
|
1 baths 3 beds |
show details | |

|
#32
W Shevlin Ave
Hazel Park, MI 48030
|
967 sq. feet
|
1 baths 3 beds |
show details | |

|
#33
E Bloomfield Ave
Royal Oak, MI 48073
|
1,483 sq. feet
|
2 baths 4 beds |
show details | |

|
#34
Roberta St
Roseville, MI 48066
|
1,152 sq. feet
|
1 baths 3 beds |
show details | |

|
#35
Kipling St
Oak Park, MI 48237
|
1,298 sq. feet
|
1 baths 3 beds |
show details | |

|
#36
Harned St
Detroit, MI 48234
|
928 sq. feet
|
1 baths 3 beds |
show details | |

|
#37
Somerset Ave
Detroit, MI 48224
|
1,398 sq. feet
|
2 baths 3 beds |
show details | |

|
#38
Wildemere St
Detroit, MI 48238
|
900 sq. feet
|
1 baths 3 beds |
show details | |

|
#39
Hilldale Dr
Macomb, MI 48044
|
1,847 sq. feet
|
2 baths 3 beds |
show details | |

|
#40
W Bernhard Ave
Hazel Park, MI 48030
|
1,385 sq. feet
|
1 baths 3 beds |
show details |
| Photo | Address | Area | Beds / Baths | Price | Details |
|---|---|---|---|---|---|

|
#41
Chardonnay Dr
Sterling Heights, MI 48314
|
2,320 sq. feet
|
2 baths 3 beds |
show details | |

|
#42
Canal Rd
Sterling Heights, MI 48313
|
1,672 sq. feet
|
2 baths 3 beds |
show details | |

|
#43
Samoa Dr
Sterling Heights, MI 48312
|
1,896 sq. feet
|
2 baths 5 beds |
show details | |

|
#44
Common Rd
Roseville, MI 48066
|
1,015 sq. feet
|
1 baths 3 beds |
show details | |

|
#45
Larchmont St
Saint Clair Shores, MI 48081
|
1,060 sq. feet
|
1 baths 3 beds |
show details | |

|
#46
Barton St
Saint Clair Shores, MI 48081
|
1,412 sq. feet
|
1 baths 4 beds |
show details | |

|
#47
Muirland St
Detroit, MI 48221
|
- sq. feet
|
3 baths 6 beds |
show details | |

|
#48
Gardenia Ln
Clinton Township, MI 48036
|
2,844 sq. feet
|
3 baths 3 beds |
show details | |

|
#49
Palomino Dr
Warren, MI 48093
|
1,401 sq. feet
|
1 baths 3 beds |
show details | |

|
Check over 1 million property listings on Foreclosure.com!
|
browse all offers | |||


- 14,01987.0%White alone
- 8845.5%Black alone
- 6263.9%Two or more races
- 3632.3%Hispanic
- 1270.8%Asian alone
- 420.3%Other race alone
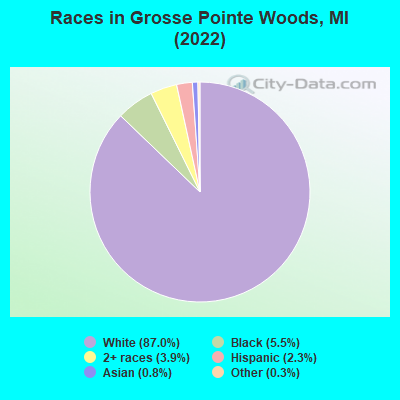
Races in Grosse Pointe Woods detailed stats: ancestries, foreign born residents, place of birth
According to our research of Michigan and other state lists, there were 11 registered sex offenders living in Grosse Pointe Woods, Michigan as of April 28, 2024.
The ratio of all residents to sex offenders in Grosse Pointe Woods is 1,420 to 1.
The ratio of registered sex offenders to all residents in this city is much lower than the state average.
Type |
2009 |
2010 |
2011 |
2012 |
2013 |
2014 |
2015 |
2016 |
2017 |
2018 |
2019 |
2020 |
2021 |
2022 |
|---|---|---|---|---|---|---|---|---|---|---|---|---|---|---|
| Murders (per 100,000) | 0 (0.0) | 0 (0.0) | 0 (0.0) | 0 (0.0) | 0 (0.0) | 0 (0.0) | 0 (0.0) | 0 (0.0) | 0 (0.0) | 0 (0.0) | 0 (0.0) | 0 (0.0) | 0 (0.0) | 0 (0.0) |
| Rapes (per 100,000) | 0 (0.0) | 1 (6.2) | 1 (6.2) | 1 (6.3) | 2 (12.7) | 3 (19.0) | 0 (0.0) | 3 (19.1) | 7 (45.0) | 2 (12.9) | 2 (13.0) | 3 (19.6) | 1 (6.6) | 2 (12.4) |
| Robberies (per 100,000) | 8 (53.5) | 3 (18.6) | 3 (18.6) | 3 (18.8) | 4 (25.4) | 5 (31.6) | 6 (38.0) | 4 (25.5) | 1 (6.4) | 5 (32.3) | 6 (39.1) | 0 (0.0) | 1 (6.6) | 3 (18.7) |
| Assaults (per 100,000) | 17 (113.7) | 19 (117.8) | 8 (49.6) | 1 (6.3) | 13 (82.5) | 14 (88.6) | 3 (19.0) | 5 (31.8) | 11 (70.7) | 6 (38.7) | 16 (104.2) | 8 (52.4) | 11 (72.6) | 8 (49.8) |
| Burglaries (per 100,000) | 25 (167.2) | 31 (192.1) | 31 (192.3) | 33 (206.5) | 36 (228.4) | 24 (151.8) | 20 (126.8) | 35 (222.9) | 22 (141.3) | 41 (264.6) | 9 (58.6) | 15 (98.2) | 10 (66.0) | 15 (93.3) |
| Thefts (per 100,000) | 238 (1,592) | 206 (1,277) | 150 (930.3) | 168 (1,051) | 164 (1,041) | 148 (936.3) | 156 (989.0) | 179 (1,140) | 164 (1,054) | 172 (1,110) | 153 (996.7) | 90 (589.4) | 117 (771.9) | 117 (727.7) |
| Auto thefts (per 100,000) | 27 (180.6) | 24 (148.7) | 28 (173.7) | 53 (331.6) | 20 (126.9) | 20 (126.5) | 20 (126.8) | 11 (70.1) | 20 (128.5) | 12 (77.4) | 29 (188.9) | 17 (111.3) | 18 (118.7) | 29 (180.4) |
| Arson (per 100,000) | 0 (0.0) | 0 (0.0) | 0 (0.0) | 1 (6.3) | 1 (6.3) | 0 (0.0) | 0 (0.0) | 0 (0.0) | 1 (6.4) | 0 (0.0) | 0 (0.0) | 0 (0.0) | 0 (0.0) | 0 (0.0) |
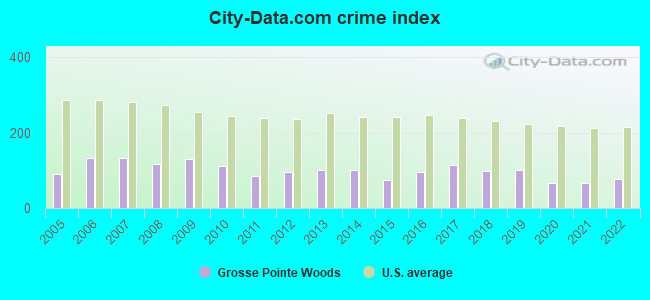
| City-Data.com crime index | 128.6 | 110.5 | 85.0 | 94.9 | 102.0 | 100.6 | 73.8 | 96.1 | 114.4 | 96.9 | 102.1 | 65.6 | 66.8 | 75.6 |
The City-Data.com crime index weighs serious crimes and violent crimes more heavily. Higher means more crime, U.S. average is 246.1. It adjusts for the number of visitors and daily workers commuting into cities.
Crime rate in Grosse Pointe Woods detailed stats: murders, rapes, robberies, assaults, burglaries, thefts, arson
Full-time law enforcement employees in 2021, including police officers: 36 (30 officers - 30 male; 0 female).
| Officers per 1,000 residents here: | 1.98 |
| Michigan average: | 1.86 |
 Recent articles from our blog. Our writers, many of them Ph.D. graduates or candidates, create easy-to-read articles on a wide variety of topics.

 | Mid 40s, no kids, returning to area. (6 replies) |
| Do Detroit's suburbs suffer from Detroit's reputation? (68 replies) |
| Is Novi the best school district? (17 replies) |
| Detroit suburbs (63 replies) |
| Western Grosse Pointe Park (15 replies) |
| Grosse Pointes in 2020 - Where to Buy and is Long Term Outlook Good? (5 replies) |
Latest news from Grosse Pointe Woods, MI collected exclusively by city-data.com from local newspapers, TV, and radio stations
Ancestries: Polish (11.3%), Italian (10.0%), German (7.6%), Irish (6.2%), English (4.9%), American (4.6%).
Current Local Time: EST time zone
Elevation: 587 feet
Land area: 3.26 square miles.
Population density: 4,948 people per square mile (average).
918 residents are foreign born (2.2% North America, 1.8% Europe, 0.7% Latin America, 0.7% Asia).
| This city: | 5.7% |
| Michigan: | 6.9% |
Median real estate property taxes paid for housing units with mortgages in 2022: $6,086 (1.8%)
Median real estate property taxes paid for housing units with no mortgage in 2022: $6,252 (1.7%)
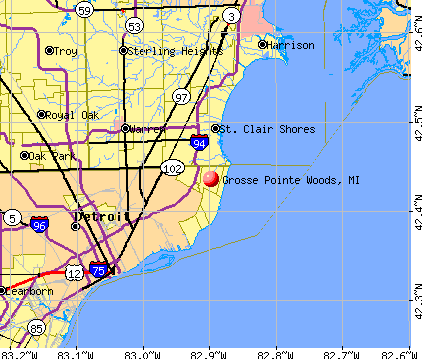
Nearest city with pop. 50,000+: St. Clair Shores, MI  (3.6 miles , pop. 63,096).
Nearest city with pop. 200,000+: Detroit, MI (11.0 miles , pop. 951,270).
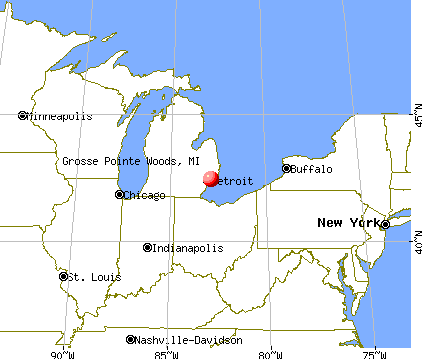
Nearest city with pop. 1,000,000+: Chicago, IL (248.6 miles , pop. 2,896,016).
Nearest cities:
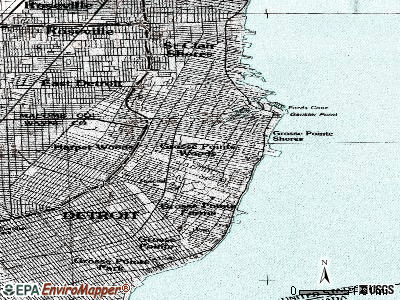
), ), ), Latitude: 42.44 N, Longitude: 82.90 W
Daytime population change due to commuting: -1,966 (-12.2%)
Workers who live and work in this city: 2,722 (33.2%)
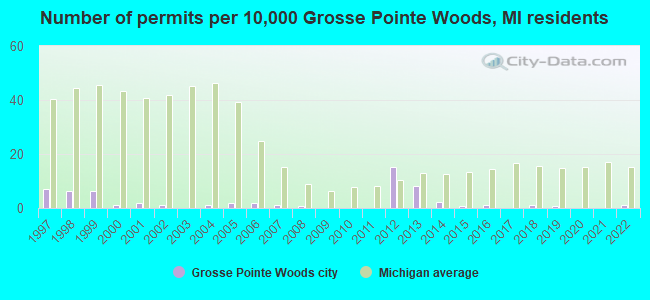
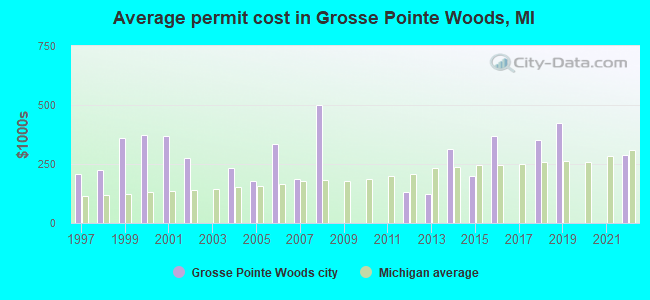
Single-family new house construction building permits:
- 2022: 2 buildings, average cost: $290,000
- 2019: 1 building, cost: $425,000
- 2018: 2 buildings, average cost: $352,300
- 2016: 2 buildings, average cost: $370,000
- 2015: 1 building, cost: $200,000
- 2014: 4 buildings, average cost: $312,800
- 2013: 14 buildings, average cost: $123,100
- 2012: 26 buildings, average cost: $130,000
- 2008: 1 building, cost: $500,000
- 2007: 2 buildings, average cost: $187,500
- 2006: 3 buildings, average cost: $333,300
- 2005: 3 buildings, average cost: $180,000
- 2004: 2 buildings, average cost: $231,000
- 2002: 2 buildings, average cost: $275,000
- 2001: 3 buildings, average cost: $366,700
- 2000: 2 buildings, average cost: $375,000
- 1999: 11 buildings, average cost: $359,100
- 1998: 11 buildings, average cost: $225,500
- 1997: 12 buildings, average cost: $208,900
| Here: | 4.0% |
| Michigan: | 3.5% |
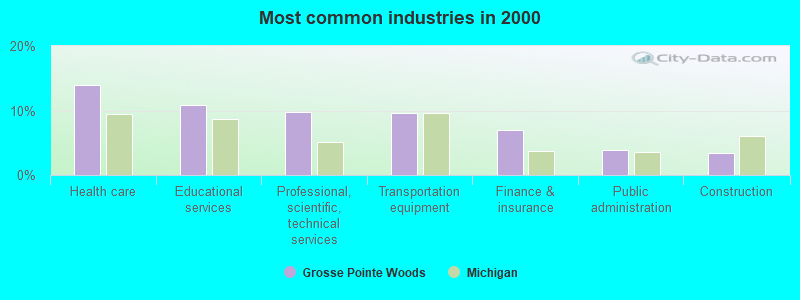
- Health care (14.0%)
- Educational services (10.8%)
- Professional, scientific, technical services (9.8%)
- Transportation equipment (9.6%)
- Finance & insurance (7.0%)
- Public administration (3.8%)
- Construction (3.4%)
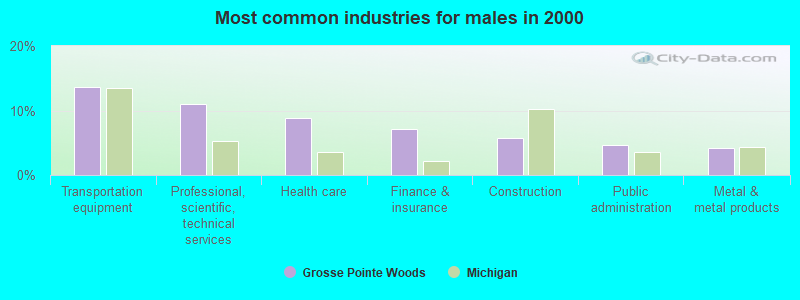
- Transportation equipment (13.6%)
- Professional, scientific, technical services (10.9%)
- Health care (8.8%)
- Finance & insurance (7.1%)
- Construction (5.7%)
- Public administration (4.7%)
- Metal & metal products (4.2%)
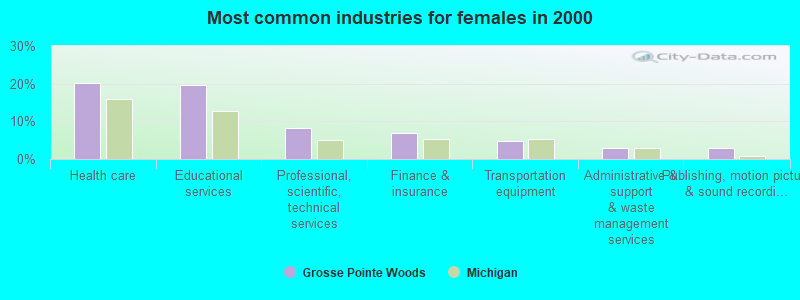
- Health care (20.3%)
- Educational services (19.7%)
- Professional, scientific, technical services (8.3%)
- Finance & insurance (6.9%)
- Transportation equipment (4.8%)
- Administrative & support & waste management services (2.8%)
- Publishing, motion picture & sound recording industries (2.8%)
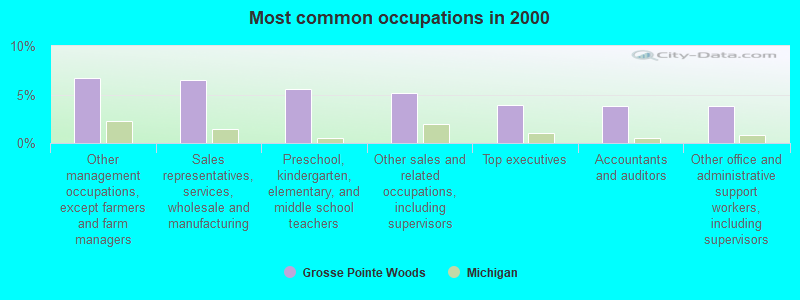
- Other management occupations, except farmers and farm managers (6.7%)
- Sales representatives, services, wholesale and manufacturing (6.5%)
- Preschool, kindergarten, elementary, and middle school teachers (5.5%)
- Other sales and related occupations, including supervisors (5.2%)
- Top executives (3.9%)
- Accountants and auditors (3.8%)
- Other office and administrative support workers, including supervisors (3.8%)
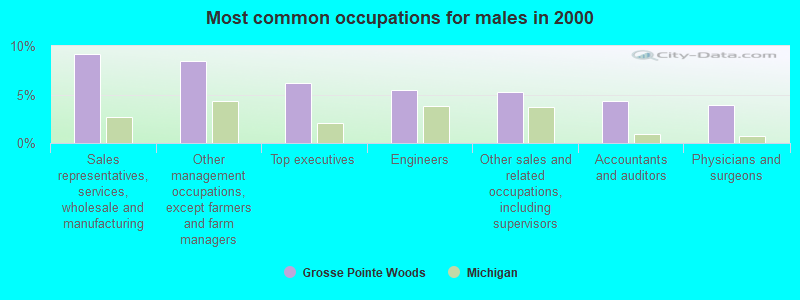
- Sales representatives, services, wholesale and manufacturing (9.2%)
- Other management occupations, except farmers and farm managers (8.5%)
- Top executives (6.2%)
- Engineers (5.5%)
- Other sales and related occupations, including supervisors (5.2%)
- Accountants and auditors (4.4%)
- Physicians and surgeons (3.9%)
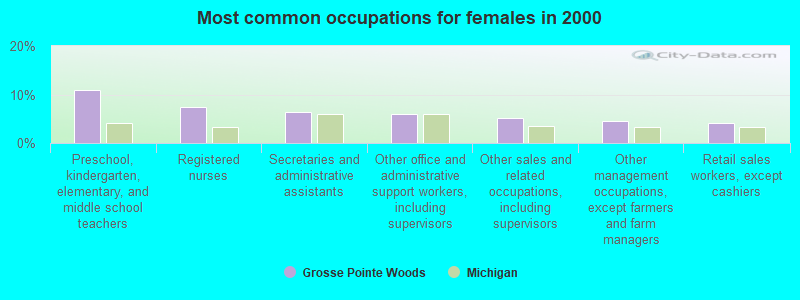
- Preschool, kindergarten, elementary, and middle school teachers (11.0%)
- Registered nurses (7.4%)
- Secretaries and administrative assistants (6.4%)
- Other office and administrative support workers, including supervisors (5.9%)
- Other sales and related occupations, including supervisors (5.1%)
- Other management occupations, except farmers and farm managers (4.5%)
- Retail sales workers, except cashiers (4.1%)
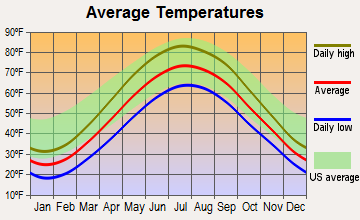
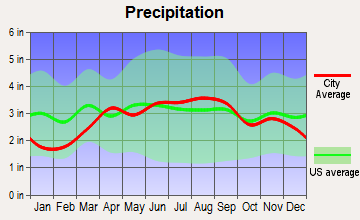
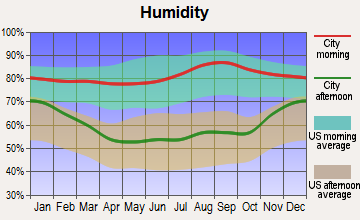
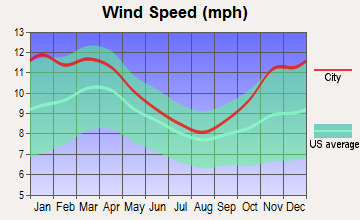
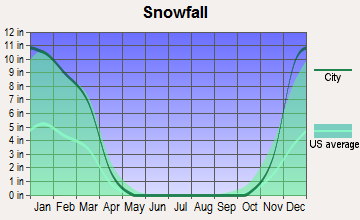
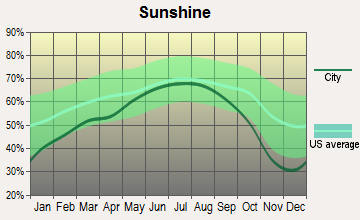
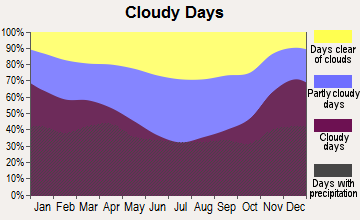
Average climate in Grosse Pointe Woods, Michigan
Based on data reported by over 4,000 weather stations
|
|

(lower is better)
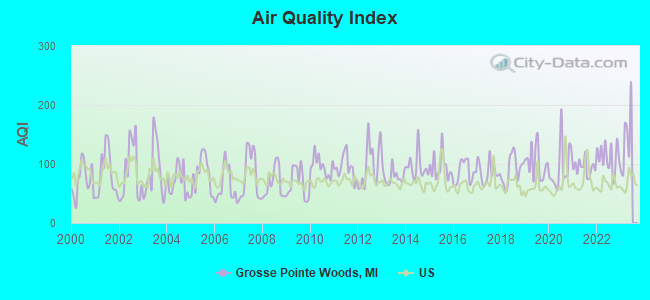
Air Quality Index (AQI) level in 2022 was 111. This is significantly worse than average.
| City: | 111 |
| U.S.: | 73 |
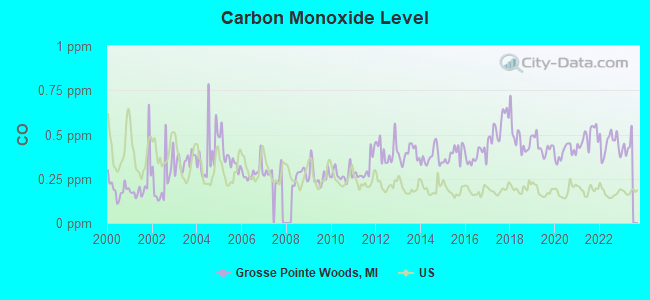
Carbon Monoxide (CO) [ppm] level in 2022 was 0.446. This is significantly worse than average. Closest monitor was 7.7 miles away from the city center.
| City: | 0.446 |
| U.S.: | 0.251 |
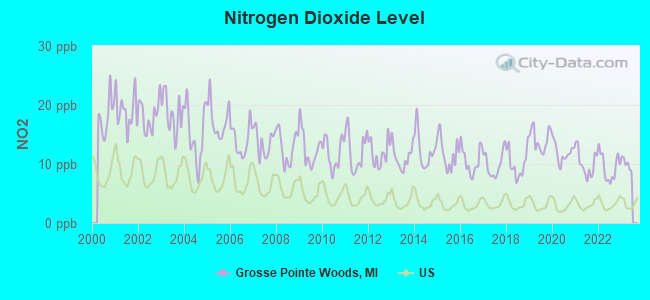
Nitrogen Dioxide (NO2) [ppb] level in 2022 was 9.47. This is significantly worse than average. Closest monitor was 3.2 miles away from the city center.
| City: | 9.47 |
| U.S.: | 5.11 |
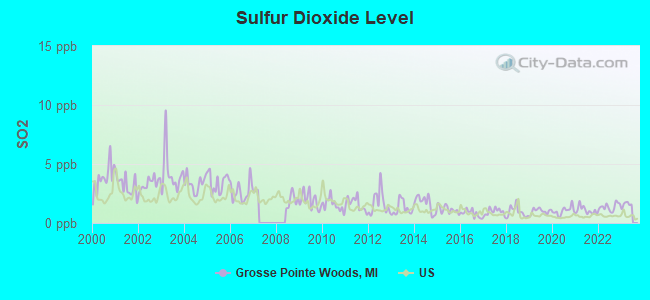
Sulfur Dioxide (SO2) [ppb] level in 2022 was 1.36. This is about average. Closest monitor was 3.2 miles away from the city center.
| City: | 1.36 |
| U.S.: | 1.51 |
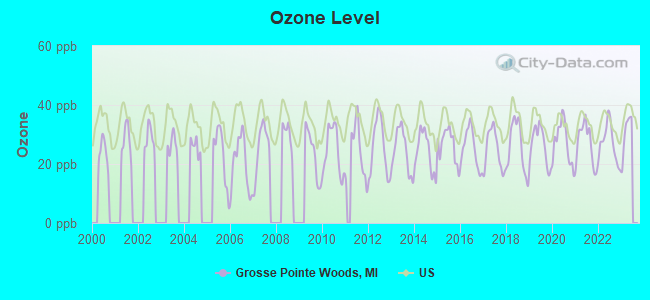
Ozone [ppb] level in 2022 was 27.1. This is better than average. Closest monitor was 9.3 miles away from the city center.
| City: | 27.1 |
| U.S.: | 33.3 |
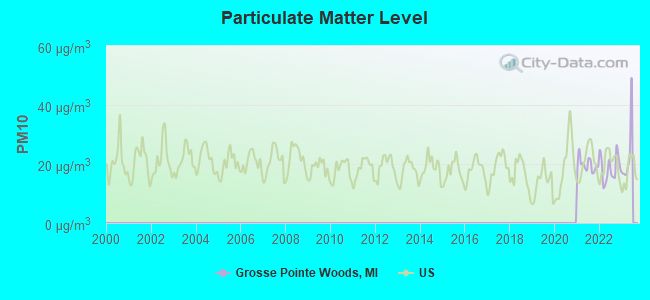
Particulate Matter (PM10) [µg/m3] level in 2022 was 18.6. This is about average. Closest monitor was 15.6 miles away from the city center.
| City: | 18.6 |
| U.S.: | 19.2 |
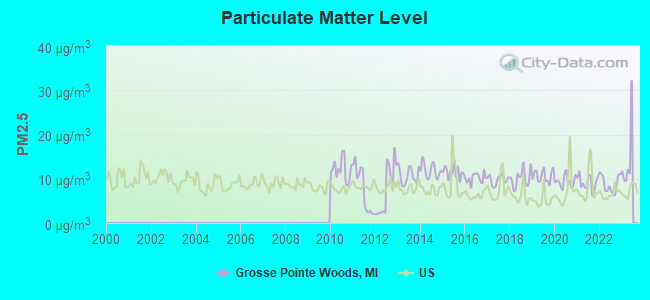
Particulate Matter (PM2.5) [µg/m3] level in 2022 was 8.81. This is about average. Closest monitor was 5.2 miles away from the city center.
| City: | 8.81 |
| U.S.: | 8.11 |
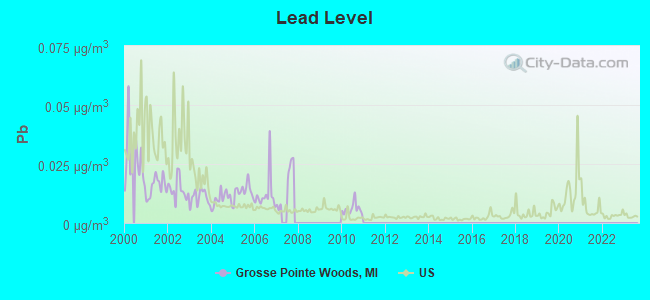
Lead (Pb) [µg/m3] level in 2010 was 0.00597. This is significantly better than average. Closest monitor was 3.7 miles away from the city center.
| City: | 0.00597 |
| U.S.: | 0.00931 |
Tornado activity:
Grosse Pointe Woods-area historical tornado activity is slightly above Michigan state average. It is 12% greater than the overall U.S. average.
On 7/4/1957, a category F4 (max. wind speeds 207-260 mph) tornado 12.7 miles away from the Grosse Pointe Woods city center injured 6 people and caused between $50,000 and $500,000 in damages.
On 5/8/1964, a category F4 tornado 16.6 miles away from the city center killed 11 people and injured 224 people and caused between $500,000 and $5,000,000 in damages.
Earthquake activity:
Grosse Pointe Woods-area historical earthquake activity is significantly above Michigan state average. It is 49% smaller than the overall U.S. average.On 9/25/1998 at 19:52:52, a magnitude 5.2 (4.8 MB, 4.3 MS, 5.2 LG, 4.5 MW, Depth: 3.1 mi, Class: Moderate, Intensity: VI - VII) earthquake occurred 144.3 miles away from Grosse Pointe Woods center
On 1/31/1986 at 16:46:43, a magnitude 5.0 (5.0 MB) earthquake occurred 106.3 miles away from Grosse Pointe Woods center
On 7/12/1986 at 08:19:37, a magnitude 4.5 (4.5 MB, Class: Light, Intensity: IV - V) earthquake occurred 151.9 miles away from the city center
On 7/27/1980 at 18:52:21, a magnitude 5.2 (5.1 MB, 4.7 MS, 5.0 UK, 5.2 UK) earthquake occurred 297.8 miles away from the city center
On 8/23/2011 at 17:51:04, a magnitude 5.8 (5.8 MW, Depth: 3.7 mi) earthquake occurred 408.2 miles away from the city center
On 5/2/2015 at 16:23:07, a magnitude 4.2 (4.2 MW, Depth: 2.8 mi) earthquake occurred 130.1 miles away from the city center
Magnitude types: regional Lg-wave magnitude (LG), body-wave magnitude (MB), surface-wave magnitude (MS), moment magnitude (MW)
Natural disasters:
The number of natural disasters in Wayne County (14) is near the US average (15).Major Disasters (Presidential) Declared: 9
Emergencies Declared: 4
Causes of natural disasters: Storms: 9, Floods: 7, Tornadoes: 3, Blizzard: 1, Hurricane: 1, Power Outage: 1, Snowstorm: 1, Winter Storm: 1, Other: 1 (Note: some incidents may be assigned to more than one category).
Hospitals and medical centers in Grosse Pointe Woods:
Other hospitals and medical centers near Grosse Pointe Woods:
- FUSION HOME HEALTH CARE AGENCY (Home Health Center, about 2 miles away; HARPER WOODS, MI)
- HENRY FORD CONT CARE CTR-BELMO (Nursing Home, about 2 miles away; HARPER WOODS, MI)
- ST JOHN HOSPITAL AND MEDICAL CENTER Acute Care Hospitals (about 2 miles away; DETROIT, MI)
- PRIORITY ONE HOME HEALTH (Home Health Center, about 2 miles away; SAINT CLAIR SHORES, MI)
- FAMILY FIRST HOME CARE, L L C (Home Health Center, about 2 miles away; HARPER WOODS, MI)
- COAST TO COAST SERVICES, INC (Home Health Center, about 2 miles away; SAINT CLAIR SHORES, MI)
- HACKETT AND FABRY HOME HEALTHCARE (Home Health Center, about 2 miles away; SAINT CLAIR SHORES, MI)
Amtrak stations near Grosse Pointe Woods:
- 9 miles: WINDSOR (298 WALKER RD.) . Services: ticket office.
- 11 miles: DETROIT (11 W. BALTIMORE AVE.) . Services: ticket office, partially wheelchair accessible, enclosed waiting area, public restrooms, public payphones, free short-term parking, call for car rental service, taxi stand, public transit connection.
- 14 miles: ROYAL OAK (201 S. SHERMAN DR.) . Services: enclosed waiting area, public payphones, vending machines, paid short-term parking, taxi stand, intercity bus service, public transit connection.
Colleges/universities with over 2000 students nearest to Grosse Pointe Woods:
- Macomb Community College (about 7 miles; Warren, MI; Full-time enrollment: 15,669)
- Baker College of Clinton Township (about 9 miles; Clinton Township, MI; FT enrollment: 3,413)
- Wayne State University (about 11 miles; Detroit, MI; FT enrollment: 20,204)
- Wayne County Community College District (about 12 miles; Detroit, MI; FT enrollment: 10,554)
- University of Detroit Mercy (about 13 miles; Detroit, MI; FT enrollment: 3,406)
- Lawrence Technological University (about 19 miles; Southfield, MI; FT enrollment: 2,430)
- University of Michigan-Dearborn (about 19 miles; Dearborn, MI; FT enrollment: 6,712)
Public high school in Grosse Pointe Woods:
- GROSSE POINTE NORTH HIGH SCHOOL (Students: 1,532, Location: 707 VERNIER RD, Grades: 9-12)
Private high school in Grosse Pointe Woods:
Public elementary/middle schools in Grosse Pointe Woods:
- PARCELLS MIDDLE SCHOOL (Students: 720, Location: 20600 MACK AVE, Grades: 6-8)
- JOHN MONTEITH ELEMENTARY SCHOOL (Students: 576, Location: 1275 COOK RD, Grades: KG-5)
- STEVENS T. MASON ELEMENTARY SCHOOL (Students: 296, Location: 1640 VERNIER RD, Grades: KG-5)
- FERRY ELEMENTARY SCHOOL (Location: 748 ROSLYN RD, Grades: KG-5)
Private elementary/middle school in Grosse Pointe Woods:
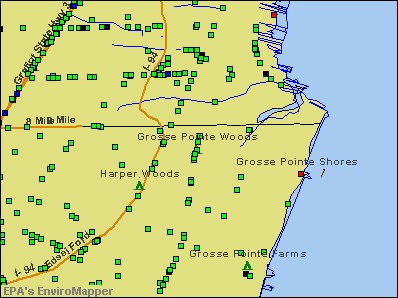
Points of interest:
Notable locations in Grosse Pointe Woods: Lochmoor Country Club (A), Grosse Pointe Woods Department of Public Safety Fire Station (B). Display/hide their locations on the map
Shopping Centers: Pointe Plaza Shopping Center (1), Farmer Jack Shopping Center (2). Display/hide their locations on the map
Churches in Grosse Pointe Woods include: Our Lady Star of the Sea Chruch (A), Grosse Pointe Baptist Church (B), Grosse Pointe Woods Presbyterian Church (C). Display/hide their locations on the map
Parks in Grosse Pointe Woods include: Sweeney Park (1), Children's Home of Detroit Historical Marker (2), Fractional District Number Nine School Historical Marker (3), Ghesquiere Park (4). Display/hide their locations on the map
Birthplace of: Corey Tropp - Ice hockey player, Eric Werner - Ice hockey player, Andy Miele - Ice hockey player.
Drinking water stations with addresses in Grosse Pointe Woods that have no violations reported:
- GROSSE POINTE WOODS (Population served: 16,135, Primary Water Source Type: Purch surface water)
| This city: | 2.5 people |
| Michigan: | 2.5 people |
| This city: | 73.0% |
| Whole state: | 66.0% |
| This city: | 2.9% |
| Whole state: | 6.4% |
Likely homosexual households (counted as self-reported same-sex unmarried-partner households)
- Lesbian couples: 0.3% of all households
- Gay men: 0.3% of all households
66 people in nursing homes in 2000
5 people in religious group quarters in 2000
Banks with branches in Grosse Pointe Woods (2011 data):
- Talmer Bank and Trust: 20276 Mack Avenue Branch at 20276 Mack Avenue, branch established on 2007/09/17; Grosse Pointe Woods Branch at 21110 Mack Ave, branch established on 2008/06/09. Info updated 2011/05/03: Bank assets: $2,126.7 mil, Deposits: $1,722.6 mil, headquarters in Troy, MI, positive income, Commercial Lending Specialization, 56 total offices, Holding Company: Talmer Bancorp Inc.
- Comerica Bank: Mack-Brys Branch at 21303 Mack Avenue, branch established on 1969/10/15; Mack-Lockmoor Branch at 20200 Mack Avenue, branch established on 1952/08/18. Info updated 2011/07/29: Bank assets: $60,970.5 mil, Deposits: $48,300.9 mil, headquarters in Dallas, TX, positive income, Commercial Lending Specialization, 497 total offices, Holding Company: Comerica Incorporated
- First Place Bank: 20247 Mack Avenue Branch at 20247 Mack Avenue, branch established on 1987/06/30. Info updated 2011/07/21: Bank assets: $2,754.5 mil, Deposits: $2,219.6 mil, headquarters in Warren, OH, negative income in the last year, Commercial Lending Specialization, 43 total offices
- Flagstar Bank, FSB: Grosse Pointe Woods Branch at 19733 Mack Avenue, branch established on 2004/12/01. Info updated 2011/07/21: Bank assets: $13,623.5 mil, Deposits: $7,802.8 mil, headquarters in Troy, MI, negative income in the last year, Mortgage Lending Specialization, 135 total offices
- KeyBank National Association: Grosse Pointe Woods Branch at 20100 Mack Avenue, branch established on 1991/07/01. Info updated 2008/03/03: Bank assets: $86,198.8 mil, Deposits: $64,214.8 mil, headquarters in Cleveland, OH, positive income, Commercial Lending Specialization, 1067 total offices, Holding Company: Keycorp
- Citizens Bank: Mack Avenue Branch at 19683 Mack Avenue, branch established on 1989/02/01. Info updated 2011/08/01: Bank assets: $9,212.3 mil, Deposits: $7,452.0 mil, headquarters in Flint, MI, positive income, Commercial Lending Specialization, 220 total offices, Holding Company: Citizens Republic Bancorp, Inc.
- Bank of America, National Association: Grosse Pointe Woods Branch at 19700 Mack Avenue, branch established on 1890/01/01. Info updated 2009/11/18: Bank assets: $1,451,969.3 mil, Deposits: $1,077,176.8 mil, headquarters in Charlotte, NC, positive income, 5782 total offices, Holding Company: Bank Of America Corporation
For population 15 years and over in Grosse Pointe Woods:
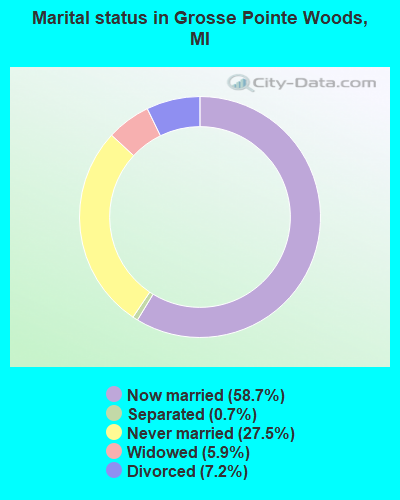
- Never married: 27.5%
- Now married: 58.7%
- Separated: 0.7%
- Widowed: 5.9%
- Divorced: 7.2%
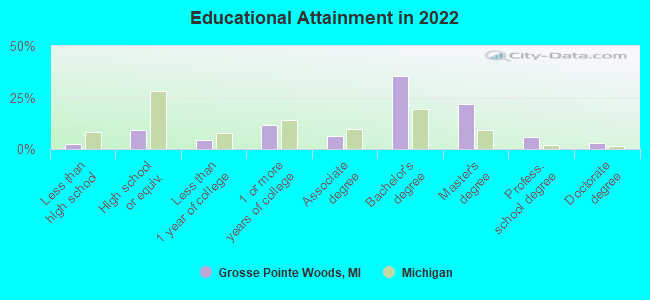
For population 25 years and over in Grosse Pointe Woods:
- High school or higher: 97.5%
- Bachelor's degree or higher: 65.1%
- Graduate or professional degree: 30.0%
- Unemployed: 2.4%
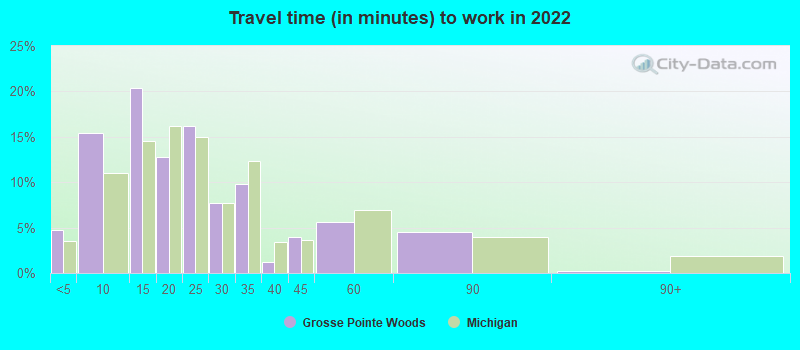
- Mean travel time to work (commute): 18.0 minutes
| Here: | 8.9 |
| Michigan average: | 11.0 |
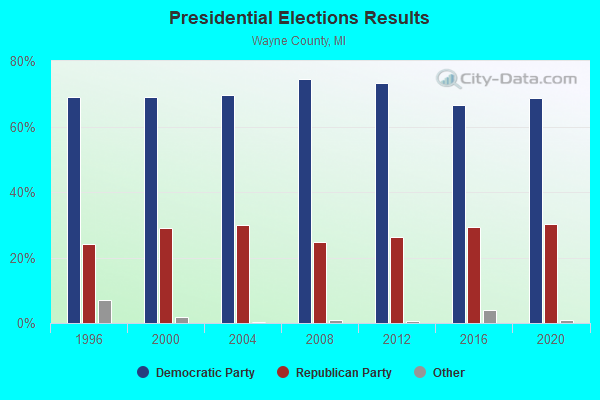
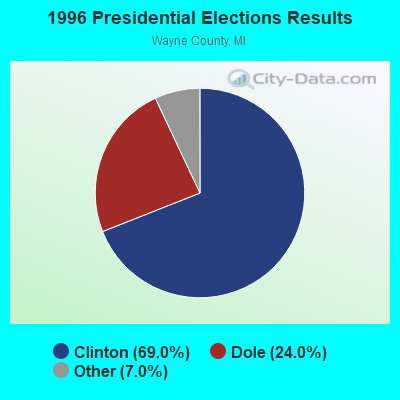
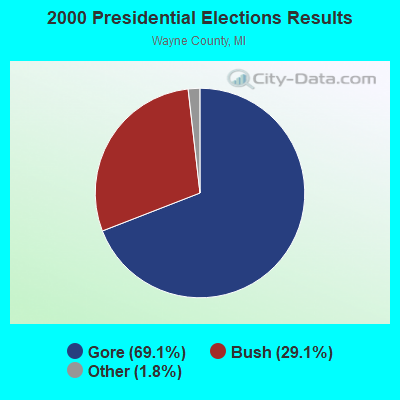
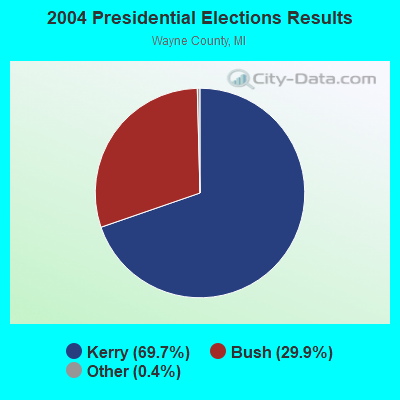
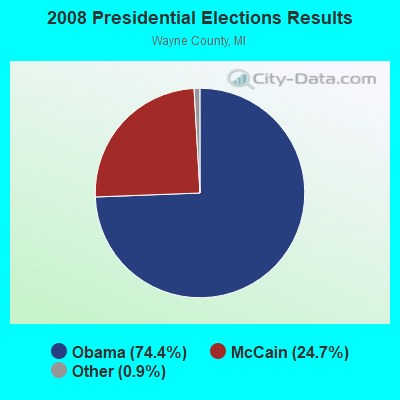
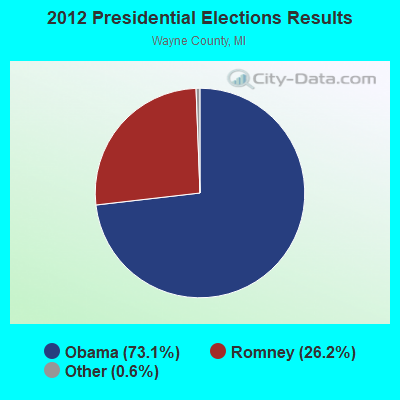
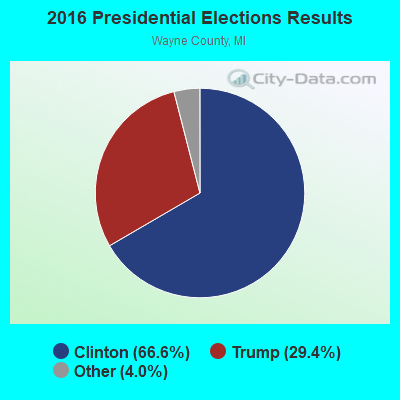
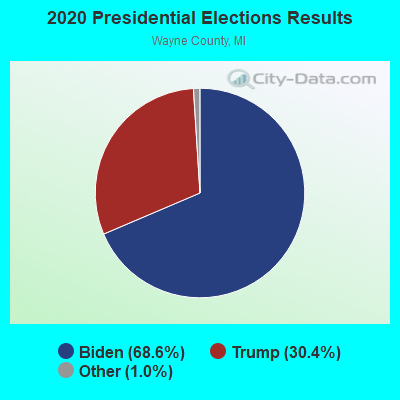
Graphs represent county-level data. Detailed 2008 Election Results
Political contributions by individuals in Grosse Pointe Woods, MI
Religion statistics for Grosse Pointe Woods, MI (based on Wayne County data)

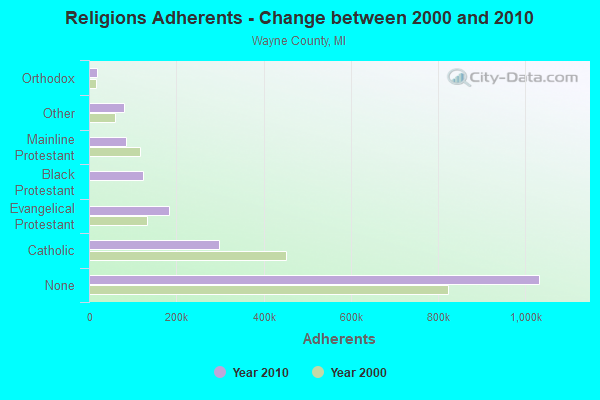
| Religion | Adherents | Congregations |
|---|---|---|
| Catholic | 297,283 | 151 |
| Evangelical Protestant | 183,985 | 527 |
| Black Protestant | 124,432 | 282 |
| Mainline Protestant | 85,387 | 231 |
| Other | 79,840 | 116 |
| Orthodox | 17,580 | 23 |
| None | 1,032,077 | - |
Food Environment Statistics:
| Wayne County: | 2.81 / 10,000 pop. |
| Michigan: | 2.34 / 10,000 pop. |
| This county: | 0.09 / 10,000 pop. |
| Michigan: | 0.18 / 10,000 pop. |
| Wayne County: | 1.48 / 10,000 pop. |
| Michigan: | 1.52 / 10,000 pop. |
| Wayne County: | 2.64 / 10,000 pop. |
| Michigan: | 2.99 / 10,000 pop. |
| Here: | 5.14 / 10,000 pop. |
| Michigan: | 6.80 / 10,000 pop. |
| Wayne County: | 11.6% |
| State: | 9.7% |
| This county: | 33.2% |
| Michigan: | 29.7% |
| Wayne County: | 12.9% |
| Michigan: | 13.4% |
Health and Nutrition:
| Grosse Pointe Woods: | 57.5% |
| Michigan: | 50.3% |
| Grosse Pointe Woods: | 56.9% |
| Michigan: | 47.9% |
| This city: | 27.8 |
| Michigan: | 28.7 |
| Grosse Pointe Woods: | 17.8% |
| Michigan: | 20.6% |
| Grosse Pointe Woods: | 7.6% |
| Michigan: | 10.4% |
| Grosse Pointe Woods: | 7.0 |
| Michigan: | 6.8 |
| This city: | 34.7% |
| Michigan: | 34.1% |
| This city: | 62.0% |
| State: | 57.0% |
| Grosse Pointe Woods: | 79.5% |
| Michigan: | 79.6% |
More about Health and Nutrition of Grosse Pointe Woods, MI Residents
| Local government employment and payroll (March 2022) | |||||
| Function | Full-time employees | Monthly full-time payroll | Average yearly full-time wage | Part-time employees | Monthly part-time payroll |
|---|---|---|---|---|---|
| Police Protection - Officers | 30 | $207,728 | $83,091 | 0 | $0 |
| Other and Unallocable | 15 | $74,124 | $59,299 | 1 | $1,147 |
| Other Government Administration | 8 | $46,956 | $70,434 | 8 | $2,893 |
| Police - Other | 6 | $24,752 | $49,504 | 15 | $20,803 |
| Financial Administration | 6 | $33,182 | $66,364 | 2 | $6,273 |
| Streets and Highways | 6 | $29,003 | $58,006 | 1 | $1,195 |
| Judicial and Legal | 3 | $14,210 | $56,840 | 2 | $4,208 |
| Water Supply | 3 | $14,682 | $58,728 | 1 | $1,218 |
| Parks and Recreation | 2 | $11,827 | $70,962 | 29 | $28,546 |
| Sewerage | 0 | $0 | 1 | $553 | |
| Totals for Government | 79 | $456,464 | $69,336 | 60 | $66,837 |
Grosse Pointe Woods government finances - Expenditure in 2021 (per resident):
- Current Operations - General - Other: $12,854,000 ($796.55)
Sewerage: $7,521,000 ($466.07)
Regular Highways: $2,523,000 ($156.35)
Solid Waste Management: $1,806,000 ($111.92)
Parks and Recreation: $1,541,000 ($95.49)
Central Staff Services: $754,000 ($46.72)
Judicial and Legal Services: $561,000 ($34.76)
Protective Inspection and Regulation - Other: $511,000 ($31.67)
Financial Administration: $450,000 ($27.89)
- General - Interest on Debt: $673,000 ($41.71)
- Other Capital Outlay - General - Other: $4,172,000 ($258.54)
Water Utilities: $1,973,000 ($122.27)
Parks and Recreation: $962,000 ($59.61)
Regular Highways: $688,000 ($42.63)
- Total Salaries and Wages: $5,949,000 ($368.66)
- Water Utilities - Interest on Debt: $211,000 ($13.08)
Grosse Pointe Woods government finances - Revenue in 2021 (per resident):
- Charges - Other: $8,525,000 ($528.29)
Parking Facilities: $391,000 ($24.23)
- Federal Intergovernmental - Other: $496,000 ($30.74)
Housing and Community Development: $20,000 ($1.24)
- Miscellaneous - Fines and Forfeits: $641,000 ($39.72)
General Revenue - Other: $533,000 ($33.03)
Interest Earnings: $96,000 ($5.95)
- State Intergovernmental - General Local Government Support: $2,368,000 ($146.74)
Highways: $1,230,000 ($76.22)
Other: $9,000 ($0.56)
- Tax - Property: $16,303,000 ($1010.29)
Other License: $342,000 ($21.19)
Grosse Pointe Woods government finances - Debt in 2021 (per resident):
- Long Term Debt - Beginning Outstanding - Unspecified Public Purpose: $33,549,000 ($2079.01)
Outstanding Unspecified Public Purpose: $32,771,000 ($2030.80)
Beginning Outstanding - Public Debt for Private Purpose: $6,822,000 ($422.76)
Outstanding Nonguaranteed - Industrial Revenue: $6,074,000 ($376.40)
Retired Unspecified Public Purpose: $2,684,000 ($166.33)
Issue, Unspecified Public Purpose: $1,907,000 ($118.18)
Retired Nonguaranteed - Public Debt for Private Purpose: $748,000 ($46.35)
Grosse Pointe Woods government finances - Cash and Securities in 2021 (per resident):
- Other Funds - Cash and Securities: $26,052,000 ($1614.43)
- Sinking Funds - Cash and Securities: $6,074,000 ($376.40)
4.12% of this county's 2021 resident taxpayers lived in other counties in 2020 ($55,756 average adjusted gross income)
| Here: | 4.12% |
| Michigan average: | 5.83% |
0.01% of residents moved from foreign countries ($67 average AGI)
Wayne County: 0.01% Michigan average: 0.00%
Top counties from which taxpayers relocated into this county between 2020 and 2021:
| from Oakland County, MI | |
| from Macomb County, MI | |
| from Washtenaw County, MI |
5.14% of this county's 2020 resident taxpayers moved to other counties in 2021 ($70,859 average adjusted gross income)
| Here: | 5.14% |
| Michigan average: | 5.95% |
0.00% of residents moved to foreign countries ($38 average AGI)
Wayne County: 0.00% Michigan average: 0.00%
Top counties to which taxpayers relocated from this county between 2020 and 2021:
| to Oakland County, MI | |
| to Macomb County, MI | |
| to Washtenaw County, MI |
| Businesses in Grosse Pointe Woods, MI | ||||
| Name | Count | Name | Count | |
|---|---|---|---|---|
| CVS | 1 | Little Caesars Pizza | 1 | |
| Caribou Coffee | 1 | Men's Wearhouse | 1 | |
| Curves | 1 | Nike | 1 | |
| FedEx | 2 | Quiznos | 1 | |
| GNC | 1 | Subway | 1 | |
| H&R Block | 1 | T-Mobile | 1 | |
| Jimmy John's | 1 | UPS | 1 | |
| Kroger | 1 | |||
Strongest AM radio stations in Grosse Pointe Woods:
- WWJ (950 AM; 50 kW; DETROIT, MI; Owner: INFINITY BROADCASTING OPERATIONS, INC.)
- WXYT (1270 AM; 50 kW; DETROIT, MI; Owner: INFINITY BROADCASTING CORP. OF DETROIT)
- WJR (760 AM; 50 kW; DETROIT, MI; Owner: ABC, INC.)
- WDFN (1130 AM; 50 kW; DETROIT, MI; Owner: AMFM RADIO LICENSES, L.L.C.)
- WCHB (1200 AM; 50 kW; TAYLOR, MI; Owner: RADIO ONE OF DETROIT, LLC)
- WFDF (910 AM; 50 kW; FLINT, MI; Owner: ABC, INC.)
- WUFL (1030 AM; daytime; 5 kW; STERLING HEIGHTS, MI; Owner: FAMILY LIFE BROADCASTING SYSTEM)
- WXDX (1310 AM; 5 kW; DEARBORN, MI; Owner: AMFM RADIO LICENSES, L.L.C.)
- WOAP (1080 AM; 50 kW; OWOSSO, MI)
- WDEO (990 AM; 9 kW; YPSILANTI, MI; Owner: WORD BROADCASTERS, INC.)
- WKNR (850 AM; 50 kW; CLEVELAND, OH; Owner: CARON BROADCASTING, INC.)
- WEXL (1340 AM; 1 kW; ROYAL OAK, MI; Owner: WMUZ RADIO, INC.)
- WQBH (1400 AM; 1 kW; DETROIT, MI; Owner: QUEEN'S BROADCASTING CORP.)
Strongest FM radio stations in Grosse Pointe Woods:
- WDMK (102.7 FM; MOUNT CLEMENS, MI; Owner: RADIO ONE OF DETROIT, LLC)
- WMXD (92.3 FM; DETROIT, MI; Owner: AMFM RADIO LICENSES, L.L.C.)
- WDTW (106.7 FM; DETROIT, MI; Owner: AMFM RADIO LICENSES, L.L.C.)
- WMGC-FM (105.1 FM; DETROIT, MI; Owner: GREATER BOSTON RADIO, INC.)
- WCSX (94.7 FM; BIRMINGHAM, MI; Owner: GREATER BOSTON RADIO, INC.)
- WDET-FM (101.9 FM; DETROIT, MI; Owner: WAYNE STATE UNIVERSITY)
- WDVD (96.3 FM; DETROIT, MI; Owner: ABC, INC.)
- WKRK-FM (97.1 FM; DETROIT, MI; Owner: INFINITY BROADCASTING OPERATIONS, INC.)
- WYCD (99.5 FM; DETROIT, MI; Owner: INFINITY BROADCASTING CORPORATION OF MICHIGAN)
- WDTR-FM (90.9 FM; DETROIT, MI; Owner: BOARD OF EDUCATION, CITY OF DETROIT)
- WRIF (101.1 FM; DETROIT, MI; Owner: GREATER BOSTON RADIO, INC.)
- WJLB (97.9 FM; DETROIT, MI; Owner: AMFM RADIO LICENSES, L.L.C.)
- WNIC (100.3 FM; DEARBORN, MI; Owner: AMFM RADIO LICENSES, L.L.C.)
- WGPR (107.5 FM; DETROIT, MI; Owner: WGPR, INC.)
- WDTJ (105.9 FM; DETROIT, MI; Owner: RADIO ONE OF DETROIT, LLC)
- WDRQ (93.1 FM; DETROIT, MI; Owner: ABC, INC.)
- WVMV (98.7 FM; DETROIT, MI; Owner: INFINITY BROADCASTING OPERATIONS, INC.)
- WOMC (104.3 FM; DETROIT, MI; Owner: INFINITY BROADCASTING CORPORATION OF MICHIGAN)
- WKQI (95.5 FM; DETROIT, MI; Owner: AMFM RADIO LICENSES, L.L.C.)
- WMUZ (103.5 FM; DETROIT, MI; Owner: WMUZ RADIO, INC.)
TV broadcast stations around Grosse Pointe Woods:
- W48AV (Channel 48; DETROIT, MI; Owner: PAXSON COMMUNICATIONS LICENSE COMPANY, LLC)
- WADL (Channel 38; MOUNT CLEMENS, MI; Owner: ADELL BROADCASTING CORPORATION)
- WJBK (Channel 2; DETROIT, MI; Owner: FOX TELEVISION STATIONS, INC.)
- WWJ-TV (Channel 62; DETROIT, MI; Owner: CBS BROADCASTING INC.)
- WDWB (Channel 20; DETROIT, MI; Owner: WXON LICENSE, INC.)
- WTVS (Channel 56; DETROIT, MI; Owner: DETROIT EDUC. TV FOUNDATION)
- WBXD-CA (Channel 5; DETROIT, MI; Owner: THE BOX WORLDWIDE LLC)
- WXYZ-TV (Channel 7; DETROIT, MI; Owner: CHANNEL 7 OF DETROIT, INC.)
- WDIV-TV (Channel 4; DETROIT, MI; Owner: POST-NEWSWEEK STATIONS, MICHIGAN, INC.)
- WLPC-LP (Channel 26; DETROIT, MI; Owner: GLENN R. AND KARIN A. PLUMMER)
- WKBD (Channel 50; DETROIT, MI; Owner: VIACOM STATIONS GROUP OF DETROIT INC.)
- WDWO-CA (Channel 18; DETROIT, MI; Owner: TCT OF MICHIGAN, INC.)
- W33BY (Channel 68; DETROIT, MI; Owner: HIGHLAND PARK BROADCASTING, L.P.)
FCC Registered Broadcast Land Mobile Towers:
5- Lat: 42.443611 Lon: -82.906833, Call Sign: WQMZ780, Licensee ID: L00031867,
Assigned Frequencies: 451.312 MHz, Grant Date: 11/18/2010, Expiration Date: 11/18/2020, Cancellation Date: 01/23/2021, Certifier: Joseph Ahee, Registrant: City Of Grosse Pointe Woods, 20025 Mack Plaza Dr., Grosse Pointe Woods, MI 48236, Phone: (313) 343-2460, Fax: (313) 343-2622
- Lat: 42.433083 Lon: -82.908694, Call Sign: WQQA321,
Assigned Frequencies: 155.340 MHz, Grant Date: 09/30/2022, Expiration Date: 10/02/2032, Certifier: Andrew Pazuchowski, Registrant: Business Radio Licensing, 20025 Mack Plaza Drive, Grosse Pointe Woods, MI 48225, Phone: (313) 343-2419, Fax: (313) 343-9941, Email:
- Lat: 42.435278 Lon: -82.893611, Call Sign: WQWZ875,
Assigned Frequencies: 452.137 MHz, 452.187 MHz, 452.637 MHz, 457.137 MHz, 457.187 MHz, Grant Date: 01/11/2016, Expiration Date: 01/11/2026, Certifier: Leslie Lindbloom, Registrant: Hawkeye Licensing, Crestwood, KY 40014, Phone: (502) 381-8050, Email:
- Lat: 42.442833 Lon: -82.901389, Call Sign: WRNN328,
Assigned Frequencies: 72.3400 MHz, Grant Date: 07/29/2021, Expiration Date: 07/29/2031, Certifier: Chris Stanley, Registrant: Primex Wireless, Inc., 965 S. Wells St., Lake Geneva, WI 53147, Phone: (262) 729-4858, Email:
- Lat: 42.424333 Lon: -82.900833, Call Sign: WRVB801,
Assigned Frequencies: 451.362 MHz, 457.112 MHz, 467.462 MHz, 452.837 MHz, 457.837 MHz, Grant Date: 11/01/2022, Expiration Date: 11/01/2032, Certifier: Anca Mitchell, Registrant: Bearcom, 4009 Distribution Drive, Bldg 200, Garland, TX 75041, Phone: (800) 458-9887, Email:
FCC Registered Microwave Towers:
1- Se Cor Of Int Of I94 & 8 Mile Rd (Lat: 42.450583 Lon: -82.916556), Overall height: 25.9 m, Call Sign: WPNE811,
Assigned Frequencies: 23475.0 MHz, Grant Date: 05/09/2012, Expiration Date: 06/30/2022, Cancellation Date: 03/26/2020, Registrant: Michigan Department Of Transportation, 8885 Ricks Road, Lansing, MI 48909, Phone: (517) 636-0635, Email:
FCC Registered Paging Towers:
1- 19755 Mack Avenue (Lat: 42.428361 Lon: -82.911028), Type: Nntann, Structure height: 18.3 m, Call Sign: KNKD334,
Assigned Frequencies: 152.840 MHz, Grant Date: 06/01/1999, Expiration Date: 04/01/2009, Cancellation Date: 02/09/2005, Registrant: Ameritech Mobile Services, Inc., 2000 West Ameritech Center Drive, Location 2g81, Hoffman Estates, IL 60195-5000, Phone: (847) 248-4740, Fax: (847) 248-2674
FCC Registered Amateur Radio Licenses:
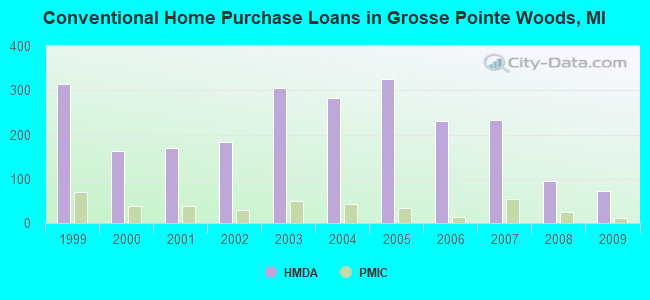
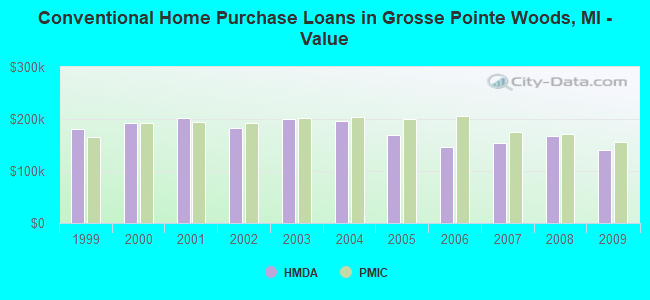
49 (See the full list of FCC Registered Amateur Radio Licenses in Grosse Pointe Woods)| Home Mortgage Disclosure Act Aggregated Statistics For Year 2009 (Based on 4 full tracts) | ||||||||||||
| A) FHA, FSA/RHS & VA Home Purchase Loans | B) Conventional Home Purchase Loans | C) Refinancings | D) Home Improvement Loans | F) Non-occupant Loans on < 5 Family Dwellings (A B C & D) | G) Loans On Manufactured Home Dwelling (A B C & D) | |||||||
|---|---|---|---|---|---|---|---|---|---|---|---|---|
| Number | Average Value | Number | Average Value | Number | Average Value | Number | Average Value | Number | Average Value | Number | Average Value | |
| LOANS ORIGINATED | 75 | $141,107 | 72 | $140,056 | 274 | $175,602 | 7 | $40,571 | 13 | $79,846 | 0 | $0 |
| APPLICATIONS APPROVED, NOT ACCEPTED | 6 | $120,167 | 3 | $188,000 | 34 | $183,559 | 1 | $20,000 | 0 | $0 | 0 | $0 |
| APPLICATIONS DENIED | 11 | $163,364 | 15 | $88,600 | 98 | $179,898 | 11 | $29,000 | 9 | $82,444 | 1 | $10,000 |
| APPLICATIONS WITHDRAWN | 8 | $111,875 | 2 | $115,000 | 49 | $180,796 | 1 | $7,000 | 0 | $0 | 0 | $0 |
| FILES CLOSED FOR INCOMPLETENESS | 1 | $74,000 | 4 | $109,750 | 22 | $203,545 | 0 | $0 | 1 | $60,000 | 0 | $0 |
Detailed HMDA statistics for the following Tracts: 5511.00 , 5512.00, 5517.00, 5518.00
| Private Mortgage Insurance Companies Aggregated Statistics For Year 2009 (Based on 4 full tracts) | ||||
| A) Conventional Home Purchase Loans | B) Refinancings | |||
|---|---|---|---|---|
| Number | Average Value | Number | Average Value | |
| LOANS ORIGINATED | 11 | $155,364 | 11 | $211,727 |
| APPLICATIONS APPROVED, NOT ACCEPTED | 2 | $106,000 | 2 | $239,000 |
| APPLICATIONS DENIED | 2 | $183,000 | 2 | $123,500 |
| APPLICATIONS WITHDRAWN | 2 | $127,500 | 2 | $124,000 |
| FILES CLOSED FOR INCOMPLETENESS | 0 | $0 | 1 | $124,000 |
Detailed PMIC statistics for the following Tracts: 5511.00 , 5512.00, 5517.00, 5518.00
2002 - 2018 National Fire Incident Reporting System (NFIRS) incidents
- Fire incident types reported to NFIRS in Grosse Pointe Woods, MI
- 20451.6%Structure Fires
- 7118.0%Other
- 6717.0%Outside Fires
- 5313.4%Mobile Property/Vehicle Fires
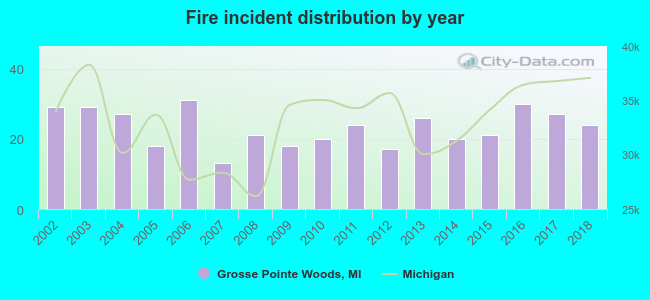 According to the data from the years 2002 - 2018 the average number of fires per year is 23. The highest number of fire incidents - 31 took place in 2006, and the least - 13 in 2007. The data has a declining trend.
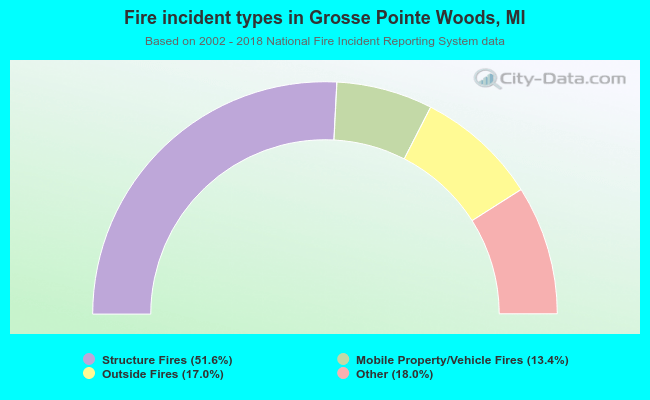 When looking into fire subcategories, the most incidents belonged to: Structure Fires (51.6%), and Other (18.0%).
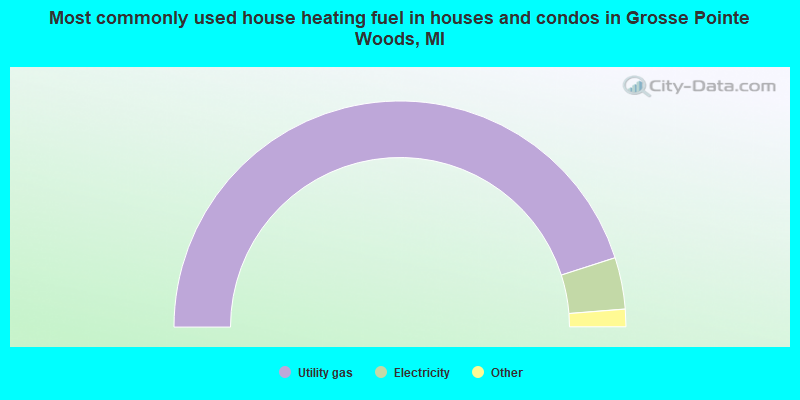
- 90.1%Utility gas
- 7.4%Electricity
- 2.0%Bottled, tank, or LP gas
- 0.2%No fuel used
- 0.2%Wood
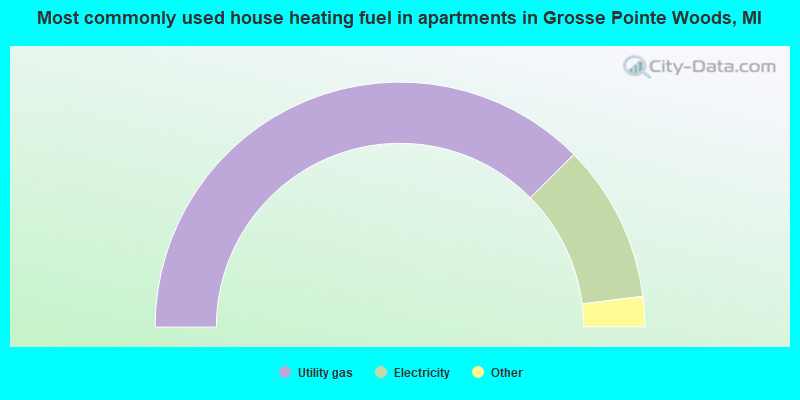
- 75.3%Utility gas
- 20.9%Electricity
- 2.0%No fuel used
- 1.2%Wood
- 0.6%Fuel oil, kerosene, etc.
Grosse Pointe Woods compared to Michigan state average:
- Median household income above state average.
- Median house value above state average.
- Unemployed percentage significantly below state average.
- Black race population percentage below state average.
- Hispanic race population percentage below state average.
- Median age above state average.
- Renting percentage significantly below state average.
- Number of rooms per house above state average.
- House age above state average.
- Percentage of population with a bachelor's degree or higher significantly above state average.
Grosse Pointe Woods on our top lists:
- #99 on the list of "Top 101 cities with largest percentage of males in occupations: arts, design, entertainment, sports, and media occupations (population 5,000+)"
- #3 on the list of "Top 101 counties with the most Black Protestant adherents"
- #4 on the list of "Top 101 counties with the most Catholic congregations"
- #4 on the list of "Top 101 counties with the most Black Protestant congregations"
- #4 on the list of "Top 101 counties with the highest surface withdrawal of fresh water for public supply"
- #5 on the list of "Top 101 counties with the largest number of people moving out compared to moving in (pop. 50,000+)"

|
|
Total of 319 patent applications in 2008-2024.