Grosse Pointe, Michigan Submit your own pictures of this city and show them to the world
OSM Map
General Map
Google Map
MSN Map
OSM Map
General Map
Google Map
MSN Map
OSM Map
General Map
Google Map
MSN Map
OSM Map
General Map
Google Map
MSN Map
Please wait while loading the map...
Population in 2022: 5,551 (100% urban, 0% rural). Population change since 2000: -2.1%Males: 2,497 Females: 3,054
March 2022 cost of living index in Grosse Pointe: 98.4 (near average, U.S. average is 100) Percentage of residents living in poverty in 2022: 1.9%for White Non-Hispanic residents , 4.5% for Black residents , 1.7% for Hispanic or Latino residents , 4.9% for two or more races residents )
Profiles of local businesses
Business Search - 14 Million verified businesses
Data:
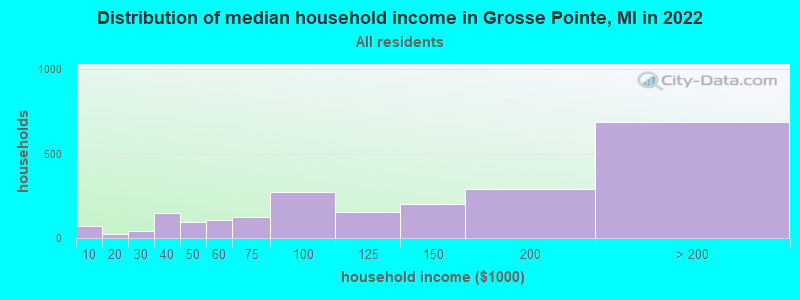
Median household income ($)
Median household income (% change since 2000)
Household income diversity
Ratio of average income to average house value (%)
Ratio of average income to average rent
Median household income ($) - White
Median household income ($) - Black or African American
Median household income ($) - Asian
Median household income ($) - Hispanic or Latino
Median household income ($) - American Indian and Alaska Native
Median household income ($) - Multirace
Median household income ($) - Other Race
Median household income for houses/condos with a mortgage ($)
Median household income for apartments without a mortgage ($)
Races - White alone (%)
Races - White alone (% change since 2000)
Races - Black alone (%)
Races - Black alone (% change since 2000)
Races - American Indian alone (%)
Races - American Indian alone (% change since 2000)
Races - Asian alone (%)
Races - Asian alone (% change since 2000)
Races - Hispanic (%)
Races - Hispanic (% change since 2000)
Races - Native Hawaiian and Other Pacific Islander alone (%)
Races - Native Hawaiian and Other Pacific Islander alone (% change since 2000)
Races - Two or more races (%)
Races - Two or more races (% change since 2000)
Races - Other race alone (%)
Races - Other race alone (% change since 2000)
Racial diversity
Unemployment (%)
Unemployment (% change since 2000)
Unemployment (%) - White
Unemployment (%) - Black or African American
Unemployment (%) - Asian
Unemployment (%) - Hispanic or Latino
Unemployment (%) - American Indian and Alaska Native
Unemployment (%) - Multirace
Unemployment (%) - Other Race
Population density (people per square mile)
Population - Males (%)
Population - Females (%)
Population - Males (%) - White
Population - Males (%) - Black or African American
Population - Males (%) - Asian
Population - Males (%) - Hispanic or Latino
Population - Males (%) - American Indian and Alaska Native
Population - Males (%) - Multirace
Population - Males (%) - Other Race
Population - Females (%) - White
Population - Females (%) - Black or African American
Population - Females (%) - Asian
Population - Females (%) - Hispanic or Latino
Population - Females (%) - American Indian and Alaska Native
Population - Females (%) - Multirace
Population - Females (%) - Other Race
Coronavirus confirmed cases (Apr 27, 2024)
Deaths caused by coronavirus (Apr 27, 2024)
Coronavirus confirmed cases (per 100k population) (Apr 27, 2024)
Deaths caused by coronavirus (per 100k population) (Apr 27, 2024)
Daily increase in number of cases (Apr 27, 2024)
Weekly increase in number of cases (Apr 27, 2024)
Cases doubled (in days) (Apr 27, 2024)
Hospitalized patients (Apr 18, 2022)
Negative test results (Apr 18, 2022)
Total test results (Apr 18, 2022)
COVID Vaccine doses distributed (per 100k population) (Sep 19, 2023)
COVID Vaccine doses administered (per 100k population) (Sep 19, 2023)
COVID Vaccine doses distributed (Sep 19, 2023)
COVID Vaccine doses administered (Sep 19, 2023)
Likely homosexual households (%)
Likely homosexual households (% change since 2000)
Likely homosexual households - Lesbian couples (%)
Likely homosexual households - Lesbian couples (% change since 2000)
Likely homosexual households - Gay men (%)
Likely homosexual households - Gay men (% change since 2000)
Cost of living index
Median gross rent ($)
Median contract rent ($)
Median monthly housing costs ($)
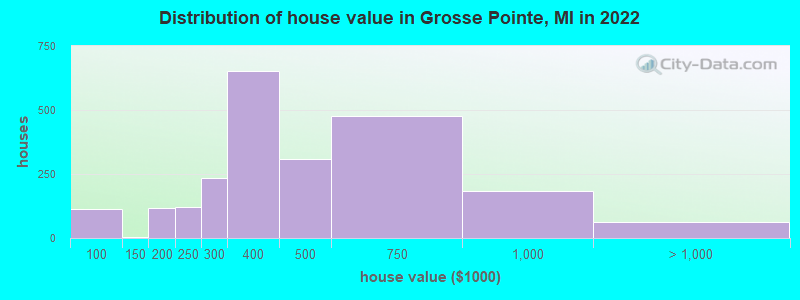
Median house or condo value ($)
Median house or condo value ($ change since 2000)
Mean house or condo value by units in structure - 1, detached ($)
Mean house or condo value by units in structure - 1, attached ($)
Mean house or condo value by units in structure - 2 ($)
Mean house or condo value by units in structure by units in structure - 3 or 4 ($)
Mean house or condo value by units in structure - 5 or more ($)
Mean house or condo value by units in structure - Boat, RV, van, etc. ($)
Mean house or condo value by units in structure - Mobile home ($)
Median house or condo value ($) - White
Median house or condo value ($) - Black or African American
Median house or condo value ($) - Asian
Median house or condo value ($) - Hispanic or Latino
Median house or condo value ($) - American Indian and Alaska Native
Median house or condo value ($) - Multirace
Median house or condo value ($) - Other Race
Median resident age
Resident age diversity
Median resident age - Males
Median resident age - Females
Median resident age - White
Median resident age - Black or African American
Median resident age - Asian
Median resident age - Hispanic or Latino
Median resident age - American Indian and Alaska Native
Median resident age - Multirace
Median resident age - Other Race
Median resident age - Males - White
Median resident age - Males - Black or African American
Median resident age - Males - Asian
Median resident age - Males - Hispanic or Latino
Median resident age - Males - American Indian and Alaska Native
Median resident age - Males - Multirace
Median resident age - Males - Other Race
Median resident age - Females - White
Median resident age - Females - Black or African American
Median resident age - Females - Asian
Median resident age - Females - Hispanic or Latino
Median resident age - Females - American Indian and Alaska Native
Median resident age - Females - Multirace
Median resident age - Females - Other Race
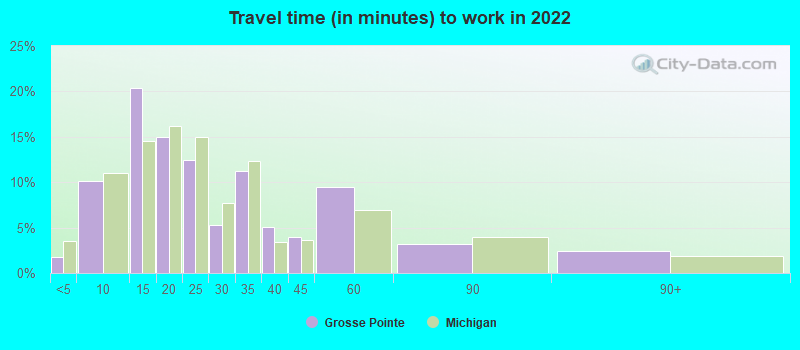
Commute - mean travel time to work (minutes)
Travel time to work - Less than 5 minutes (%)
Travel time to work - Less than 5 minutes (% change since 2000)
Travel time to work - 5 to 9 minutes (%)
Travel time to work - 5 to 9 minutes (% change since 2000)
Travel time to work - 10 to 19 minutes (%)
Travel time to work - 10 to 19 minutes (% change since 2000)
Travel time to work - 20 to 29 minutes (%)
Travel time to work - 20 to 29 minutes (% change since 2000)
Travel time to work - 30 to 39 minutes (%)
Travel time to work - 30 to 39 minutes (% change since 2000)
Travel time to work - 40 to 59 minutes (%)
Travel time to work - 40 to 59 minutes (% change since 2000)
Travel time to work - 60 to 89 minutes (%)
Travel time to work - 60 to 89 minutes (% change since 2000)
Travel time to work - 90 or more minutes (%)
Travel time to work - 90 or more minutes (% change since 2000)
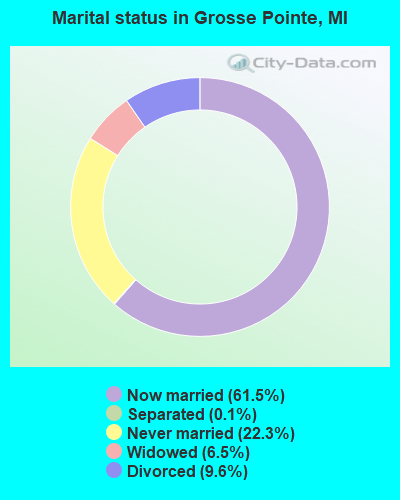
Marital status - Never married (%)
Marital status - Now married (%)
Marital status - Separated (%)
Marital status - Widowed (%)
Marital status - Divorced (%)
Median family income ($)
Median family income (% change since 2000)
Median non-family income ($)
Median non-family income (% change since 2000)
Median per capita income ($)
Median per capita income (% change since 2000)
Median family income ($) - White
Median family income ($) - Black or African American
Median family income ($) - Asian
Median family income ($) - Hispanic or Latino
Median family income ($) - American Indian and Alaska Native
Median family income ($) - Multirace
Median family income ($) - Other Race
Median year house/condo built
Median year apartment built
Year house built - Built 2005 or later (%)
Year house built - Built 2000 to 2004 (%)
Year house built - Built 1990 to 1999 (%)
Year house built - Built 1980 to 1989 (%)
Year house built - Built 1970 to 1979 (%)
Year house built - Built 1960 to 1969 (%)
Year house built - Built 1950 to 1959 (%)
Year house built - Built 1940 to 1949 (%)
Year house built - Built 1939 or earlier (%)
Average household size
Household density (households per square mile)
Average household size - White
Average household size - Black or African American
Average household size - Asian
Average household size - Hispanic or Latino
Average household size - American Indian and Alaska Native
Average household size - Multirace
Average household size - Other Race
Occupied housing units (%)
Vacant housing units (%)
Owner occupied housing units (%)
Renter occupied housing units (%)
Vacancy status - For rent (%)
Vacancy status - For sale only (%)
Vacancy status - Rented or sold, not occupied (%)
Vacancy status - For seasonal, recreational, or occasional use (%)
Vacancy status - For migrant workers (%)
Vacancy status - Other vacant (%)
Residents with income below the poverty level (%)
Residents with income below 50% of the poverty level (%)
Children below poverty level (%)
Poor families by family type - Married-couple family (%)
Poor families by family type - Male, no wife present (%)
Poor families by family type - Female, no husband present (%)
Poverty status for native-born residents (%)
Poverty status for foreign-born residents (%)
Poverty among high school graduates not in families (%)
Poverty among people who did not graduate high school not in families (%)
Residents with income below the poverty level (%) - White
Residents with income below the poverty level (%) - Black or African American
Residents with income below the poverty level (%) - Asian
Residents with income below the poverty level (%) - Hispanic or Latino
Residents with income below the poverty level (%) - American Indian and Alaska Native
Residents with income below the poverty level (%) - Multirace
Residents with income below the poverty level (%) - Other Race
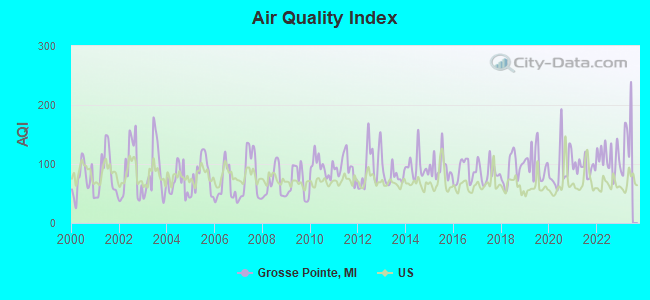
Air pollution - Air Quality Index (AQI)
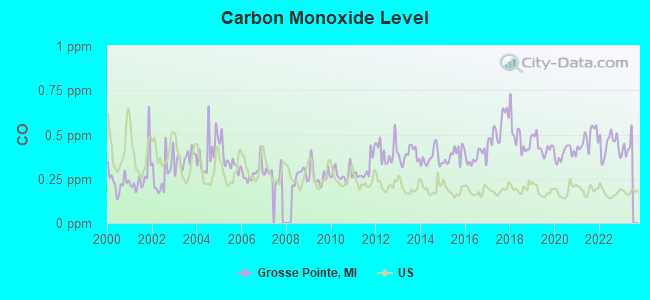
Air pollution - CO
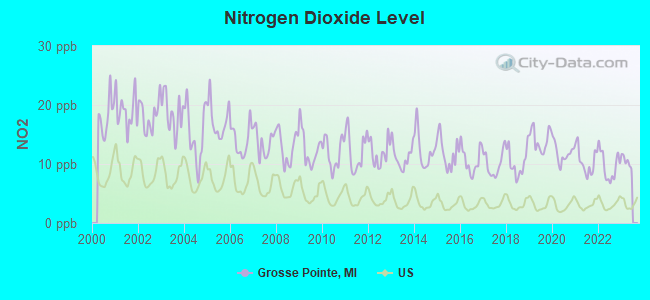
Air pollution - NO2
Air pollution - SO2
Air pollution - Ozone
Air pollution - PM10
Air pollution - PM25
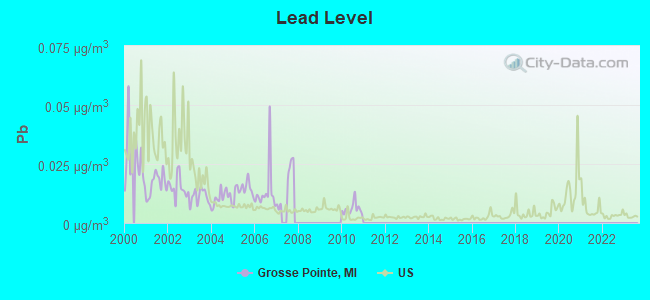
Air pollution - Pb
Crime - Murders per 100,000 population
Crime - Rapes per 100,000 population
Crime - Robberies per 100,000 population
Crime - Assaults per 100,000 population
Crime - Burglaries per 100,000 population
Crime - Thefts per 100,000 population
Crime - Auto thefts per 100,000 population
Crime - Arson per 100,000 population
Crime - City-data.com crime index
Crime - Violent crime index
Crime - Property crime index
Crime - Murders per 100,000 population (5 year average)
Crime - Rapes per 100,000 population (5 year average)
Crime - Robberies per 100,000 population (5 year average)
Crime - Assaults per 100,000 population (5 year average)
Crime - Burglaries per 100,000 population (5 year average)
Crime - Thefts per 100,000 population (5 year average)
Crime - Auto thefts per 100,000 population (5 year average)
Crime - Arson per 100,000 population (5 year average)
Crime - City-data.com crime index (5 year average)
Crime - Violent crime index (5 year average)
Crime - Property crime index (5 year average)
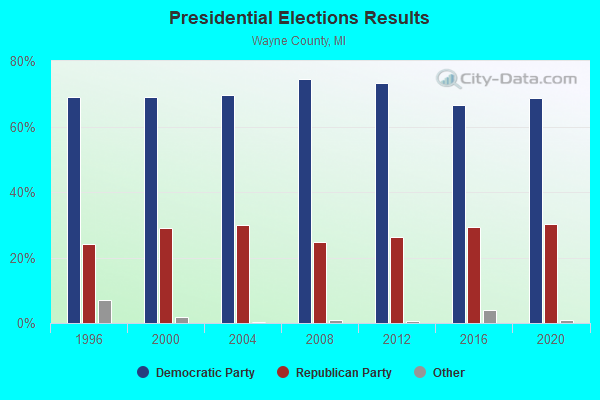
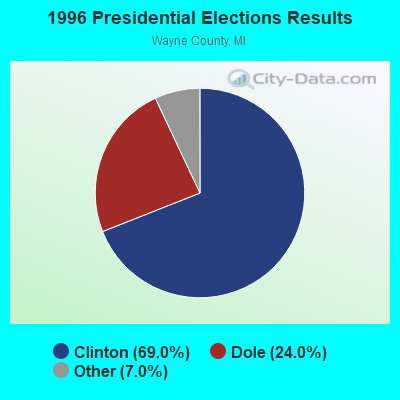
1996 Presidential Elections Results (%) - Democratic Party (Clinton)
1996 Presidential Elections Results (%) - Republican Party (Dole)
1996 Presidential Elections Results (%) - Other
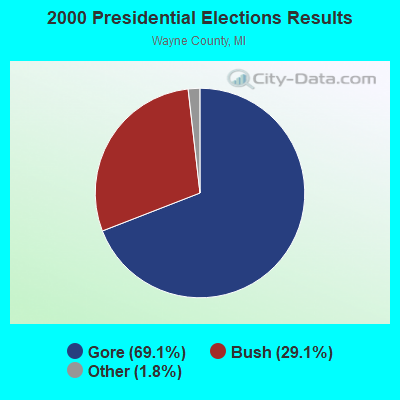
2000 Presidential Elections Results (%) - Democratic Party (Gore)
2000 Presidential Elections Results (%) - Republican Party (Bush)
2000 Presidential Elections Results (%) - Other
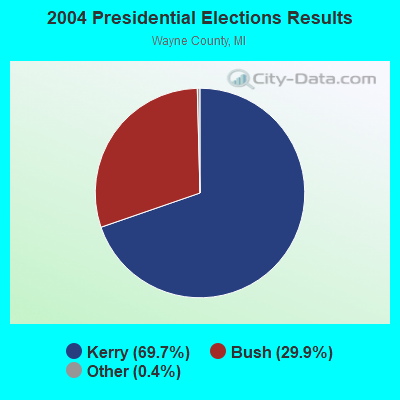
2004 Presidential Elections Results (%) - Democratic Party (Kerry)
2004 Presidential Elections Results (%) - Republican Party (Bush)
2004 Presidential Elections Results (%) - Other
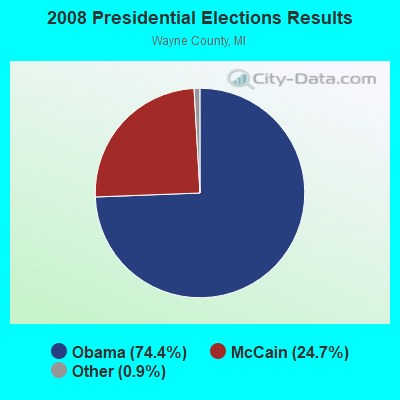
2008 Presidential Elections Results (%) - Democratic Party (Obama)
2008 Presidential Elections Results (%) - Republican Party (McCain)
2008 Presidential Elections Results (%) - Other
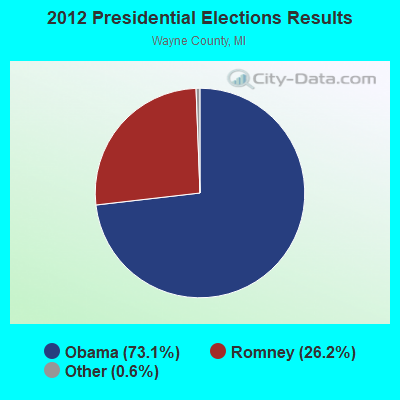
2012 Presidential Elections Results (%) - Democratic Party (Obama)
2012 Presidential Elections Results (%) - Republican Party (Romney)
2012 Presidential Elections Results (%) - Other
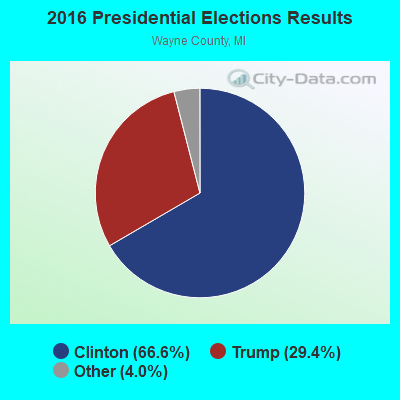
2016 Presidential Elections Results (%) - Democratic Party (Clinton)
2016 Presidential Elections Results (%) - Republican Party (Trump)
2016 Presidential Elections Results (%) - Other
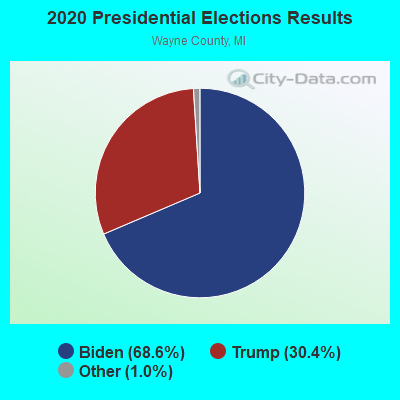
2020 Presidential Elections Results (%) - Democratic Party (Biden)
2020 Presidential Elections Results (%) - Republican Party (Trump)
2020 Presidential Elections Results (%) - Other
Ancestries Reported - Arab (%)
Ancestries Reported - Czech (%)
Ancestries Reported - Danish (%)
Ancestries Reported - Dutch (%)
Ancestries Reported - English (%)
Ancestries Reported - French (%)
Ancestries Reported - French Canadian (%)
Ancestries Reported - German (%)
Ancestries Reported - Greek (%)
Ancestries Reported - Hungarian (%)
Ancestries Reported - Irish (%)
Ancestries Reported - Italian (%)
Ancestries Reported - Lithuanian (%)
Ancestries Reported - Norwegian (%)
Ancestries Reported - Polish (%)
Ancestries Reported - Portuguese (%)
Ancestries Reported - Russian (%)
Ancestries Reported - Scotch-Irish (%)
Ancestries Reported - Scottish (%)
Ancestries Reported - Slovak (%)
Ancestries Reported - Subsaharan African (%)
Ancestries Reported - Swedish (%)
Ancestries Reported - Swiss (%)
Ancestries Reported - Ukrainian (%)
Ancestries Reported - United States (%)
Ancestries Reported - Welsh (%)
Ancestries Reported - West Indian (%)
Ancestries Reported - Other (%)
Educational Attainment - No schooling completed (%)
Educational Attainment - Less than high school (%)
Educational Attainment - High school or equivalent (%)
Educational Attainment - Less than 1 year of college (%)
Educational Attainment - 1 or more years of college (%)
Educational Attainment - Associate degree (%)
Educational Attainment - Bachelor's degree (%)
Educational Attainment - Master's degree (%)
Educational Attainment - Professional school degree (%)
Educational Attainment - Doctorate degree (%)
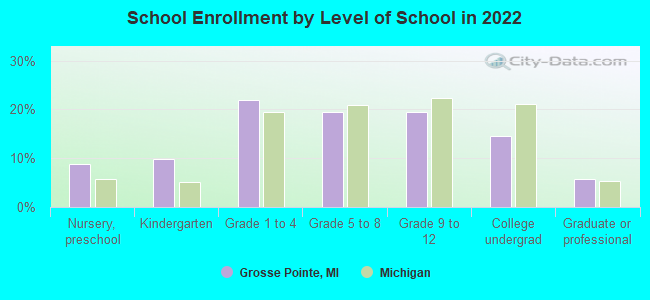
School Enrollment - Nursery, preschool (%)
School Enrollment - Kindergarten (%)
School Enrollment - Grade 1 to 4 (%)
School Enrollment - Grade 5 to 8 (%)
School Enrollment - Grade 9 to 12 (%)
School Enrollment - College undergrad (%)
School Enrollment - Graduate or professional (%)
School Enrollment - Not enrolled in school (%)
School enrollment - Public schools (%)
School enrollment - Private schools (%)
School enrollment - Not enrolled (%)
Median number of rooms in houses and condos
Median number of rooms in apartments
Housing units lacking complete plumbing facilities (%)
Housing units lacking complete kitchen facilities (%)
Density of houses
Urban houses (%)
Rural houses (%)
Households with people 60 years and over (%)
Households with people 65 years and over (%)
Households with people 75 years and over (%)
Households with one or more nonrelatives (%)
Households with no nonrelatives (%)
Population in households (%)
Family households (%)
Nonfamily households (%)
Population in families (%)
Family households with own children (%)
Median number of bedrooms in owner occupied houses
Mean number of bedrooms in owner occupied houses
Median number of bedrooms in renter occupied houses
Mean number of bedrooms in renter occupied houses
Median number of vehichles in owner occupied houses
Mean number of vehichles in owner occupied houses
Median number of vehichles in renter occupied houses
Mean number of vehichles in renter occupied houses
Mortgage status - with mortgage (%)
Mortgage status - with second mortgage (%)
Mortgage status - with home equity loan (%)
Mortgage status - with both second mortgage and home equity loan (%)
Mortgage status - without a mortgage (%)
Average family size
Average family size - White
Average family size - Black or African American
Average family size - Asian
Average family size - Hispanic or Latino
Average family size - American Indian and Alaska Native
Average family size - Multirace
Average family size - Other Race
Geographical mobility - Same house 1 year ago (%)
Geographical mobility - Moved within same county (%)
Geographical mobility - Moved from different county within same state (%)
Geographical mobility - Moved from different state (%)
Geographical mobility - Moved from abroad (%)
Place of birth - Born in state of residence (%)
Place of birth - Born in other state (%)
Place of birth - Native, outside of US (%)
Place of birth - Foreign born (%)
Housing units in structures - 1, detached (%)
Housing units in structures - 1, attached (%)
Housing units in structures - 2 (%)
Housing units in structures - 3 or 4 (%)
Housing units in structures - 5 to 9 (%)
Housing units in structures - 10 to 19 (%)
Housing units in structures - 20 to 49 (%)
Housing units in structures - 50 or more (%)
Housing units in structures - Mobile home (%)
Housing units in structures - Boat, RV, van, etc. (%)
House/condo owner moved in on average (years ago)
Renter moved in on average (years ago)
Year householder moved into unit - Moved in 1999 to March 2000 (%)
Year householder moved into unit - Moved in 1995 to 1998 (%)
Year householder moved into unit - Moved in 1990 to 1994 (%)
Year householder moved into unit - Moved in 1980 to 1989 (%)
Year householder moved into unit - Moved in 1970 to 1979 (%)
Year householder moved into unit - Moved in 1969 or earlier (%)
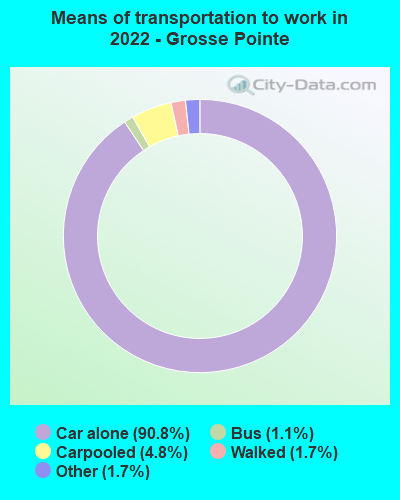
Means of transportation to work - Drove car alone (%)
Means of transportation to work - Carpooled (%)
Means of transportation to work - Public transportation (%)
Means of transportation to work - Bus or trolley bus (%)
Means of transportation to work - Streetcar or trolley car (%)
Means of transportation to work - Subway or elevated (%)
Means of transportation to work - Railroad (%)
Means of transportation to work - Ferryboat (%)
Means of transportation to work - Taxicab (%)
Means of transportation to work - Motorcycle (%)
Means of transportation to work - Bicycle (%)
Means of transportation to work - Walked (%)
Means of transportation to work - Other means (%)
Working at home (%)
Industry diversity
Most Common Industries - Agriculture, forestry, fishing and hunting, and mining (%)
Most Common Industries - Agriculture, forestry, fishing and hunting (%)
Most Common Industries - Mining, quarrying, and oil and gas extraction (%)
Most Common Industries - Construction (%)
Most Common Industries - Manufacturing (%)
Most Common Industries - Wholesale trade (%)
Most Common Industries - Retail trade (%)
Most Common Industries - Transportation and warehousing, and utilities (%)
Most Common Industries - Transportation and warehousing (%)
Most Common Industries - Utilities (%)
Most Common Industries - Information (%)
Most Common Industries - Finance and insurance, and real estate and rental and leasing (%)
Most Common Industries - Finance and insurance (%)
Most Common Industries - Real estate and rental and leasing (%)
Most Common Industries - Professional, scientific, and management, and administrative and waste management services (%)
Most Common Industries - Professional, scientific, and technical services (%)
Most Common Industries - Management of companies and enterprises (%)
Most Common Industries - Administrative and support and waste management services (%)
Most Common Industries - Educational services, and health care and social assistance (%)
Most Common Industries - Educational services (%)
Most Common Industries - Health care and social assistance (%)
Most Common Industries - Arts, entertainment, and recreation, and accommodation and food services (%)
Most Common Industries - Arts, entertainment, and recreation (%)
Most Common Industries - Accommodation and food services (%)
Most Common Industries - Other services, except public administration (%)
Most Common Industries - Public administration (%)
Occupation diversity
Most Common Occupations - Management, business, science, and arts occupations (%)
Most Common Occupations - Management, business, and financial occupations (%)
Most Common Occupations - Management occupations (%)
Most Common Occupations - Business and financial operations occupations (%)
Most Common Occupations - Computer, engineering, and science occupations (%)
Most Common Occupations - Computer and mathematical occupations (%)
Most Common Occupations - Architecture and engineering occupations (%)
Most Common Occupations - Life, physical, and social science occupations (%)
Most Common Occupations - Education, legal, community service, arts, and media occupations (%)
Most Common Occupations - Community and social service occupations (%)
Most Common Occupations - Legal occupations (%)
Most Common Occupations - Education, training, and library occupations (%)
Most Common Occupations - Arts, design, entertainment, sports, and media occupations (%)
Most Common Occupations - Healthcare practitioners and technical occupations (%)
Most Common Occupations - Health diagnosing and treating practitioners and other technical occupations (%)
Most Common Occupations - Health technologists and technicians (%)
Most Common Occupations - Service occupations (%)
Most Common Occupations - Healthcare support occupations (%)
Most Common Occupations - Protective service occupations (%)
Most Common Occupations - Fire fighting and prevention, and other protective service workers including supervisors (%)
Most Common Occupations - Law enforcement workers including supervisors (%)
Most Common Occupations - Food preparation and serving related occupations (%)
Most Common Occupations - Building and grounds cleaning and maintenance occupations (%)
Most Common Occupations - Personal care and service occupations (%)
Most Common Occupations - Sales and office occupations (%)
Most Common Occupations - Sales and related occupations (%)
Most Common Occupations - Office and administrative support occupations (%)
Most Common Occupations - Natural resources, construction, and maintenance occupations (%)
Most Common Occupations - Farming, fishing, and forestry occupations (%)
Most Common Occupations - Construction and extraction occupations (%)
Most Common Occupations - Installation, maintenance, and repair occupations (%)
Most Common Occupations - Production, transportation, and material moving occupations (%)
Most Common Occupations - Production occupations (%)
Most Common Occupations - Transportation occupations (%)
Most Common Occupations - Material moving occupations (%)
People in Group quarters - Institutionalized population (%)
People in Group quarters - Correctional institutions (%)
People in Group quarters - Federal prisons and detention centers (%)
People in Group quarters - Halfway houses (%)
People in Group quarters - Local jails and other confinement facilities (including police lockups) (%)
People in Group quarters - Military disciplinary barracks (%)
People in Group quarters - State prisons (%)
People in Group quarters - Other types of correctional institutions (%)
People in Group quarters - Nursing homes (%)
People in Group quarters - Hospitals/wards, hospices, and schools for the handicapped (%)
People in Group quarters - Hospitals/wards and hospices for chronically ill (%)
People in Group quarters - Hospices or homes for chronically ill (%)
People in Group quarters - Military hospitals or wards for chronically ill (%)
People in Group quarters - Other hospitals or wards for chronically ill (%)
People in Group quarters - Hospitals or wards for drug/alcohol abuse (%)
People in Group quarters - Mental (Psychiatric) hospitals or wards (%)
People in Group quarters - Schools, hospitals, or wards for the mentally retarded (%)
People in Group quarters - Schools, hospitals, or wards for the physically handicapped (%)
People in Group quarters - Institutions for the deaf (%)
People in Group quarters - Institutions for the blind (%)
People in Group quarters - Orthopedic wards and institutions for the physically handicapped (%)
People in Group quarters - Wards in general hospitals for patients who have no usual home elsewhere (%)
People in Group quarters - Wards in military hospitals for patients who have no usual home elsewhere (%)
People in Group quarters - Juvenile institutions (%)
People in Group quarters - Long-term care (%)
People in Group quarters - Homes for abused, dependent, and neglected children (%)
People in Group quarters - Residential treatment centers for emotionally disturbed children (%)
People in Group quarters - Training schools for juvenile delinquents (%)
People in Group quarters - Short-term care, detention or diagnostic centers for delinquent children (%)
People in Group quarters - Type of juvenile institution unknown (%)
People in Group quarters - Noninstitutionalized population (%)
People in Group quarters - College dormitories (includes college quarters off campus) (%)
People in Group quarters - Military quarters (%)
People in Group quarters - On base (%)
People in Group quarters - Barracks, unaccompanied personnel housing (UPH), (Enlisted/Officer), ;and similar group living quarters for military personnel (%)
People in Group quarters - Transient quarters for temporary residents (%)
People in Group quarters - Military ships (%)
People in Group quarters - Group homes (%)
People in Group quarters - Homes or halfway houses for drug/alcohol abuse (%)
People in Group quarters - Homes for the mentally ill (%)
People in Group quarters - Homes for the mentally retarded (%)
People in Group quarters - Homes for the physically handicapped (%)
People in Group quarters - Other group homes (%)
People in Group quarters - Religious group quarters (%)
People in Group quarters - Dormitories (%)
People in Group quarters - Agriculture workers' dormitories on farms (%)
People in Group quarters - Job Corps and vocational training facilities (%)
People in Group quarters - Other workers' dormitories (%)
People in Group quarters - Crews of maritime vessels (%)
People in Group quarters - Other nonhousehold living situations (%)
People in Group quarters - Other noninstitutional group quarters (%)
Residents speaking English at home (%)
Residents speaking English at home - Born in the United States (%)
Residents speaking English at home - Native, born elsewhere (%)
Residents speaking English at home - Foreign born (%)
Residents speaking Spanish at home (%)
Residents speaking Spanish at home - Born in the United States (%)
Residents speaking Spanish at home - Native, born elsewhere (%)
Residents speaking Spanish at home - Foreign born (%)
Residents speaking other language at home (%)
Residents speaking other language at home - Born in the United States (%)
Residents speaking other language at home - Native, born elsewhere (%)
Residents speaking other language at home - Foreign born (%)
Class of Workers - Employee of private company (%)
Class of Workers - Self-employed in own incorporated business (%)
Class of Workers - Private not-for-profit wage and salary workers (%)
Class of Workers - Local government workers (%)
Class of Workers - State government workers (%)
Class of Workers - Federal government workers (%)
Class of Workers - Self-employed workers in own not incorporated business and Unpaid family workers (%)
House heating fuel used in houses and condos - Utility gas (%)
House heating fuel used in houses and condos - Bottled, tank, or LP gas (%)
House heating fuel used in houses and condos - Electricity (%)
House heating fuel used in houses and condos - Fuel oil, kerosene, etc. (%)
House heating fuel used in houses and condos - Coal or coke (%)
House heating fuel used in houses and condos - Wood (%)
House heating fuel used in houses and condos - Solar energy (%)
House heating fuel used in houses and condos - Other fuel (%)
House heating fuel used in houses and condos - No fuel used (%)
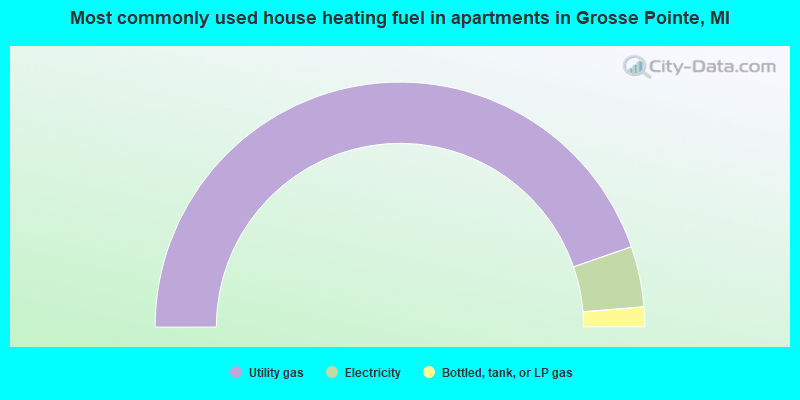
House heating fuel used in apartments - Utility gas (%)
House heating fuel used in apartments - Bottled, tank, or LP gas (%)
House heating fuel used in apartments - Electricity (%)
House heating fuel used in apartments - Fuel oil, kerosene, etc. (%)
House heating fuel used in apartments - Coal or coke (%)
House heating fuel used in apartments - Wood (%)
House heating fuel used in apartments - Solar energy (%)
House heating fuel used in apartments - Other fuel (%)
House heating fuel used in apartments - No fuel used (%)
Armed forces status - In Armed Forces (%)
Armed forces status - Civilian (%)
Armed forces status - Civilian - Veteran (%)
Armed forces status - Civilian - Nonveteran (%)
Fatal accidents locations in years 2005-2021
Fatal accidents locations in 2005
Fatal accidents locations in 2006
Fatal accidents locations in 2007
Fatal accidents locations in 2008
Fatal accidents locations in 2009
Fatal accidents locations in 2010
Fatal accidents locations in 2011
Fatal accidents locations in 2012
Fatal accidents locations in 2013
Fatal accidents locations in 2014
Fatal accidents locations in 2015
Fatal accidents locations in 2016
Fatal accidents locations in 2017
Fatal accidents locations in 2018
Fatal accidents locations in 2019
Fatal accidents locations in 2020
Fatal accidents locations in 2021
Alcohol use - People drinking some alcohol every month (%)
Alcohol use - People not drinking at all (%)
Alcohol use - Average days/month drinking alcohol
Alcohol use - Average drinks/week
Alcohol use - Average days/year people drink much
Audiometry - Average condition of hearing (%)
Audiometry - People that can hear a whisper from across a quiet room (%)
Audiometry - People that can hear normal voice from across a quiet room (%)
Audiometry - Ears ringing, roaring, buzzing (%)
Audiometry - Had a job exposure to loud noise (%)
Audiometry - Had off-work exposure to loud noise (%)
Blood Pressure & Cholesterol - Has high blood pressure (%)
Blood Pressure & Cholesterol - Checking blood pressure at home (%)
Blood Pressure & Cholesterol - Frequently checking blood cholesterol (%)
Blood Pressure & Cholesterol - Has high cholesterol level (%)
Consumer Behavior - Money monthly spent on food at supermarket/grocery store
Consumer Behavior - Money monthly spent on food at other stores
Consumer Behavior - Money monthly spent on eating out
Consumer Behavior - Money monthly spent on carryout/delivered foods
Consumer Behavior - Income spent on food at supermarket/grocery store (%)
Consumer Behavior - Income spent on food at other stores (%)
Consumer Behavior - Income spent on eating out (%)
Consumer Behavior - Income spent on carryout/delivered foods (%)
Current Health Status - General health condition (%)
Current Health Status - Blood donors (%)
Current Health Status - Has blood ever tested for HIV virus (%)
Current Health Status - Left-handed people (%)
Dermatology - People using sunscreen (%)
Diabetes - Diabetics (%)
Diabetes - Had a blood test for high blood sugar (%)
Diabetes - People taking insulin (%)
Diet Behavior & Nutrition - Diet health (%)
Diet Behavior & Nutrition - Milk product consumption (# of products/month)
Diet Behavior & Nutrition - Meals not home prepared (#/week)
Diet Behavior & Nutrition - Meals from fast food or pizza place (#/week)
Diet Behavior & Nutrition - Ready-to-eat foods (#/month)
Diet Behavior & Nutrition - Frozen meals/pizza (#/month)
Drug Use - People that ever used marijuana or hashish (%)
Drug Use - Ever used hard drugs (%)
Drug Use - Ever used any form of cocaine (%)
Drug Use - Ever used heroin (%)
Drug Use - Ever used methamphetamine (%)
Health Insurance - People covered by health insurance (%)
Kidney Conditions-Urology - Avg. # of times urinating at night
Medical Conditions - People with asthma (%)
Medical Conditions - People with anemia (%)
Medical Conditions - People with psoriasis (%)
Medical Conditions - People with overweight (%)
Medical Conditions - Elderly people having difficulties in thinking or remembering (%)
Medical Conditions - People who ever received blood transfusion (%)
Medical Conditions - People having trouble seeing even with glass/contacts (%)
Medical Conditions - People with arthritis (%)
Medical Conditions - People with gout (%)
Medical Conditions - People with congestive heart failure (%)
Medical Conditions - People with coronary heart disease (%)
Medical Conditions - People with angina pectoris (%)
Medical Conditions - People who ever had heart attack (%)
Medical Conditions - People who ever had stroke (%)
Medical Conditions - People with emphysema (%)
Medical Conditions - People with thyroid problem (%)
Medical Conditions - People with chronic bronchitis (%)
Medical Conditions - People with any liver condition (%)
Medical Conditions - People who ever had cancer or malignancy (%)
Mental Health - People who have little interest in doing things (%)
Mental Health - People feeling down, depressed, or hopeless (%)
Mental Health - People who have trouble sleeping or sleeping too much (%)
Mental Health - People feeling tired or having little energy (%)
Mental Health - People with poor appetite or overeating (%)
Mental Health - People feeling bad about themself (%)
Mental Health - People who have trouble concentrating on things (%)
Mental Health - People moving or speaking slowly or too fast (%)
Mental Health - People having thoughts they would be better off dead (%)
Oral Health - Average years since last visit a dentist
Oral Health - People embarrassed because of mouth (%)
Oral Health - People with gum disease (%)
Oral Health - General health of teeth and gums (%)
Oral Health - Average days a week using dental floss/device
Oral Health - Average days a week using mouthwash for dental problem
Oral Health - Average number of teeth
Pesticide Use - Households using pesticides to control insects (%)
Pesticide Use - Households using pesticides to kill weeds (%)
Physical Activity - People doing vigorous-intensity work activities (%)
Physical Activity - People doing moderate-intensity work activities (%)
Physical Activity - People walking or bicycling (%)
Physical Activity - People doing vigorous-intensity recreational activities (%)
Physical Activity - People doing moderate-intensity recreational activities (%)
Physical Activity - Average hours a day doing sedentary activities
Physical Activity - Average hours a day watching TV or videos
Physical Activity - Average hours a day using computer
Physical Functioning - People having limitations keeping them from working (%)
Physical Functioning - People limited in amount of work they can do (%)
Physical Functioning - People that need special equipment to walk (%)
Physical Functioning - People experiencing confusion/memory problems (%)
Physical Functioning - People requiring special healthcare equipment (%)
Prescription Medications - Average number of prescription medicines taking
Preventive Aspirin Use - Adults 40+ taking low-dose aspirin (%)
Reproductive Health - Vaginal deliveries (%)
Reproductive Health - Cesarean deliveries (%)
Reproductive Health - Deliveries resulted in a live birth (%)
Reproductive Health - Pregnancies resulted in a delivery (%)
Reproductive Health - Women breastfeeding newborns (%)
Reproductive Health - Women that had a hysterectomy (%)
Reproductive Health - Women that had both ovaries removed (%)
Reproductive Health - Women that have ever taken birth control pills (%)
Reproductive Health - Women taking birth control pills (%)
Reproductive Health - Women that have ever used Depo-Provera or injectables (%)
Reproductive Health - Women that have ever used female hormones (%)
Sexual Behavior - People 18+ that ever had sex (vaginal, anal, or oral) (%)
Sexual Behavior - Males 18+ that ever had vaginal sex with a woman (%)
Sexual Behavior - Males 18+ that ever performed oral sex on a woman (%)
Sexual Behavior - Males 18+ that ever had anal sex with a woman (%)
Sexual Behavior - Males 18+ that ever had any sex with a man (%)
Sexual Behavior - Females 18+ that ever had vaginal sex with a man (%)
Sexual Behavior - Females 18+ that ever performed oral sex on a man (%)
Sexual Behavior - Females 18+ that ever had anal sex with a man (%)
Sexual Behavior - Females 18+ that ever had any kind of sex with a woman (%)
Sexual Behavior - Average age people first had sex
Sexual Behavior - Average number of female sex partners in lifetime (males 18+)
Sexual Behavior - Average number of female vaginal sex partners in lifetime (males 18+)
Sexual Behavior - Average age people first performed oral sex on a woman (18+)
Sexual Behavior - Average number of woman performed oral sex on in lifetime (18+)
Sexual Behavior - Average number of male sex partners in lifetime (males 18+)
Sexual Behavior - Average number of male anal sex partners in lifetime (males 18+)
Sexual Behavior - Average age people first performed oral sex on a man (18+)
Sexual Behavior - Average number of male oral sex partners in lifetime (18+)
Sexual Behavior - People using protection when performing oral sex (%)
Sexual Behavior - Average number of times people have vaginal or anal sex a year
Sexual Behavior - People having sex without condom (%)
Sexual Behavior - Average number of male sex partners in lifetime (females 18+)
Sexual Behavior - Average number of male vaginal sex partners in lifetime (females 18+)
Sexual Behavior - Average number of female sex partners in lifetime (females 18+)
Sexual Behavior - Circumcised males 18+ (%)
Sleep Disorders - Average hours sleeping at night
Sleep Disorders - People that has trouble sleeping (%)
Smoking-Cigarette Use - People smoking cigarettes (%)
Taste & Smell - People 40+ having problems with smell (%)
Taste & Smell - People 40+ having problems with taste (%)
Taste & Smell - People 40+ that ever had wisdom teeth removed (%)
Taste & Smell - People 40+ that ever had tonsils teeth removed (%)
Taste & Smell - People 40+ that ever had a loss of consciousness because of a head injury (%)
Taste & Smell - People 40+ that ever had a broken nose or other serious injury to face or skull (%)
Taste & Smell - People 40+ that ever had two or more sinus infections (%)
Weight - Average height (inches)
Weight - Average weight (pounds)
Weight - Average BMI
Weight - People that are obese (%)
Weight - People that ever were obese (%)
Weight - People trying to lose weight (%)
According to our research of Michigan and other state lists, there were 5 registered sex offenders living in Grosse Pointe, Michigan as of April 27, 2024 . The ratio of all residents to sex offenders in Grosse Pointe is 1,040 to 1.The ratio of registered sex offenders to all residents in this city is much lower than the state average.
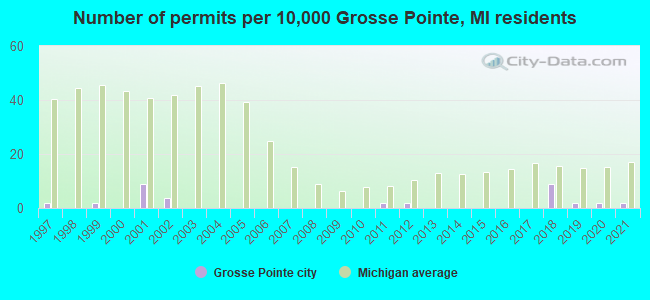
Officers per 1,000 residents here:
4.52Michigan average:
1.86
Latest news from Grosse Pointe, MI collected exclusively by city-data.com from local newspapers, TV, and radio stations
Ancestries: German (21.4%), Italian (14.0%), Irish (8.9%), American (6.4%), Polish (6.2%), English (5.1%).
Current Local Time:
Land area: 1.07 square miles.
Population density: 5,187 people per square mile (average).
435 residents are foreign born (4.8% Europe , 1.2% Asia , 1.1% North America ).
This city:
7.8%Michigan:
6.9%
Median real estate property taxes paid for housing units with mortgages in 2022: $7,482 (1.8%)Median real estate property taxes paid for housing units with no mortgage in 2022: $6,762 (1.5%)
Nearest city with pop. 50,000+: St. Clair Shores, MI
Nearest city with pop. 200,000+: Detroit, MI
Nearest city with pop. 1,000,000+: Chicago, IL
Nearest cities:
Latitude: 42.39 N, Longitude: 82.91 W
Daytime population change due to commuting: +3,103 (+56.0%)Workers who live and work in this city: 807 (31.8%)
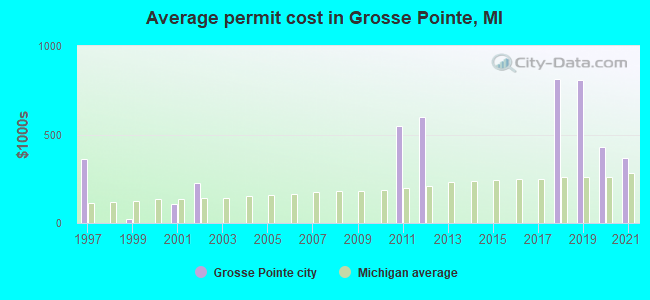
Single-family new house construction building permits:
2021: 1 building , cost: $368,7002020: 1 building , cost: $429,4002019: 1 building , cost: $805,5002018: 5 buildings , average cost: $811,8002012: 1 building , cost: $600,0002011: 1 building , cost: $550,0002002: 2 buildings , average cost: $225,0002001: 5 buildings , average cost: $110,0001999: 1 building , cost: $25,0001997: 1 building , cost: $360,000Unemployment in December 2023:
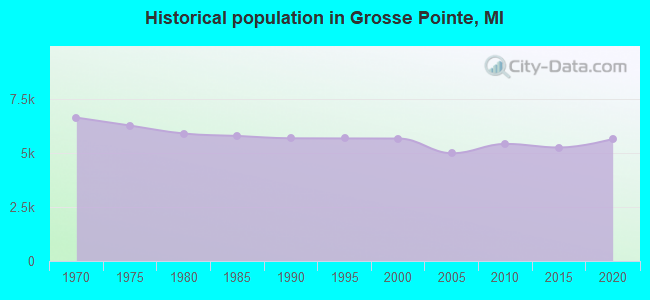
Population change in the 1990s: +13 (+0.2%).
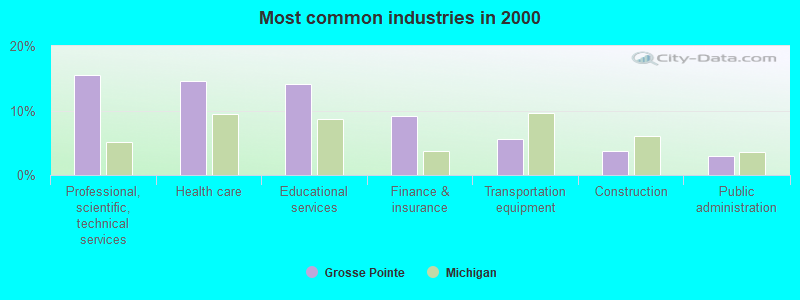
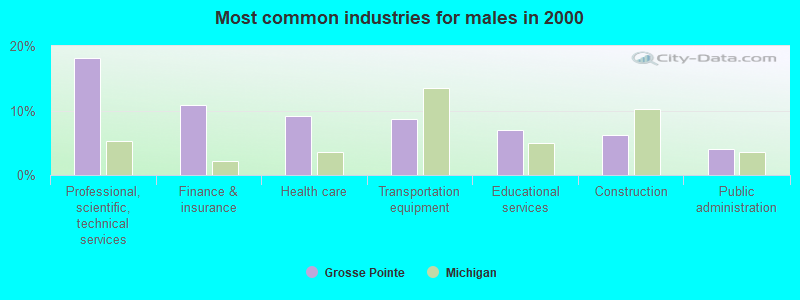
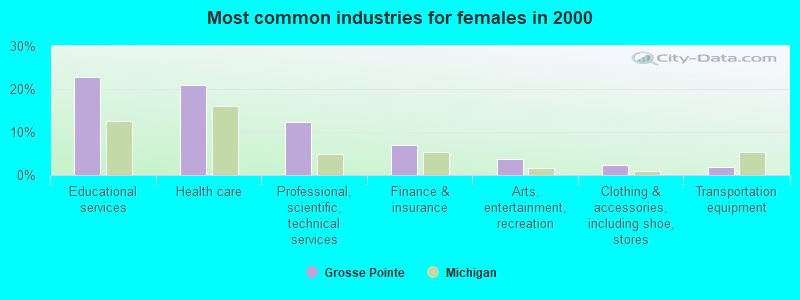
Most common industries in Grosse Pointe, MI (%)
Both Males Females
Professional, scientific, technical services (15.5%)
Health care (14.6%)
Educational services (14.2%)
Finance & insurance (9.1%)
Transportation equipment (5.6%)
Construction (3.8%)
Public administration (2.9%)
Professional, scientific, technical services (18.2%)
Finance & insurance (10.8%)
Health care (9.2%)
Transportation equipment (8.7%)
Educational services (6.9%)
Construction (6.2%)
Public administration (4.0%)
Educational services (22.8%)
Health care (21.0%)
Professional, scientific, technical services (12.4%)
Finance & insurance (7.1%)
Arts, entertainment, recreation (3.8%)
Clothing & accessories, including shoe, stores (2.4%)
Transportation equipment (2.0%)
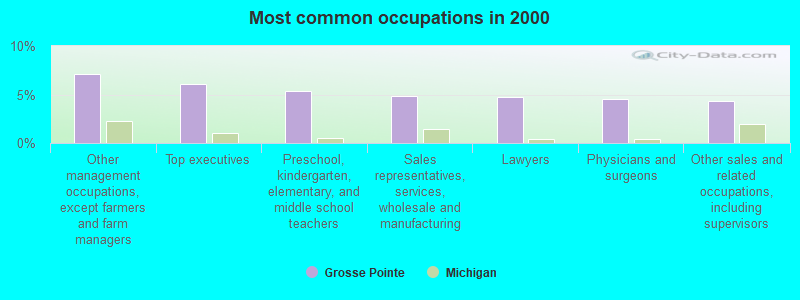
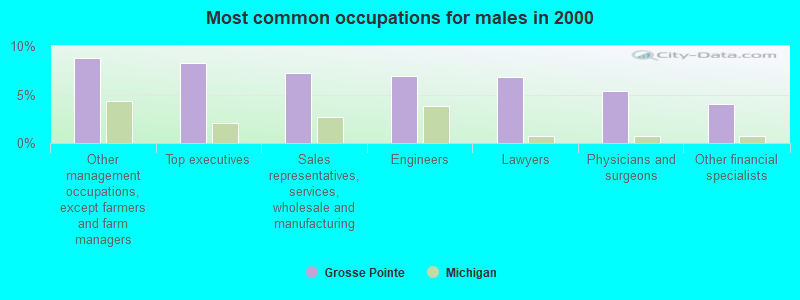
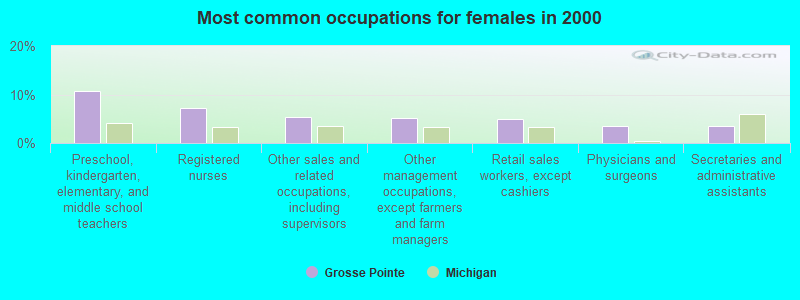
Most common occupations in Grosse Pointe, MI (%)
Both Males Females
Other management occupations, except farmers and farm managers (7.1%)
Top executives (6.1%)
Preschool, kindergarten, elementary, and middle school teachers (5.4%)
Sales representatives, services, wholesale and manufacturing (4.9%)
Lawyers (4.7%)
Physicians and surgeons (4.6%)
Other sales and related occupations, including supervisors (4.3%)
Other management occupations, except farmers and farm managers (8.8%)
Top executives (8.2%)
Sales representatives, services, wholesale and manufacturing (7.2%)
Engineers (6.9%)
Lawyers (6.8%)
Physicians and surgeons (5.4%)
Other financial specialists (4.0%)
Preschool, kindergarten, elementary, and middle school teachers (10.7%)
Registered nurses (7.2%)
Other sales and related occupations, including supervisors (5.3%)
Other management occupations, except farmers and farm managers (5.2%)
Retail sales workers, except cashiers (5.0%)
Physicians and surgeons (3.6%)
Secretaries and administrative assistants (3.5%)
Tornado activity:
Grosse Pointe-area historical tornado activity is slightly above Michigan state average. It is 14% greater than the overall U.S. average.
On 7/4/1957, a category F4 (max. wind speeds 207-260 mph) tornado 13.9 miles away from the Grosse Pointe city center injured 6 people and caused between $50,000 and $500,000 in damages.
On 5/12/1956, a category F4 tornado 14.6 miles away from the city center injured 22 people and caused between $50,000 and $500,000 in damages.
Earthquake activity:
Grosse Pointe-area historical earthquake activity is significantly above Michigan state average. It is 49% smaller than the overall U.S. average. On 9/25/1998 at 19:52:52, a magnitude 5.2 (4.8 MB, 4.3 MS, 5.2 LG, 4.5 MW, Depth: 3.1 mi, Class: Moderate, Intensity: VI - VII) earthquake occurred 143.6 miles away from Grosse Pointe center On 1/31/1986 at 16:46:43, a magnitude 5.0 (5.0 MB) earthquake occurred 105.3 miles away from the city center On 7/12/1986 at 08:19:37, a magnitude 4.5 (4.5 MB, Class: Light, Intensity: IV - V) earthquake occurred 148.9 miles away from Grosse Pointe center On 7/27/1980 at 18:52:21, a magnitude 5.2 (5.1 MB, 4.7 MS, 5.0 UK, 5.2 UK) earthquake occurred 294.6 miles away from the city center On 8/23/2011 at 17:51:04, a magnitude 5.8 (5.8 MW, Depth: 3.7 mi) earthquake occurred 406.3 miles away from the city center On 5/2/2015 at 16:23:07, a magnitude 4.2 (4.2 MW, Depth: 2.8 mi) earthquake occurred 129.2 miles away from Grosse Pointe center Magnitude types: regional Lg-wave magnitude (LG), body-wave magnitude (MB), surface-wave magnitude (MS), moment magnitude (MW) Natural disasters: The number of natural disasters in Wayne County (14) is near the US average (15).Major Disasters (Presidential) Declared: 9Emergencies Declared: 4Storms: 9, Floods: 7, Tornadoes: 3, Blizzard: 1, Hurricane: 1, Power Outage: 1, Snowstorm: 1, Winter Storm: 1, Other: 1 (Note: some incidents may be assigned to more than one category). Hospitals and medical centers in Grosse Pointe: BEAUMONT HEALTH SYSTEM (Voluntary non-profit - Private, provides emergency services, 468 CADIEUX RD) COTTAGE HOSPITAL (provides emergency services, 468 CADIEUX RD) Other hospitals and medical centers near Grosse Pointe: SELECT SPECIALTY HOSPITAL-GROSSE POINTE (Hospital, about 1 miles away; GROSSE POINTE FARMS, MI)
GROSSE POINT DIALYSIS OF DAVITA (Dialysis Facility, about 2 miles away; DETROIT, MI)
RIVERVIEW HEALTH AND REHAB CENTER NORTH (Nursing Home, about 2 miles away; DETROIT, MI)
GREAT LAKES DIALYSIS, LLC (Dialysis Facility, about 2 miles away; DETROIT, MI)
ST JOHN HOSPITAL AND MEDICAL CENTER (about 2 miles away; DETROIT, MI)
DAVITA - CADIEUX (Dialysis Facility, about 3 miles away; DETROIT, MI)
ST ANNES CONVALESCENT CENTER (Nursing Home, about 3 miles away; DETROIT, MI)
Amtrak stations near Grosse Pointe: 6 miles: WINDSOR (298 WALKER RD.) Services: ticket office.
9 miles: DETROIT (11 W. BALTIMORE AVE.) Services: ticket office, partially wheelchair accessible, enclosed waiting area, public restrooms, public payphones, free short-term parking, call for car rental service, taxi stand, public transit connection.
14 miles: ROYAL OAK (201 S. SHERMAN DR.) Services: enclosed waiting area, public payphones, vending machines, paid short-term parking, taxi stand, intercity bus service, public transit connection.
Colleges/universities with over 2000 students nearest to Grosse Pointe:
Wayne State University (about 9 miles; Detroit, MI ; Full-time enrollment: 20,204)
Wayne County Community College District (about 9 miles; Detroit, MI ; FT enrollment: 10,554)
Macomb Community College (about 9 miles; Warren, MI ; FT enrollment: 15,669)
Baker College of Clinton Township (about 12 miles; Clinton Township, MI ; FT enrollment: 3,413)
University of Detroit Mercy (about 12 miles; Detroit, MI ; FT enrollment: 3,406)
Baker College of Allen Park (about 17 miles; Allen Park, MI ; FT enrollment: 2,693)
University of Michigan-Dearborn (about 18 miles; Dearborn, MI ; FT enrollment: 6,712)
Public elementary/middle school in Grosse Pointe:
See full list of schools located in Grosse Pointe
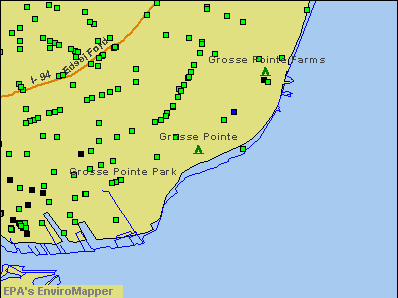
Notable locations in Grosse Pointe: (A) , Grosse Pointe City Department of Public Safety Fire Station (B) , Grosse Point Police Station (C) . Display/hide their locations on the map
Park in Grosse Pointe: (1) . Display/hide its location on the map
Tourist attractions:
Birthplace of: John 5 (guitarist) - Heavy metal guitarist, John Ziegler (ice hockey) - President of the NHL, Carly Piper - Swimmer and Olympic gold medalist, Craig Wolanin - Ice hockey player, Jim Miller - 2005 NFL player (New York Giants, born : Feb 9, 1971), Jim Miller (quarterback) - Football player, Julie Harris - Actress, Lisa LoCicero - Film actor, Taylor Mead - Actor, Debbie Massey - Professional golfer.
Wayne County has a predicted average indoor radon screening level less than 2 pCi/L (pico curies per liter) - Low Potential Drinking water stations with addresses in Grosse Pointe that have no violations reported:
GROSSE POINTE, CITY OF (Population served: 5,670, Primary Water Source Type: Purch surface water)
Average household size: This city:
2.4 peopleMichigan:
2.5 people
Percentage of family households: This city:
66.2%Whole state:
66.0%
Percentage of households with unmarried partners: This city:
3.3%Whole state:
6.4%
Likely homosexual households (counted as self-reported same-sex unmarried-partner households)
Lesbian couples: 0.4% of all households Gay men: 0.4% of all households
Banks with branches in Grosse Pointe (2011 data):
JPMorgan Chase Bank, National Association: Grosse Pointe Branch at 17449 East Jefferson, branch established on 1955/10/03; Kercheval-St. Clair Branch at 685 St. Clair Street, branch established on 1955/08/01. Info updated 2011/11/10: Bank assets: $1,811,678.0 mil, Deposits: $1,190,738.0 mil, headquarters in Columbus, OH, positive income , International Specialization, 5577 total offices , Holding Company: Jpmorgan Chase & Co.
Flagstar Bank, FSB: Kercheval Road Branch at 16821 Kercheval, branch established on 2006/02/15. Info updated 2011/07/21: Bank assets: $13,623.5 mil, Deposits: $7,802.8 mil, headquarters in Troy, MI, negative income in the last year , Mortgage Lending Specialization, 135 total offices
RBS Citizens, National Association: Grosse Pointe at 633 Notre Dame Avenue, branch established on 1934/05/01. Info updated 2007/09/19: Bank assets: $106,940.6 mil, Deposits: $75,690.2 mil, headquarters in Providence, RI, positive income , 1135 total offices , Holding Company: Uk Financial Investments Limited
Comerica Bank: Fisher-St. Paul Branch at 415 Fisher Road, branch established on 1982/11/01. Info updated 2011/07/29: Bank assets: $60,970.5 mil, Deposits: $48,300.9 mil, headquarters in Dallas, TX, positive income , Commercial Lending Specialization, 497 total offices , Holding Company: Comerica Incorporated
Fifth Third Bank: Grosse Pointe Woods Banking Center B at 20065 Mack Avenue, branch established on 2004/12/13. Info updated 2009/10/05: Bank assets: $114,540.4 mil, Deposits: $89,689.1 mil, headquarters in Cincinnati, OH, positive income , Commercial Lending Specialization, 1378 total offices , Holding Company: Fifth Third Bancorp
For population 15 years and over in Grosse Pointe:
Never married: 22.3%Now married: 61.5%Separated: 0.1%Widowed: 6.5%Divorced: 9.6% For population 25 years and over in Grosse Pointe:
High school or higher: 99.3%Bachelor's degree or higher: 74.2%Graduate or professional degree: 39.0%Unemployed: 1.2%Mean travel time to work (commute): 18.6 minutes
Education Gini index (Inequality in education) Here:
8.1Michigan average:
11.0
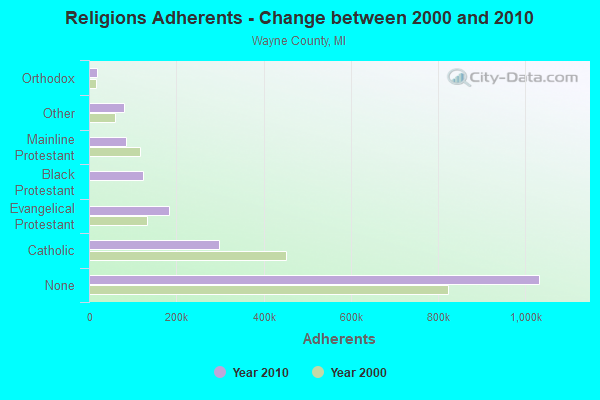
Religion statistics for Grosse Pointe, MI (based on Wayne County data)
Religion Adherents Congregations Catholic 297,283 151 Evangelical Protestant 183,985 527 Black Protestant 124,432 282 Mainline Protestant 85,387 231 Other 79,840 116 Orthodox 17,580 23 None 1,032,077 -
Source: Clifford Grammich, Kirk Hadaway, Richard Houseal, Dale E.Jones, Alexei Krindatch, Richie Stanley and Richard H.Taylor. 2012. 2010 U.S.Religion Census: Religious Congregations & Membership Study. Association of Statisticians of American Religious Bodies. Jones, Dale E., et al. 2002. Congregations and Membership in the United States 2000. Nashville, TN: Glenmary Research Center. Graphs represent county-level data
Food Environment Statistics: Number of grocery stores : 556This county :
2.81 / 10,000 pop.State :
2.34 / 10,000 pop.
Number of supercenters and club stores : 18Wayne County :
0.09 / 10,000 pop.Michigan :
0.18 / 10,000 pop.
Number of convenience stores (no gas) : 294Wayne County :
1.48 / 10,000 pop.State :
1.52 / 10,000 pop.
Number of convenience stores (with gas) : 523This county :
2.64 / 10,000 pop.Michigan :
2.99 / 10,000 pop.
Number of full-service restaurants : 1,019Wayne County :
5.14 / 10,000 pop.Michigan :
6.80 / 10,000 pop.
Adult obesity rate : Wayne County :
33.2%Michigan :
29.7%
Low-income preschool obesity rate : Wayne County :
12.9%Michigan :
13.4%
Health and Nutrition:
Average overall health of teeth and gums : Average BMI : Grosse Pointe:
27.3Michigan:
28.7
People feeling badly about themselves : This city:
16.0%Michigan:
20.6%
People not drinking alcohol at all : This city:
5.6%State:
10.4%
Average hours sleeping at night : Overweight people : Grosse Pointe:
34.0%Michigan:
34.1%
General health condition : Grosse Pointe:
68.2%State:
57.0%
Average condition of hearing : This city:
82.8%Michigan:
79.6%
More about Health and Nutrition of Grosse Pointe, MI Residents
Local government employment and payroll (March 2022)
Function
Full-time employees
Monthly full-time payroll
Average yearly full-time wage
Part-time employees
Monthly part-time payroll
Police Protection - Officers
23 $156,112 $81,450 0 $0 Solid Waste Management
6 $24,333 $48,666 0 $0 Other and Unallocable
6 $34,016 $68,032 5 $6,100 Financial Administration
4 $19,942 $59,826 0 $0 Other Government Administration
3 $27,231 $108,924 0 $0 Parks and Recreation
2 $9,313 $55,878 4 $261 Judicial and Legal
1 $822 $9,864 3 $3,829 Water Supply
1 $4,601 $55,212 0 $0 Sewerage
1 $6,554 $78,648 0 $0 Police - Other
0 $0 2 $1,063
Totals for Government
47 $282,925 $72,236 14 $11,253
Grosse Pointe government finances - Expenditure in 2018 (per resident):
Current Operations - General - Other: $3,191,000 ($574.85)
Regular Highways: $2,749,000 ($495.23)Sewerage: $1,423,000 ($256.35)Central Staff Services: $853,000 ($153.67)Parks and Recreation: $601,000 ($108.27)Financial Administration: $195,000 ($35.13)Judicial and Legal Services: $195,000 ($35.13)Protective Inspection and Regulation - Other: $111,000 ($20.00)Water Utilities: $73,000 ($13.15)General - Interest on Debt: $294,000 ($52.96)
Intergovernmental to Local - Other - Sewerage: $940,000 ($169.34)
Other - Health - Other: $834,000 ($150.24)Other - General - Other: $483,000 ($87.01)Other - Police Protection: $108,000 ($19.46)Other Capital Outlay - General - Other: $1,853,000 ($333.81)
Regular Highways: $1,171,000 ($210.95)Solid Waste Management: $39,000 ($7.03)Total Salaries and Wages: $3,361,000 ($605.48)
Grosse Pointe government finances - Revenue in 2018 (per resident):
Charges - Other: $3,131,000 ($564.04)
Parking Facilities: $1,032,000 ($185.91)Federal Intergovernmental - Housing and Community Development: $80,000 ($14.41)
Local Intergovernmental - Highways: $176,000 ($31.71)
Other: $110,000 ($19.82)Miscellaneous - General Revenue - Other: $269,000 ($48.46)
Fines and Forfeits: $266,000 ($47.92)Rents: $97,000 ($17.47)Interest Earnings: $29,000 ($5.22)Sale of Property: $7,000 ($1.26)State Intergovernmental - General Local Government Support: $518,000 ($93.32)
Highways: $511,000 ($92.06)Other: $4,000 ($0.72)Tax - Property: $5,860,000 ($1055.67)
Other License: $178,000 ($32.07)Occupation and Business License - Other: $8,000 ($1.44)
Grosse Pointe government finances - Debt in 2018 (per resident):
Long Term Debt - Beginning Outstanding - Public Debt for Private Purpose: $9,895,000 ($1782.56)
Outstanding Nonguaranteed - Industrial Revenue: $9,532,000 ($1717.17)Retired Nonguaranteed - Public Debt for Private Purpose: $559,000 ($100.70)Issue, Nonguaranteed - Public Debt for Private Purpose: $196,000 ($35.31)
Grosse Pointe government finances - Cash and Securities in 2018 (per resident):
Other Funds - Cash and Securities: $11,852,000 ($2135.11)
Sinking Funds - Cash and Securities: $9,232,000 ($1663.12)
4.12% of this county's 2021 resident taxpayers lived in other counties in 2020 ($55,756 average adjusted gross income )
Here:
4.12%Michigan average:
5.83%
0.01% of residents moved from foreign countries ($67 average AGI )Wayne County:
0.01%Michigan average:
0.00%
Top counties from which taxpayers relocated into this county between 2020 and 2021:
5.14% of this county's 2020 resident taxpayers moved to other counties in 2021 ($70,859 average adjusted gross income )
Here:
5.14%Michigan average:
5.95%
0.00% of residents moved to foreign countries ($38 average AGI )Wayne County:
0.00%Michigan average:
0.00%
Top counties to which taxpayers relocated from this county between 2020 and 2021:
Businesses in Grosse Pointe, MI
Name Count Name Count
Ace Hardware 1 GNC 1 Ann Taylor 2 Gap 1 Barnes & Noble 1 JoS. A. Bank 1 Blockbuster 1 New Balance 1 CVS 1 Panera Bread 1 Caribou Coffee 1 Starbucks 2 Chico's 1 T-Mobile 1 Cold Stone Creamery 1 Talbots 1 Coldwater Creek 1 Trader Joe's 1 Domino's Pizza 1 UPS 2 FedEx 3
Strongest AM radio stations in Grosse Pointe:
WWJ (950 AM; 50 kW; DETROIT, MI; Owner: INFINITY BROADCASTING OPERATIONS, INC.)
WJR (760 AM; 50 kW; DETROIT, MI; Owner: ABC, INC.)
WXYT (1270 AM; 50 kW; DETROIT, MI; Owner: INFINITY BROADCASTING CORP. OF DETROIT)
WDFN (1130 AM; 50 kW; DETROIT, MI; Owner: AMFM RADIO LICENSES, L.L.C.)
WCHB (1200 AM; 50 kW; TAYLOR, MI; Owner: RADIO ONE OF DETROIT, LLC)
WFDF (910 AM; 50 kW; FLINT, MI; Owner: ABC, INC.)
WUFL (1030 AM; daytime; 5 kW; STERLING HEIGHTS, MI; Owner: FAMILY LIFE BROADCASTING SYSTEM)
WXDX (1310 AM; 5 kW; DEARBORN, MI; Owner: AMFM RADIO LICENSES, L.L.C.)
WOAP (1080 AM; 50 kW; OWOSSO, MI)
WQBH (1400 AM; 1 kW; DETROIT, MI; Owner: QUEEN'S BROADCASTING CORP.)
WDEO (990 AM; 9 kW; YPSILANTI, MI; Owner: WORD BROADCASTERS, INC.)
WKNR (850 AM; 50 kW; CLEVELAND, OH; Owner: CARON BROADCASTING, INC.)
WEXL (1340 AM; 1 kW; ROYAL OAK, MI; Owner: WMUZ RADIO, INC.)
Strongest FM radio stations in Grosse Pointe:
WMXD (92.3 FM; DETROIT, MI; Owner: AMFM RADIO LICENSES, L.L.C.)
WDTW (106.7 FM; DETROIT, MI; Owner: AMFM RADIO LICENSES, L.L.C.)
WDET-FM (101.9 FM; DETROIT, MI; Owner: WAYNE STATE UNIVERSITY)
WMGC-FM (105.1 FM; DETROIT, MI; Owner: GREATER BOSTON RADIO, INC.)
WCSX (94.7 FM; BIRMINGHAM, MI; Owner: GREATER BOSTON RADIO, INC.)
WGPR (107.5 FM; DETROIT, MI; Owner: WGPR, INC.)
WDVD (96.3 FM; DETROIT, MI; Owner: ABC, INC.)
WDTR-FM (90.9 FM; DETROIT, MI; Owner: BOARD OF EDUCATION, CITY OF DETROIT)
WJLB (97.9 FM; DETROIT, MI; Owner: AMFM RADIO LICENSES, L.L.C.)
WNIC (100.3 FM; DEARBORN, MI; Owner: AMFM RADIO LICENSES, L.L.C.)
WKRK-FM (97.1 FM; DETROIT, MI; Owner: INFINITY BROADCASTING OPERATIONS, INC.)
WDMK (102.7 FM; MOUNT CLEMENS, MI; Owner: RADIO ONE OF DETROIT, LLC)
WRIF (101.1 FM; DETROIT, MI; Owner: GREATER BOSTON RADIO, INC.)
WYCD (99.5 FM; DETROIT, MI; Owner: INFINITY BROADCASTING CORPORATION OF MICHIGAN)
WDTJ (105.9 FM; DETROIT, MI; Owner: RADIO ONE OF DETROIT, LLC)
WDRQ (93.1 FM; DETROIT, MI; Owner: ABC, INC.)
WVMV (98.7 FM; DETROIT, MI; Owner: INFINITY BROADCASTING OPERATIONS, INC.)
WOMC (104.3 FM; DETROIT, MI; Owner: INFINITY BROADCASTING CORPORATION OF MICHIGAN)
WKQI (95.5 FM; DETROIT, MI; Owner: AMFM RADIO LICENSES, L.L.C.)
WMUZ (103.5 FM; DETROIT, MI; Owner: WMUZ RADIO, INC.)
TV broadcast stations around Grosse Pointe:
W48AV (Channel 48; DETROIT, MI; Owner: PAXSON COMMUNICATIONS LICENSE COMPANY, LLC)
WWJ-TV (Channel 62; DETROIT, MI; Owner: CBS BROADCASTING INC.)
WJBK (Channel 2; DETROIT, MI; Owner: FOX TELEVISION STATIONS, INC.)
WDWB (Channel 20; DETROIT, MI; Owner: WXON LICENSE, INC.)
WTVS (Channel 56; DETROIT, MI; Owner: DETROIT EDUC. TV FOUNDATION)
WLPC-LP (Channel 26; DETROIT, MI; Owner: GLENN R. AND KARIN A. PLUMMER)
WBXD-CA (Channel 5; DETROIT, MI; Owner: THE BOX WORLDWIDE LLC)
WXYZ-TV (Channel 7; DETROIT, MI; Owner: CHANNEL 7 OF DETROIT, INC.)
WDIV-TV (Channel 4; DETROIT, MI; Owner: POST-NEWSWEEK STATIONS, MICHIGAN, INC.)
WADL (Channel 38; MOUNT CLEMENS, MI; Owner: ADELL BROADCASTING CORPORATION)
WKBD (Channel 50; DETROIT, MI; Owner: VIACOM STATIONS GROUP OF DETROIT INC.)
WDWO-CA (Channel 18; DETROIT, MI; Owner: TCT OF MICHIGAN, INC.)
W33BY (Channel 68; DETROIT, MI; Owner: HIGHLAND PARK BROADCASTING, L.P.)
W66BV (Channel 66; DETROIT, MI; Owner: TRINITY BROADCASTING NETWORK)
Grosse Pointe fatal accident statistics for 1975 - 2021
Grosse Pointe fatal accident list:
Oct 10, 2019 09:52 PM, Lakeland St, E Jefferson Ave, Lat: 42.383972, Lon: -82.907644, Vehicles: 1, Persons: 1, Pedestrians: 1, Fatalities: 1Vehicles: 1, Persons: 2, Pedestrians: 1, Fatalities: 1Vehicles: 1, Persons: 5, Pedestrians: 1, Fatalities: 1Vehicles: 1, Persons: 1, Fatalities: 1, Drunk persons involved: 1Vehicles: 1, Persons: 2, Fatalities: 1, Drunk persons involved: 1Vehicles: 1, Persons: 3, Fatalities: 1, Drunk persons involved: 1
FCC Registered Cell Phone Towers: 1 (
See the full list of FCC Registered Cell Phone Towers in Grosse Pointe )
FCC Registered Antenna Towers: 13 (
See the full list of FCC Registered Antenna Towers )
FCC Registered Broadcast Land Mobile Towers: 6
159 Kercheval Ave (Lat: 42.383917 Lon: -82.914361), Call Sign: WNHU643, Licensee ID: L01679644, Assigned Frequencies: 462.875 MHz, Grant Date: 02/13/2012, Expiration Date: 01/09/2022, Cancellation Date: 03/12/2022, Registrant: William Beaumont Hospital, 468 Cadieux, Grosse Pointe, MI 44203, Phone: (313) 473-1551, Fax: (313) 417-6904, Email:
468 Cadieux Rd (Lat: 42.384750 Lon: -82.914639), Structure height: 24 m, Call Sign: WNRS465, Assigned Frequencies: 462.925 MHz, Grant Date: 02/27/2015, Expiration Date: 04/02/2025, Registrant: C3 Communications, Inc., 5685 Hummer Lake Road, Oxford, MI 48371, Phone: (248) 969-3110, Fax: (248) 969-3110, Email:
468 Cadieux Road (Lat: 42.384361 Lon: -82.914722), Type: Mast, Structure height: 13.7 m, Overall height: 17.3 m, Call Sign: WQKU734, Assigned Frequencies: 72.7000 MHz, Grant Date: 09/06/2019, Expiration Date: 09/21/2029, Certifier: Randy Forbes, Registrant: C3 Communications, Inc., 5685 Hummer Lake Road, Oxford, MI 48371, Phone: (248) 969-3110, Fax: (248) 969-3110, Email:
Lat: 42.387028 Lon: -82.900139, Call Sign: WQRW794, Assigned Frequencies: 452.987 MHz, 457.987 MHz, Grant Date: 08/07/2013, Expiration Date: 08/07/2023, Cancellation Date: 10/07/2023, Certifier: Larry O'Keefe, Registrant: Tri-County Communication, Inc., 23519 Little Mack Ave, St. Claire Shores, MI 48080, Phone: (586) 752-5870, Email:
Lat: 42.384028 Lon: -82.911972, Call Sign: WQXE375, Assigned Frequencies: 469.112 MHz, 464.037 MHz, 464.112 MHz, 464.412 MHz, 469.037 MHz, Grant Date: 02/10/2016, Expiration Date: 02/10/2026, Certifier: Richard K Vangorder, Registrant: Business Radio Licensing, 30251 Golden Lantern Ste E #501, Laguna Niguel, CA 92677, Phone: (949) 348-8510, Fax: (949) 348-8514, Email:
Lat: 42.434889 Lon: -82.872056, Call Sign: WRPF663, Assigned Frequencies: 462.237 MHz, 462.337 MHz, 462.412 MHz, 462.437 MHz, 467.237 MHz, 467.412 MHz, 467.437 MHz, Grant Date: 01/29/2022, Expiration Date: 01/29/2032, Certifier: Sean Brown, Registrant: Business Radio Licensing, 30251 Golden Lantern, Suite E, Laguna Niguel, CA 92677, Phone: (949) 348-8510, Fax: (949) 348-8514, Email:
FCC Registered Maritime Coast & Aviation Ground Towers: 1
805 University Pl (Lat: 42.392806 Lon: -83.936889), Type: Building, Overall height: 11 m, Call Sign: WHU949, Licensee ID: L00019224, Assigned Frequencies: 156.800 MHz, 156.900 MHz, 156.450 MHz, Grant Date: 02/14/2000, Expiration Date: 02/09/2005, Cancellation Date: 04/16/2005, Registrant: Jeffry M Bauer, 805 University Pl, Grosse Pointe, MI 48230 FCC Registered Amateur Radio Licenses: 63 (
See the full list of FCC Registered Amateur Radio Licenses in Grosse Pointe )
FAA Registered Aircraft Manufacturers and Dealers: 2 (
See the full list of FAA Registered Manufacturers and Dealers in Grosse Pointe )
FAA Registered Aircraft: 13 (
See the full list of FAA Registered Aircraft )
Home Mortgage Disclosure Act Aggregated Statistics For Year 2009(Based on 2 full tracts) A) FHA, FSA/RHS & VA B) Conventional C) Refinancings D) Home Improvement Loans F) Non-occupant Loans on Number Average Value Number Average Value Number Average Value Number Average Value Number Average Value
LOANS ORIGINATED 12 $147,250 29 $237,310 128 $235,680 6 $37,833 4 $125,500 APPLICATIONS APPROVED, NOT ACCEPTED 1 $191,000 1 $135,000 16 $303,500 0 $0 2 $140,500 APPLICATIONS DENIED 1 $167,000 4 $81,750 52 $255,423 0 $0 5 $144,200 APPLICATIONS WITHDRAWN 1 $147,000 1 $120,000 17 $283,882 2 $39,000 2 $123,000 FILES CLOSED FOR INCOMPLETENESS 0 $0 0 $0 2 $203,000 0 $0 1 $206,000
Aggregated Statistics For Year 2008(Based on 2 full tracts) A) FHA, FSA/RHS & VA B) Conventional C) Refinancings D) Home Improvement Loans F) Non-occupant Loans on Number Average Value Number Average Value Number Average Value Number Average Value Number Average Value
LOANS ORIGINATED 17 $180,647 48 $195,083 75 $230,893 6 $94,000 8 $166,125 APPLICATIONS APPROVED, NOT ACCEPTED 3 $159,667 3 $108,000 9 $165,222 1 $200,000 2 $121,500 APPLICATIONS DENIED 5 $137,000 11 $192,727 36 $240,944 6 $33,833 5 $148,000 APPLICATIONS WITHDRAWN 0 $0 3 $105,000 10 $177,600 2 $225,000 0 $0 FILES CLOSED FOR INCOMPLETENESS 0 $0 1 $417,000 7 $220,571 0 $0 1 $163,000
Aggregated Statistics For Year 2007(Based on 2 full tracts) A) FHA, FSA/RHS & VA B) Conventional C) Refinancings D) Home Improvement Loans F) Non-occupant Loans on G) Loans On Manufactured Number Average Value Number Average Value Number Average Value Number Average Value Number Average Value Number Average Value
LOANS ORIGINATED 4 $234,500 86 $214,581 96 $252,000 9 $105,000 10 $174,400 0 $0 APPLICATIONS APPROVED, NOT ACCEPTED 2 $110,500 10 $154,600 29 $233,138 0 $0 6 $127,667 0 $0 APPLICATIONS DENIED 2 $119,000 6 $323,000 64 $323,969 9 $130,778 4 $321,000 1 $17,000 APPLICATIONS WITHDRAWN 0 $0 5 $241,800 23 $264,000 0 $0 4 $114,250 0 $0 FILES CLOSED FOR INCOMPLETENESS 0 $0 0 $0 8 $371,500 0 $0 0 $0 0 $0
Aggregated Statistics For Year 2006(Based on 2 full tracts) A) FHA, FSA/RHS & VA B) Conventional C) Refinancings D) Home Improvement Loans E) Loans on Dwellings For 5+ Families F) Non-occupant Loans on Number Average Value Number Average Value Number Average Value Number Average Value Number Average Value Number Average Value
LOANS ORIGINATED 1 $193,000 74 $255,595 142 $248,655 28 $106,464 1 $106,000 14 $202,214 APPLICATIONS APPROVED, NOT ACCEPTED 1 $220,000 6 $342,000 20 $227,650 2 $132,500 0 $0 2 $84,000 APPLICATIONS DENIED 0 $0 19 $527,474 73 $326,671 12 $39,833 0 $0 5 $325,400 APPLICATIONS WITHDRAWN 0 $0 9 $273,111 28 $320,893 1 $70,000 0 $0 3 $130,000 FILES CLOSED FOR INCOMPLETENESS 0 $0 1 $179,000 10 $252,600 0 $0 0 $0 1 $157,000
Aggregated Statistics For Year 2005(Based on 2 full tracts) A) FHA, FSA/RHS & VA B) Conventional C) Refinancings D) Home Improvement Loans F) Non-occupant Loans on Number Average Value Number Average Value Number Average Value Number Average Value Number Average Value
LOANS ORIGINATED 2 $218,000 107 $255,720 170 $266,759 7 $229,714 19 $164,789 APPLICATIONS APPROVED, NOT ACCEPTED 0 $0 7 $443,000 22 $304,091 0 $0 2 $393,000 APPLICATIONS DENIED 1 $147,000 14 $270,714 66 $241,091 7 $104,857 5 $251,800 APPLICATIONS WITHDRAWN 0 $0 8 $305,000 39 $265,821 4 $250,000 7 $200,286 FILES CLOSED FOR INCOMPLETENESS 0 $0 3 $134,333 14 $312,214 1 $25,000 0 $0
Aggregated Statistics For Year 2004(Based on 2 full tracts) A) FHA, FSA/RHS & VA B) Conventional C) Refinancings D) Home Improvement Loans F) Non-occupant Loans on Number Average Value Number Average Value Number Average Value Number Average Value Number Average Value
LOANS ORIGINATED 1 $218,000 119 $257,118 242 $259,950 12 $187,000 18 $150,500 APPLICATIONS APPROVED, NOT ACCEPTED 0 $0 15 $226,533 30 $248,767 1 $270,000 2 $225,500 APPLICATIONS DENIED 1 $226,000 13 $285,154 48 $239,167 10 $151,300 2 $170,000 APPLICATIONS WITHDRAWN 0 $0 8 $151,750 25 $232,960 3 $73,667 1 $240,000 FILES CLOSED FOR INCOMPLETENESS 0 $0 0 $0 19 $274,263 1 $100,000 1 $196,000
Aggregated Statistics For Year 2003(Based on 2 full tracts) A) FHA, FSA/RHS & VA B) Conventional C) Refinancings D) Home Improvement Loans F) Non-occupant Loans on Number Average Value Number Average Value Number Average Value Number Average Value Number Average Value
LOANS ORIGINATED 3 $70,000 104 $289,962 701 $239,845 10 $29,500 20 $149,600 APPLICATIONS APPROVED, NOT ACCEPTED 0 $0 7 $251,143 70 $240,429 0 $0 1 $192,000 APPLICATIONS DENIED 0 $0 6 $445,167 71 $265,423 8 $30,875 2 $286,500 APPLICATIONS WITHDRAWN 0 $0 5 $203,400 26 $264,615 2 $52,000 3 $196,667 FILES CLOSED FOR INCOMPLETENESS 0 $0 1 $675,000 15 $241,533 1 $140,000 0 $0
Aggregated Statistics For Year 2002(Based on 2 full tracts) A) FHA, FSA/RHS & VA B) Conventional C) Refinancings D) Home Improvement Loans F) Non-occupant Loans on Number Average Value Number Average Value Number Average Value Number Average Value Number Average Value
LOANS ORIGINATED 4 $131,000 102 $253,020 536 $249,410 14 $60,143 23 $174,522 APPLICATIONS APPROVED, NOT ACCEPTED 0 $0 5 $298,200 56 $252,286 7 $50,571 8 $169,500 APPLICATIONS DENIED 0 $0 2 $576,500 41 $253,659 4 $104,750 2 $32,500 APPLICATIONS WITHDRAWN 0 $0 9 $273,333 25 $242,080 5 $43,000 1 $301,000 FILES CLOSED FOR INCOMPLETENESS 0 $0 3 $203,000 14 $242,143 0 $0 1 $224,000
Aggregated Statistics For Year 2001(Based on 2 full tracts) A) FHA, FSA/RHS & VA B) Conventional C) Refinancings D) Home Improvement Loans F) Non-occupant Loans on Number Average Value Number Average Value Number Average Value Number Average Value Number Average Value
LOANS ORIGINATED 1 $129,000 96 $253,188 400 $231,718 12 $50,500 14 $157,929 APPLICATIONS APPROVED, NOT ACCEPTED 0 $0 9 $192,889 27 $176,741 3 $24,333 1 $309,000 APPLICATIONS DENIED 0 $0 9 $346,556 47 $261,681 4 $144,000 2 $99,500 APPLICATIONS WITHDRAWN 0 $0 5 $301,000 28 $203,500 2 $200,000 0 $0 FILES CLOSED FOR INCOMPLETENESS 0 $0 1 $300,000 11 $227,000 0 $0 1 $203,000
Aggregated Statistics For Year 2000(Based on 2 full tracts) B) Conventional C) Refinancings D) Home Improvement Loans F) Non-occupant Loans on Number Average Value Number Average Value Number Average Value Number Average Value
LOANS ORIGINATED 122 $254,705 82 $206,585 16 $38,000 8 $169,250 APPLICATIONS APPROVED, NOT ACCEPTED 6 $167,667 12 $181,333 4 $20,250 0 $0 APPLICATIONS DENIED 9 $214,889 18 $262,167 5 $56,800 0 $0 APPLICATIONS WITHDRAWN 8 $212,125 8 $124,125 6 $56,333 2 $106,000 FILES CLOSED FOR INCOMPLETENESS 1 $450,000 7 $257,429 0 $0 0 $0
Aggregated Statistics For Year 1999(Based on 2 full tracts) A) FHA, FSA/RHS & VA B) Conventional C) Refinancings D) Home Improvement Loans E) Loans on Dwellings For 5+ Families F) Non-occupant Loans on Number Average Value Number Average Value Number Average Value Number Average Value Number Average Value Number Average Value
LOANS ORIGINATED 1 $66,460 142 $236,864 220 $203,635 20 $35,090 1 $694,400 19 $133,754 APPLICATIONS APPROVED, NOT ACCEPTED 0 $0 7 $163,104 18 $214,959 2 $31,250 0 $0 1 $34,720 APPLICATIONS DENIED 0 $0 5 $146,872 16 $188,681 4 $23,298 0 $0 2 $156,240 APPLICATIONS WITHDRAWN 0 $0 3 $98,857 28 $174,766 1 $97,280 0 $0 2 $77,540 FILES CLOSED FOR INCOMPLETENESS 0 $0 3 $181,660 15 $200,733 0 $0 0 $0 0 $0
Detailed HMDA statistics for the following Tracts:
5504.00
, 5505.00
Private Mortgage Insurance Companies Aggregated Statistics For Year 2009(Based on 2 full tracts) A) Conventional B) Refinancings Number Average Value Number Average Value
LOANS ORIGINATED 1 $162,000 2 $299,500 APPLICATIONS APPROVED, NOT ACCEPTED 1 $135,000 3 $264,333 APPLICATIONS DENIED 0 $0 0 $0 APPLICATIONS WITHDRAWN 0 $0 0 $0 FILES CLOSED FOR INCOMPLETENESS 0 $0 0 $0
Aggregated Statistics For Year 2008(Based on 2 full tracts) A) Conventional B) Refinancings Number Average Value Number Average Value
LOANS ORIGINATED 8 $174,250 3 $265,667 APPLICATIONS APPROVED, NOT ACCEPTED 4 $193,750 3 $374,667 APPLICATIONS DENIED 1 $198,000 0 $0 APPLICATIONS WITHDRAWN 0 $0 0 $0 FILES CLOSED FOR INCOMPLETENESS 0 $0 0 $0
Aggregated Statistics For Year 2007(Based on 2 full tracts) A) Conventional B) Refinancings Number Average Value Number Average Value
LOANS ORIGINATED 14 $246,000 5 $209,200 APPLICATIONS APPROVED, NOT ACCEPTED 1 $275,000 0 $0 APPLICATIONS DENIED 0 $0 0 $0 APPLICATIONS WITHDRAWN 0 $0 0 $0 FILES CLOSED FOR INCOMPLETENESS 0 $0 0 $0
Aggregated Statistics For Year 2006(Based on 2 full tracts) A) Conventional B) Refinancings Number Average Value Number Average Value
LOANS ORIGINATED 7 $241,857 1 $416,000 APPLICATIONS APPROVED, NOT ACCEPTED 1 $222,000 2 $255,000 APPLICATIONS DENIED 0 $0 0 $0 APPLICATIONS WITHDRAWN 0 $0 0 $0 FILES CLOSED FOR INCOMPLETENESS 0 $0 0 $0
Aggregated Statistics For Year 2005(Based on 2 full tracts) A) Conventional B) Refinancings C) Non-occupant Loans on Number Average Value Number Average Value Number Average Value
LOANS ORIGINATED 4 $185,250 7 $216,571 3 $91,333 APPLICATIONS APPROVED, NOT ACCEPTED 1 $235,000 0 $0 0 $0 APPLICATIONS DENIED 1 $140,000 0 $0 1 $140,000 APPLICATIONS WITHDRAWN 0 $0 0 $0 0 $0 FILES CLOSED FOR INCOMPLETENESS 1 $241,000 0 $0 0 $0
Aggregated Statistics For Year 2004(Based on 2 full tracts) A) Conventional B) Refinancings C) Non-occupant Loans on Number Average Value Number Average Value Number Average Value
LOANS ORIGINATED 7 $252,571 3 $250,667 0 $0 APPLICATIONS APPROVED, NOT ACCEPTED 0 $0 1 $104,000 0 $0 APPLICATIONS DENIED 0 $0 1 $180,000 1 $180,000 APPLICATIONS WITHDRAWN 1 $203,000 2 $414,500 0 $0 FILES CLOSED FOR INCOMPLETENESS 0 $0 0 $0 0 $0
Aggregated Statistics For Year 2003(Based on 2 full tracts) A) Conventional B) Refinancings C) Non-occupant Loans on Number Average Value Number Average Value Number Average Value
LOANS ORIGINATED 11 $249,545 6 $266,333 1 $180,000 APPLICATIONS APPROVED, NOT ACCEPTED 0 $0 5 $248,400 0 $0 APPLICATIONS DENIED 0 $0 0 $0 0 $0 APPLICATIONS WITHDRAWN 1 $224,000 2 $187,500 1 $224,000 FILES CLOSED FOR INCOMPLETENESS 0 $0 0 $0 0 $0
Aggregated Statistics For Year 2002(Based on 2 full tracts) A) Conventional B) Refinancings C) Non-occupant Loans on Number Average Value Number Average Value Number Average Value
LOANS ORIGINATED 13 $300,385 5 $211,600 1 $285,000 APPLICATIONS APPROVED, NOT ACCEPTED 3 $308,667 3 $505,000 0 $0 APPLICATIONS DENIED 1 $90,000 0 $0 1 $90,000 APPLICATIONS WITHDRAWN 0 $0 2 $241,500 1 $203,000 FILES CLOSED FOR INCOMPLETENESS 0 $0 0 $0 0 $0
Aggregated Statistics For Year 2001(Based on 2 full tracts) A) Conventional B) Refinancings C) Non-occupant Loans on Number Average Value Number Average Value Number Average Value
LOANS ORIGINATED 15 $223,800 9 $196,333 1 $47,000 APPLICATIONS APPROVED, NOT ACCEPTED 2 $220,000 1 $48,000 0 $0 APPLICATIONS DENIED 0 $0 0 $0 0 $0 APPLICATIONS WITHDRAWN 1 $310,000 0 $0 0 $0 FILES CLOSED FOR INCOMPLETENESS 0 $0 0 $0 0 $0
Aggregated Statistics For Year 2000(Based on 2 full tracts) A) Conventional B) Refinancings C) Non-occupant Loans on Number Average Value Number Average Value Number Average Value
LOANS ORIGINATED 18 $200,222 5 $239,000 1 $167,000 APPLICATIONS APPROVED, NOT ACCEPTED 2 $182,000 2 $198,500 0 $0 APPLICATIONS DENIED 0 $0 0 $0 0 $0 APPLICATIONS WITHDRAWN 0 $0 0 $0 0 $0 FILES CLOSED FOR INCOMPLETENESS 0 $0 0 $0 0 $0
Aggregated Statistics For Year 1999(Based on 2 full tracts) A) Conventional B) Refinancings C) Non-occupant Loans on Number Average Value Number Average Value Number Average Value
LOANS ORIGINATED 19 $184,157 9 $163,488 2 $134,365 APPLICATIONS APPROVED, NOT ACCEPTED 0 $0 4 $194,900 0 $0 APPLICATIONS DENIED 0 $0 0 $0 0 $0 APPLICATIONS WITHDRAWN 1 $396,800 0 $0 0 $0 FILES CLOSED FOR INCOMPLETENESS 0 $0 0 $0 0 $0
Detailed PMIC statistics for the following Tracts:
5504.00
, 5505.00
Most common first names in Grosse Pointe, MI among deceased individuals Name Count Lived (average)
John 592 77.1 years Mary 590 81.4 years William 450 77.3 years Helen 332 82.9 years Joseph 330 77.7 years Robert 321 73.2 years George 312 77.8 years James 291 74.3 years Margaret 291 81.2 years Charles 265 75.6 years
Most common last names in Grosse Pointe, MI among deceased individuals Last name Count Lived (average)
Smith 158 79.5 years Miller 89 79.6 years Brown 88 79.2 years Johnson 79 79.2 years Williams 59 79.0 years Thomas 53 76.9 years Wilson 52 78.6 years Taylor 47 78.3 years Anderson 47 78.3 years Jones 45 77.5 years
Grosse Pointe compared to Michigan state average:
Median household income above state average. Median house value above state average. Unemployed percentage significantly below state average. Black race population percentage significantly below state average. Number of rooms per house above state average. House age significantly above state average. Percentage of population with a bachelor's degree or higher significantly above state average. Grosse Pointe on our top lists :
#19 on the list of "Top 101 cities with largest percentage of males in occupations: legal occupations (population 5,000+)"
#65 on the list of "Top 101 cities with the highest number of police officers per 1000 residents (population 5,000+)"
#93 on the list of "Top 101 cities with largest percentage of females in occupations: health diagnosing and treating practitioners and other technical occupations (population 5,000+)"
#93 on the list of "Top 101 cities with largest percentage of males in industries: management of companies and enterprises (population 5,000+)"
#95 on the list of "Top 100 cities with oldest houses (pop. 5,000+)"
#3 on the list of "Top 101 counties with the most Black Protestant adherents"
#4 on the list of "Top 101 counties with the most Catholic congregations"
#4 on the list of "Top 101 counties with the most Black Protestant congregations"
#4 on the list of "Top 101 counties with the highest surface withdrawal of fresh water for public supply"
#5 on the list of "Top 101 counties with the largest number of people moving out compared to moving in (pop. 50,000+)"
Top Patent Applicants
Alan L. Browne (214)
Nikolai K. Moshchuk (47)
Q. Ping Dou (5)
Raphael A. Monsanto (4)
Craig William White (4)
John W. Armaly, Jr. (4)
Michael Thomas Kramer (3)
James Beardslee (3)
Brendan F. Diamond (3)
Ion C. Halalay (3)
Total of 359 patent applications in 2008-2024.
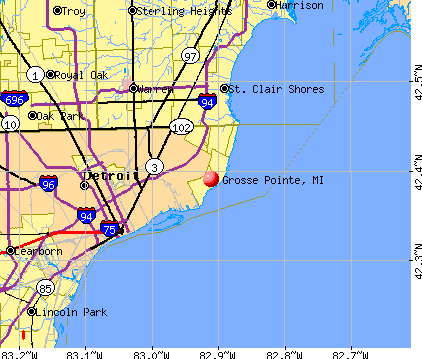


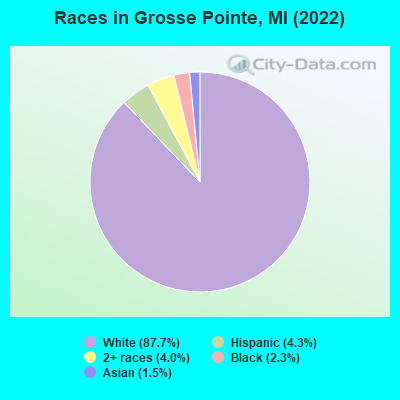
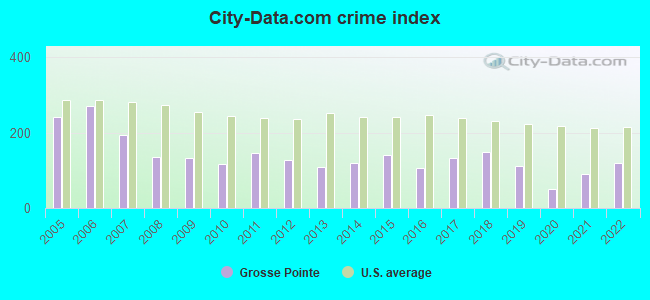
 Recent articles from our blog. Our writers, many of them Ph.D. graduates or candidates, create easy-to-read articles on a wide variety of topics.

 (6.7 miles