Estimated zip code population in 2022: 17,459 Zip code population in 2010: 16,976 Zip code population in 2000: 18,183
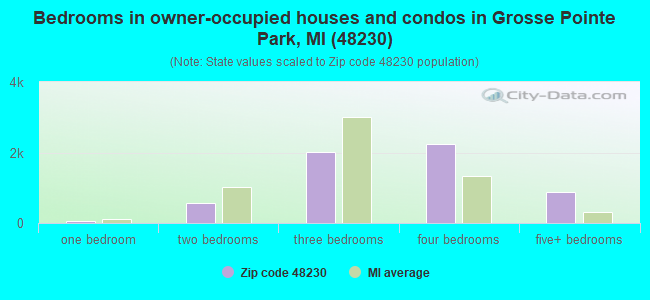
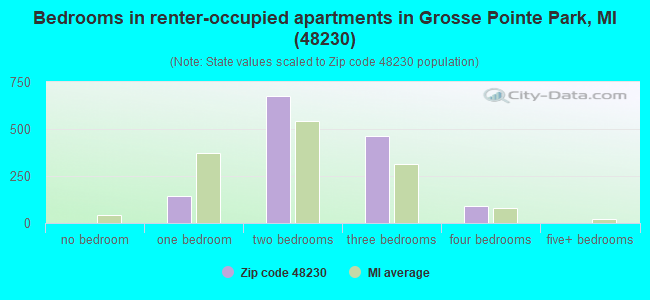
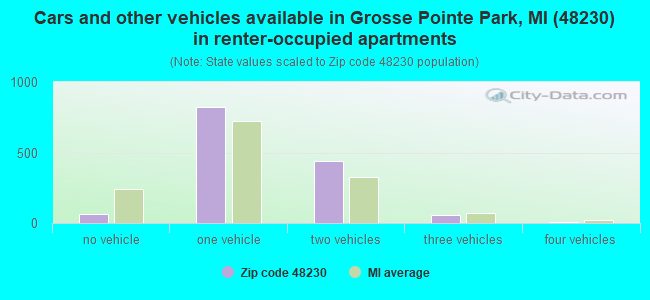
Houses and condos: 7,467 Renter-occupied apartments: 1,383
% of renters here:
19%
State:
27%
March 2022 cost of living index in zip code 48230: 97.9 (near average, U.S. average is 100)
Land area: 3.2 sq. mi. Water area: 1.2 sq. mi.
Population density: 5,408 people per square mile
(average).
OSM Map
General Map
Google Map
MSN Map
OSM Map
General Map
Google Map
MSN Map
OSM Map
General Map
Google Map
MSN Map
OSM Map
General Map
Google Map
MSN Map
Please wait while loading the map...
Real estate property taxes paid for housing units in 2022:
This zip code:
1.7% ($8,164)
Michigan:
1.2% ($2,746)
Median real estate property taxes paid for housing units with mortgages in 2022: $8,376 (1.8%) Median real estate property taxes paid for housing units with no mortgage in 2022: $7,921 (1.7%)
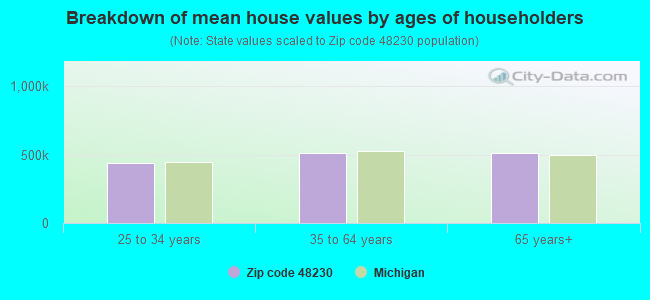
Estimated median house/condo value in 2022: $476,027
48230:
$476,027
Michigan:
$224,400
According to our research of Michigan and other state lists, there were 8 registered sex offenders living in 48230 zip code as of April 27, 2024. The ratio of all residents to sex offenders in zip code 48230 is 2,096 to 1. The ratio of registered sex offenders to all residents in this zip code is much lower than the state average.
Median resident age:
This zip code:
43.6 years
Michigan median age:
40.3 years
Average household size:
This zip code:
2.5 people
Michigan:
2.4 people
Averages for the 2020 tax year for zip code 48230, filed in 2021:
Average Adjusted Gross Income (AGI) in 2020: $158,438 (Individual Income Tax Returns)
Here:
$158,438
State:
$68,945
Salary/wage: $120,655 (reported on 77.8% of returns)
Here:
$120,655
State:
$57,142
(% of AGI for various income ranges: 964.3% for AGIs below $25k, 3559.5% for AGIs $25k-50k, 6340.5% for AGIs $50k-75k, 9353.3% for AGIs $75k-100k, 19327.3% for AGIs $100k-200k, 100251.6% for AGIs over 200k)
Taxable interest for individuals: $2,885 (reported on 43.7% of returns)
This zip code:
$2,885
Michigan:
$1,630
(% of AGI for various income ranges: 21.9% for AGIs below $25k, 59.0% for AGIs $25k-50k, 61.9% for AGIs $50k-75k, 122.1% for AGIs $75k-100k, 124.1% for AGIs $100k-200k, 1604.8% for AGIs over 200k)
Ordinary dividends: $13,792 (reported on 41.9% of returns)
Here:
$13,792
State:
$6,972
(% of AGI for various income ranges: 73.3% for AGIs below $25k, 177.8% for AGIs $25k-50k, 258.2% for AGIs $50k-75k, 460.5% for AGIs $75k-100k, 786.3% for AGIs $100k-200k, 7272.4% for AGIs over 200k)
Net capital gain/loss in AGI: +$23,136 (reported on 39.2% of returns)
Here:
+$23,136
State:
+$20,064
(% of AGI for various income ranges: 43.8% for AGIs below $25k, 111.6% for AGIs $25k-50k, 203.5% for AGIs $50k-75k, 357.4% for AGIs $75k-100k, 881.9% for AGIs $100k-200k, 13072.0% for AGIs over 200k)
Profit/loss from business: +$22,713 (reported on 20.5% of returns)
Here:
+$22,713
State:
+$11,172
(% of AGI for various income ranges: 104.5% for AGIs below $25k, 242.9% for AGIs $25k-50k, 435.3% for AGIs $50k-75k, 564.8% for AGIs $75k-100k, 1038.6% for AGIs $100k-200k, 4345.0% for AGIs over 200k)
Taxable individual retirement arrangement distribution: $33,853 (reported on 13.3% of returns)
48230:
$33,853
Michigan:
$19,803
(% of AGI for various income ranges: 66.7% for AGIs below $25k, 213.0% for AGIs $25k-50k, 348.9% for AGIs $50k-75k, 609.8% for AGIs $75k-100k, 1337.7% for AGIs $100k-200k, 3714.8% for AGIs over 200k)
Self-employed (Keogh) retirement plans: $30,845 (reported on 2.3% of returns)
48230:
$30,845
Michigan:
$25,132
(% of AGI for various income ranges: 86.3% for AGIs $100k-200k, 1064.6% for AGIs over 200k)
Total itemized deductions: $38,773 (reported on 18.2% of returns)
Here:
$38,773
State:
$34,117
(% of AGI for various income ranges: 100.6% for AGIs below $25k, 279.4% for AGIs $25k-50k, 472.1% for AGIs $50k-75k, 871.4% for AGIs $75k-100k, 1187.4% for AGIs $100k-200k, 7835.6% for AGIs over 200k)
Charity contributions: $12,538 (reported on 15.8% of returns)
Here:
$12,538
State:
$13,548
(% of AGI for various income ranges: 6.9% for AGIs below $25k, 33.6% for AGIs $25k-50k, 59.8% for AGIs $50k-75k, 134.0% for AGIs $75k-100k, 222.9% for AGIs $100k-200k, 2716.0% for AGIs over 200k)
Taxes paid: $9,308 (reported on 18.0% of returns)
48230:
$9,308
State:
$7,972
(% of AGI for various income ranges: 24.9% for AGIs below $25k, 71.1% for AGIs $25k-50k, 142.9% for AGIs $50k-75k, 296.4% for AGIs $75k-100k, 411.1% for AGIs $100k-200k, 1478.6% for AGIs over 200k)
Earned income credit: $1,705 (reported on 4.9% of returns)
Here:
$1,705
State:
$2,251
(% of AGI for various income ranges: 36.5% for AGIs below $25k, 33.4% for AGIs $25k-50k)
Percentage of individuals using paid preparers for their 2020 taxes: 91.1%
Here:
91%
State:
93%
(% for various income ranges: 89.3% for AGIs below $25k, 90.0% for AGIs $25k-50k, 92.6% for AGIs $50k-75k, 91.5% for AGIs $75k-100k, 91.6% for AGIs $100k-200k, 92.4% for AGIs over 200k)
Averages for the 2012 tax year for zip code 48230, filed in 2013:
Average Adjusted Gross Income (AGI) in 2012: $129,702 (Individual Income Tax Returns)
Here:
$129,702
State:
$55,609
Salary/wage: $96,941 (reported on 78.8% of returns)
Here:
$96,941
State:
$46,782
(% of AGI for various income ranges: 67.5% for AGIs below $25k, 70.6% for AGIs $25k-50k, 62.7% for AGIs $50k-75k, 64.1% for AGIs $75k-100k, 71.7% for AGIs $100k-200k, 52.3% for AGIs over 200k)
Taxable interest for individuals: $2,494 (reported on 47.7% of returns)
This zip code:
$2,494
Michigan:
$1,491
(% of AGI for various income ranges: 2.0% for AGIs below $25k, 1.0% for AGIs $25k-50k, 1.0% for AGIs $50k-75k, 0.8% for AGIs $75k-100k, 0.8% for AGIs $100k-200k, 0.9% for AGIs over 200k)
Ordinary dividends: $13,079 (reported on 41.9% of returns)
Here:
$13,079
State:
$6,225
(% of AGI for various income ranges: 5.4% for AGIs below $25k, 4.0% for AGIs $25k-50k, 4.0% for AGIs $50k-75k, 3.2% for AGIs $75k-100k, 2.4% for AGIs $100k-200k, 5.0% for AGIs over 200k)
Net capital gain/loss in AGI: +$15,511 (reported on 36.3% of returns)
Here:
+$15,511
State:
+$9,326
(% of AGI for various income ranges: 0.8% for AGIs $25k-50k, 0.5% for AGIs $50k-75k, 1.1% for AGIs $75k-100k, 1.2% for AGIs $100k-200k, 6.6% for AGIs over 200k)
Profit/loss from business: +$22,454 (reported on 20.8% of returns)
Here:
+$22,454
State:
+$11,523
(% of AGI for various income ranges: 8.9% for AGIs below $25k, 5.8% for AGIs $25k-50k, 4.5% for AGIs $50k-75k, 5.2% for AGIs $75k-100k, 3.9% for AGIs $100k-200k, 2.9% for AGIs over 200k)
Taxable individual retirement arrangement distribution: $27,189 (reported on 14.8% of returns)
48230:
$27,189
Michigan:
$15,298
(% of AGI for various income ranges: 3.6% for AGIs below $25k, 3.9% for AGIs $25k-50k, 4.7% for AGIs $50k-75k, 5.2% for AGIs $75k-100k, 4.8% for AGIs $100k-200k, 2.1% for AGIs over 200k)
Self-employment retirement plans: $28,354 (reported on 2.8% of returns)
48230:
$28,354
Michigan:
$20,834
(% of AGI for various income ranges: 0.4% for AGIs $50k-75k, 0.4% for AGIs $100k-200k, 0.9% for AGIs over 200k)
Total itemized deductions: $34,116 (16% of AGI, reported on 53.9% of returns)
Here:
$34,116
State:
$21,628
Here:
15.8% of AGI
State:
18.4% of AGI
(% of AGI for various income ranges: 18.9% for AGIs below $25k, 14.5% for AGIs $25k-50k, 17.0% for AGIs $50k-75k, 18.2% for AGIs $75k-100k, 17.7% for AGIs $100k-200k, 12.1% for AGIs over 200k)
Charity contributions: $6,287 (reported on 49.6% of returns)
Here:
$6,287
State:
$4,225
(% of AGI for various income ranges: 1.2% for AGIs below $25k, 1.6% for AGIs $25k-50k, 2.3% for AGIs $50k-75k, 2.1% for AGIs $75k-100k, 2.3% for AGIs $100k-200k, 2.6% for AGIs over 200k)
Taxes paid: $16,733 (reported on 53.8% of returns)
48230:
$16,733
State:
$8,327
(% of AGI for various income ranges: 6.1% for AGIs below $25k, 5.4% for AGIs $25k-50k, 7.0% for AGIs $50k-75k, 7.9% for AGIs $75k-100k, 8.4% for AGIs $100k-200k, 6.4% for AGIs over 200k)
Earned income credit: $1,807 (reported on 8.2% of returns)
Here:
$1,807
State:
$2,306
(% of AGI for various income ranges: 3.8% for AGIs below $25k, 0.6% for AGIs $25k-50k)
Percentage of individuals using paid preparers for their 2012 taxes: 59.2%
Here:
59%
State:
57%
(% for various income ranges: 53.5% for AGIs below $25k, 53.4% for AGIs $25k-50k, 61.5% for AGIs $50k-75k, 58.4% for AGIs $75k-100k, 60.9% for AGIs $100k-200k, 73.6% for AGIs over 200k)
Averages for the 2004 tax year for zip code 48230, filed in 2005:
Average Adjusted Gross Income (AGI) in 2004: $105,999 (Individual Income Tax Returns)
Here:
$105,999
State:
$48,204
Salary/wage: $90,656 (reported on 78.1% of returns)
Here:
$90,656
State:
$42,791
(% of AGI for various income ranges: 63.5% for AGIs $10k-25k, 70.5% for AGIs $25k-50k, 68.7% for AGIs $50k-75k, 71.9% for AGIs $75k-100k, 62.0% for AGIs over 100k)
Taxable interest for individuals: $3,935 (reported on 64.8% of returns)
This zip code:
$3,935
Michigan:
$1,725
(% of AGI for various income ranges: 5.3% for AGIs $10k-25k, 3.0% for AGIs $25k-50k, 2.2% for AGIs $50k-75k, 1.7% for AGIs $75k-100k, 1.9% for AGIs over 100k)
Taxable dividends: $9,449 (reported on 51.6% of returns)
Here:
$9,449
State:
$3,420
(% of AGI for various income ranges: 5.9% for AGIs $10k-25k, 3.5% for AGIs $25k-50k, 3.9% for AGIs $50k-75k, 3.2% for AGIs $75k-100k, 4.5% for AGIs over 100k)
Net capital gain/loss: +$20,998 (reported on 43.5% of returns)
Here:
+$20,998
State:
+$8,532
(% of AGI for various income ranges: 1.3% for AGIs $10k-25k, 1.7% for AGIs $25k-50k, 0.9% for AGIs $50k-75k, 1.3% for AGIs $75k-100k, 10.1% for AGIs over 100k)
Profit/loss from business: +$20,815 (reported on 19.4% of returns)
Here:
+$20,815
State:
+$9,547
(% of AGI for various income ranges: 7.1% for AGIs $10k-25k, 3.3% for AGIs $25k-50k, 5.4% for AGIs $50k-75k, 4.7% for AGIs $75k-100k, 3.4% for AGIs over 100k)
IRA payment deduction: $3,602 (reported on 2.7% of returns)
48230:
$3,602
Michigan:
$2,875
(% of AGI for various income ranges: 0.3% for AGIs $10k-25k, 0.3% for AGIs $25k-50k, 0.3% for AGIs $50k-75k, 0.2% for AGIs $75k-100k, 0.0% for AGIs over 100k)
Self-employed pension: $17,769 (reported on 3.5% of returns)
Here:
$17,769
Michigan:
$13,826
(% of AGI for various income ranges: 0.1% for AGIs $25k-50k, 0.3% for AGIs $50k-75k, 0.2% for AGIs $75k-100k, 0.7% for AGIs over 100k)
Total itemized deductions: $31,661 (18% of AGI, reported on 57.4% of returns)
Here:
$31,661
State:
$18,509
Here:
18.1% of AGI
State:
20.7% of AGI
(% of AGI for various income ranges: 21.6% for AGIs $10k-25k, 18.3% for AGIs $25k-50k, 22.5% for AGIs $50k-75k, 23.6% for AGIs $75k-100k, 15.0% for AGIs over 100k)
Charity contributions deductions: $6,043 (3% of AGI, reported on 54.1% of returns)
Here:
$6,043
State:
$3,365
Here:
3.4% of AGI
State:
3.6% of AGI
(% of AGI for various income ranges: 2.2% for AGIs $10k-25k, 2.1% for AGIs $25k-50k, 2.7% for AGIs $50k-75k, 2.9% for AGIs $75k-100k, 3.1% for AGIs over 100k)
Total tax: $24,706 (reported on 81.3% of returns)
48230:
$24,706
State:
$7,691
(% of AGI for various income ranges: 4.9% for AGIs $10k-25k, 7.6% for AGIs $25k-50k, 9.8% for AGIs $50k-75k, 10.3% for AGIs $75k-100k, 20.7% for AGIs over 100k)
Earned income credit: $1,414 (reported on 5.3% of returns)
Here:
$1,414
State:
$1,737
Percentage of individuals using paid preparers for their 2004 taxes: 59.9%
Here:
60%
State:
60%
(% for various income ranges: 52.1% for AGIs below $10k, 58.0% for AGIs $10k-25k, 59.5% for AGIs $25k-50k, 63.4% for AGIs $50k-75k, 58.0% for AGIs $75k-100k, 65.2% for AGIs over 100k)
Likely homosexual households (counted as self-reported same-sex unmarried-partner households)
Lesbian couples: 0.0% of all households
Gay men: 0.2% of all households
Household received Food Stamps/SNAP in the past 12 months: 299 Household did not receive Food Stamps/SNAP in the past 12 months: 6,753
Women who had a birth in the past 12 months: 181 (182 now married, 3 unmarried) Women who did not have a birth in the past 12 months: 3,640 (1,724 now married, 1,909 unmarried)
Housing units in zip code 48230 with a mortgage: 3,628 (353 second mortgage, 8 home equity loan, 285 both second mortgage and home equity loan) Houses without a mortgage: 62
Median monthly owner costs for units with a mortgage: $2,571 Median monthly owner costs for units without a mortgage: $1,200
Residents with income below the poverty level in 2022:
This zip code:
3.3%
Whole state:
13.4%
Residents with income below 50% of the poverty level in 2022:
This zip code:
1.0%
Whole state:
6.9%
Median number of rooms in houses and condos:
Here:
8.1
State:
6.5
Median number of rooms in apartments:
Here:
5.3
State:
4.3
Notable locations in this zip code not listed on our city pages
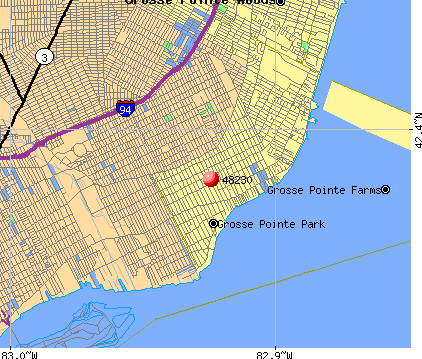
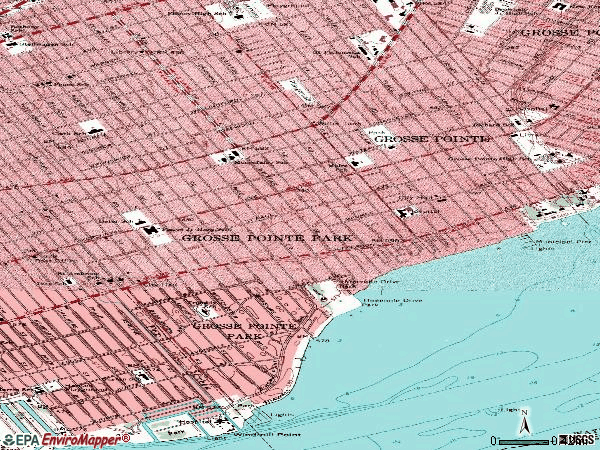
Notable locations in zip code 48230: Windmill Point Light (A), Grosse Point City Hall (B), Grosse Pointe City Department of Public Safety Fire Station (C), Grosse Point Park City Hall (D), Grosse Pointe Park Department of Public Safety Fire Station (E), Grosse Point Police Station (F). Display/hide their locations on the map
Churches in zip code 48230 include: Christ the Lord Christian Center (A), Saint Clare of Montefalco Catholic Church (B). Display/hide their locations on the map
Parks in zip code 48230 include: Threemile Drive Park (1), Fox Indian Massacre Historical Marker (2), Lewis E Maire Elementary School Historical Marker (3), Voigt-Kreit House Historical Marker (4), Voigt on Public Education Historical Marker (5), Wardwell House Historical Marker (6). Display/hide their locations on the map
In group quarters: 5 (-1 institutionalized population)
Size of family households: 2,396 2-persons, 1,193 3-persons, 962 4-persons, 360 5-persons, 84 6-persons, 74 7-or-more-persons
Size of nonfamily households: 1,804 1-person, 182 2-persons, 18 3-persons
3,178 married couples with children.
540 single-parent households (267 men, 273 women).
90.7% of residents of 48230 zip code speak English at home.
2.5% of residents speak Spanish at home (75% very well, 20% well, 5% not well).
5.1% of residents speak other Indo-European language at home (74% very well, 25% well, 2% not well).
0.9% of residents speak Asian or Pacific Island language at home (63% very well, 23% well, 14% not well).
0.6% of residents speak other language at home (81% very well, 7% well, 12% not well).
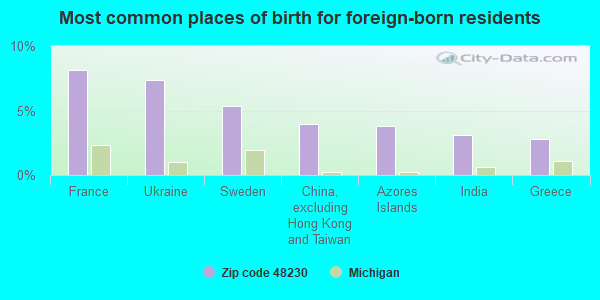
Foreign born population: 1,226 (7.0%) (67.7% of them are naturalized citizens)
This zip code:
7.0%
Whole state:
6.9%
8%France
7%Ukraine
5%Sweden
4%China, excluding Hong Kong and Taiwan
4%Azores Islands
3%India
3%Greece
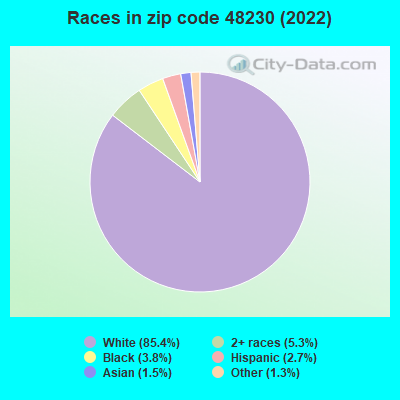
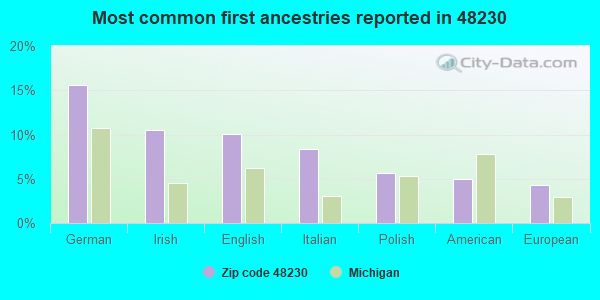
16%German
11%Irish
10%English
8%Italian
6%Polish
5%American
4%European
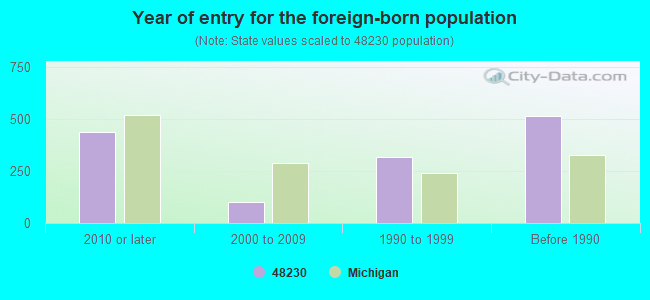
Year of entry for the foreign-born population
4372010 or later
1032000 to 2009
3191990 to 1999
516Before 1990
Facilities with environmental interests located in this zip code:
GEORGE DEFER ELEMENTARY SCHOOL (15425 KERCHEVAL STREET in GROSSE POINTE PARK, MI)
(National Center for Education Statistics) - STATE ID-01386 Organizations: GROSSE POINTE PUBLIC SCHOOLS (SCHOOL DISTRICT)
AMOCO OIL CO 5637 (17800 MACK AVE in GROSSE POINTE, MI)
(Resource Conservation and Recovery Act (tracking hazardous waste)) Organizations: AMOCO OIL COMPANY (CONTACT/OWNER)
BON SECOURS HOSPITAL (15426 KERCHEVAL in GROSSE POINTE PARK, MI)
(Resource Conservation and Recovery Act (tracking hazardous waste)) Organizations: SECOURS BON HEALTH SYSTEMS INC (CONTACT/OWNER)
MI DEPT/TRANSPORTATION BRIDGE P11-82025 (I-94 UNDER KENSINGTON PED WALK in DETROIT, MI)
(Resource Conservation and Recovery Act (tracking hazardous waste)) Organizations: MICH DEPT OF TRANSPORTATION (CONTACT/OPERATOR)
Alternative names: MIDOT BRIDGE I-94 UNDER KENSINGTON PWALK
GROSSE POINTE PUBLIC SCHOOL (389 SAINT CLAIR STREET in GROSSE POINTE, MI)
COMPLIANCE ACTIVITY (Tracking inspections of insecticide, fungicide, and rodenticide, and toxic substances) Business SIC classification: ELEMENTARY AND SECONDARY SCHOOLS
Housing units lacking complete plumbing facilities: 0.3% Housing units lacking complete kitchen facilities: 1.3%
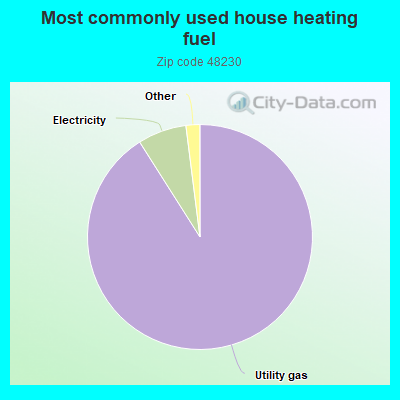
91.0%Utility gas
7.0%Electricity
0.7%Bottled, tank, or LP gas
0.6%Other fuel
Population in 1990: 19,302.
Place of birth for U.S.-born residents:
This state: 12,768
Northeast: 826
Midwest: 1,304
South: 780
West: 404
62% of the 48230 zip code residents lived in the same house 5 years ago. Out of people who lived in different houses, 58% lived in this county. Out of people who lived in different counties, 50% lived in Michigan.
91% of the 48230 zip code residents lived in the same house 1 year ago. Out of people who lived in different houses, 43% moved from this county. Out of people who lived in different houses, 25% moved from different county within same state. Out of people who lived in different houses, 32% moved from different state. Out of people who lived in different houses, 4% moved from abroad.
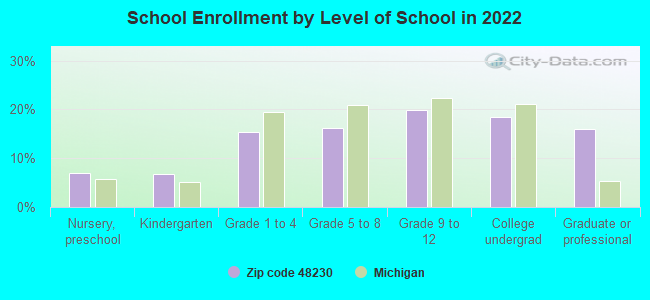
Private vs. public school enrollment:
Students in private schools in grades 1 to 8 (elementary and middle school): 198
Here:
13.2%
Michigan:
12.4%
Students in private schools in grades 9 to 12 (high school): 104
Here:
11.0%
Michigan:
9.8%
Students in private undergraduate colleges: 161
Here:
18.3%
Michigan:
14.9%
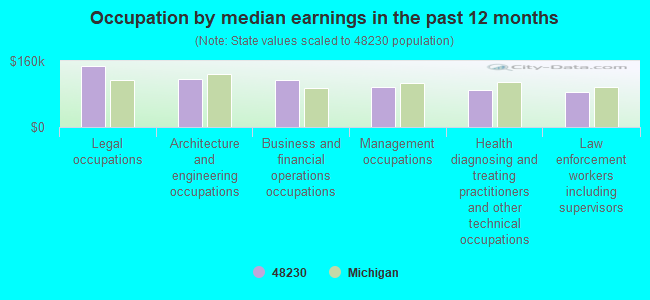
Occupation by median earnings in the past 12 months ($)
147,737Legal occupations
116,014Architecture and engineering occupations
113,860Business and financial operations occupations
97,740Management occupations
90,162Health diagnosing and treating practitioners and other technical occupations
83,813Law enforcement workers including supervisors
Companies with federal contracts located in this zip code:
DM MANUFACTURING, INC (766 LAKELAND in GROSSE POINTE, MI; small business) : $391,009 in 7 contractsfrom 2000 to 2002
Contracts for Aircraft Launching Equipment, Aircraft Ground Servicing Equipment, Miscellaneous Aircraft Accessories and Components, Tractors, Wheeled, and moreby Department of Defense, Army Signed by year:2000: $267,478; 2001: -$19,825; 2002: $143,356; 2003: $0; 2004: $0; 2005: $0; 2006: $0.
Biggest contracts:
$143,356 with Department of Defense for Aircraft Launching Equipment. Signed on 2002-09-30. Completion date: 2003-10-01.
$124,031 with Army for Aircraft Ground Servicing Equipment. Taking place in NY. Signed on 2001-02-12. Completion date: 2001-02-22.
$99,999 with Department of Defense for Miscellaneous Aircraft Accessories and Components. Signed on 2000-12-13. Completion date: 2001-03-15.
$99,999, same as above.Signed on 2000-12-13. Completion date: 2001-03-15.
JEAN G. CHARBONNEAU (824 NEFF ROAD in GROSS POINTE, MI; small business)
$30,000 with National Institutes of Health for Program Management/Support Services. Signed on 2003-11-18. Completion date: 2004-09-30.
SUPERIOR STORAGE SYSTEMS (917 BALFOUR in GROSSE POINTE, MI; small business)
$14,345 with Air Force for Conveyors. Taking place in NJ. Signed on 2005-05-20. Completion date: 2005-07-15.
THOMAS R ALDERTON, INC (656 UNIVERSITY PLACE in GROSSE POINTE, MI; small business) : $9,975 in 2 contractsin 2000
$9,975 with Army for Engineering and Technical Services. Signed on 2000-10-13. Completion date: 2001-01-31.
$0, same as above.Signed on 2000-10-13. Completion date: 2001-01-31.
TECH SOLUTIONS INC (15001 KERCHEVAL in GROSSE POINTE, MI; small business)
$4,565 with Army for Miscellaneous Communication Equipment. Signed on 2004-01-30. Completion date: 2004-02-29.
Top industries in this zip code by the number of employees in 2005:
Health Care and Social Assistance: General Medical and Surgical Hospitals (over 1000 employees: 1 establishment, 20-49 employees: 1 establishment)
2002 - 2018 National Fire Incident Reporting System (NFIRS) incidents
According to the data from the years 2002 - 2018 the average number of fires per year is 31. The highest number of fires - 48 took place in 2003, and the least - 20 in 2006. The data has a dropping trend.
When looking into fire subcategories, the most reports belonged to: Structure Fires (70.5%), and Outside Fires (17.8%).
Fire incident types reported to NFIRS in Zip Code 48230

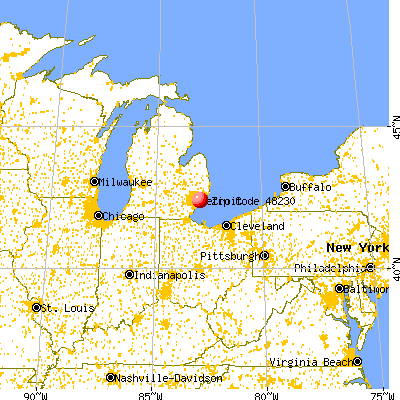


 Nearest zip codes: 48215, 48224, 48236, 48225, 48214, 48213.


 According to the data from the years 2002 - 2018 the average number of fires per year is 31. The highest number of fires - 48 took place in 2003, and the least - 20 in 2006. The data has a dropping trend.
 When looking into fire subcategories, the most reports belonged to: Structure Fires (70.5%), and Outside Fires (17.8%).