Estimated zip code population in 2022: 38,102
Zip code population in 2010: 44,439
Zip code population in 2000: 55,437
Houses and condos: 16,843
Renter-occupied apartments: 5,584
% of renters here:
42%State:
27%
March 2022 cost of living index in zip code 48224: 94.6
(less than average, U.S. average is 100)
Land area: 5.7
sq. mi.
Water area: 0.0
sq. mi.
Population density: 6,644 people per square mile (high).
OSM Map
General Map
Google Map
MSN Map
OSM Map
General Map
Google Map
MSN Map
OSM Map
General Map
Google Map
MSN Map
OSM Map
General Map
Google Map
MSN Map
Please wait while loading the map...
Real estate property taxes paid for housing units in 2022:
This zip code:
2.1% ($1,509)Michigan:
1.2% ($2,746)
Median real estate property taxes paid for housing units with mortgages in 2022: $1,487 (1.5%)
Median real estate property taxes paid for housing units with no mortgage in 2022: $1,532 (2.5%)
Profiles of local businesses
Business Search - 14 Million verified businesses
Males: 17,463 Females: 20,640
For population 25 years and over in 48224:
High school or higher: 83.1%Bachelor's degree or higher: 13.2%Graduate or professional degree: 4.6%Unemployed: 13.3%Mean travel time to work (commute): 26.7 minutes
For population 15 years and over in 48224:
Never married: 55.7%Now married: 26.4%Separated: 2.4%Widowed: 4.8%Divorced: 10.6%
Zip code 48224 compared to state average:
Median household income below state average. Median house value significantly below state average. Unemployed percentage above state average. Black race population percentage significantly above state average. Hispanic race population percentage significantly below state average. Median age below state average. Foreign-born population percentage significantly below state average. Renting percentage above state average. Length of stay since moving in significantly above state average. House age above state average. Percentage of population with a bachelor's degree or higher significantly below state average. 33,713 88.5% Black 2,885 7.6% White 699 1.8% Two or more races 494 1.3% Hispanic or Latino 214 0.6% American Indian 59 0.2% Some other race 25 0.07% Asian 9 0.02% Native Hawaiian and Other
Data:
Median household income ($)
Median household income (% change since 2000)
Household income diversity
Ratio of average income to average house value (%)
Ratio of average income to average rent
Median household income ($) - White
Median household income ($) - Black or African American
Median household income ($) - Asian
Median household income ($) - Hispanic or Latino
Median household income ($) - American Indian and Alaska Native
Median household income ($) - Multirace
Median household income ($) - Other Race
Median household income for houses/condos with a mortgage ($)
Median household income for apartments without a mortgage ($)
Races - White alone (%)
Races - White alone (% change since 2000)
Races - Black alone (%)
Races - Black alone (% change since 2000)
Races - American Indian alone (%)
Races - American Indian alone (% change since 2000)
Races - Asian alone (%)
Races - Asian alone (% change since 2000)
Races - Hispanic (%)
Races - Hispanic (% change since 2000)
Races - Native Hawaiian and Other Pacific Islander alone (%)
Races - Native Hawaiian and Other Pacific Islander alone (% change since 2000)
Races - Two or more races (%)
Races - Two or more races (% change since 2000)
Races - Other race alone (%)
Races - Other race alone (% change since 2000)
Racial diversity
Unemployment (%)
Unemployment (% change since 2000)
Unemployment (%) - White
Unemployment (%) - Black or African American
Unemployment (%) - Asian
Unemployment (%) - Hispanic or Latino
Unemployment (%) - American Indian and Alaska Native
Unemployment (%) - Multirace
Unemployment (%) - Other Race
Population density (people per square mile)
Population - Males (%)
Population - Females (%)
Population - Males (%) - White
Population - Males (%) - Black or African American
Population - Males (%) - Asian
Population - Males (%) - Hispanic or Latino
Population - Males (%) - American Indian and Alaska Native
Population - Males (%) - Multirace
Population - Males (%) - Other Race
Population - Females (%) - White
Population - Females (%) - Black or African American
Population - Females (%) - Asian
Population - Females (%) - Hispanic or Latino
Population - Females (%) - American Indian and Alaska Native
Population - Females (%) - Multirace
Population - Females (%) - Other Race
Coronavirus confirmed cases (Apr 27, 2024)
Deaths caused by coronavirus (Apr 27, 2024)
Coronavirus confirmed cases (per 100k population) (Apr 27, 2024)
Deaths caused by coronavirus (per 100k population) (Apr 27, 2024)
Daily increase in number of cases (Apr 27, 2024)
Weekly increase in number of cases (Apr 27, 2024)
Cases doubled (in days) (Apr 27, 2024)
Hospitalized patients (Apr 18, 2022)
Negative test results (Apr 18, 2022)
Total test results (Apr 18, 2022)
COVID Vaccine doses distributed (per 100k population) (Sep 19, 2023)
COVID Vaccine doses administered (per 100k population) (Sep 19, 2023)
COVID Vaccine doses distributed (Sep 19, 2023)
COVID Vaccine doses administered (Sep 19, 2023)
Likely homosexual households (%)
Likely homosexual households (% change since 2000)
Likely homosexual households - Lesbian couples (%)
Likely homosexual households - Lesbian couples (% change since 2000)
Likely homosexual households - Gay men (%)
Likely homosexual households - Gay men (% change since 2000)
Cost of living index
Median gross rent ($)
Median contract rent ($)
Median monthly housing costs ($)
Median house or condo value ($)
Median house or condo value ($ change since 2000)
Mean house or condo value by units in structure - 1, detached ($)
Mean house or condo value by units in structure - 1, attached ($)
Mean house or condo value by units in structure - 2 ($)
Mean house or condo value by units in structure by units in structure - 3 or 4 ($)
Mean house or condo value by units in structure - 5 or more ($)
Mean house or condo value by units in structure - Boat, RV, van, etc. ($)
Mean house or condo value by units in structure - Mobile home ($)
Median house or condo value ($) - White
Median house or condo value ($) - Black or African American
Median house or condo value ($) - Asian
Median house or condo value ($) - Hispanic or Latino
Median house or condo value ($) - American Indian and Alaska Native
Median house or condo value ($) - Multirace
Median house or condo value ($) - Other Race
Median resident age
Resident age diversity
Median resident age - Males
Median resident age - Females
Median resident age - White
Median resident age - Black or African American
Median resident age - Asian
Median resident age - Hispanic or Latino
Median resident age - American Indian and Alaska Native
Median resident age - Multirace
Median resident age - Other Race
Median resident age - Males - White
Median resident age - Males - Black or African American
Median resident age - Males - Asian
Median resident age - Males - Hispanic or Latino
Median resident age - Males - American Indian and Alaska Native
Median resident age - Males - Multirace
Median resident age - Males - Other Race
Median resident age - Females - White
Median resident age - Females - Black or African American
Median resident age - Females - Asian
Median resident age - Females - Hispanic or Latino
Median resident age - Females - American Indian and Alaska Native
Median resident age - Females - Multirace
Median resident age - Females - Other Race
Commute - mean travel time to work (minutes)
Travel time to work - Less than 5 minutes (%)
Travel time to work - Less than 5 minutes (% change since 2000)
Travel time to work - 5 to 9 minutes (%)
Travel time to work - 5 to 9 minutes (% change since 2000)
Travel time to work - 10 to 19 minutes (%)
Travel time to work - 10 to 19 minutes (% change since 2000)
Travel time to work - 20 to 29 minutes (%)
Travel time to work - 20 to 29 minutes (% change since 2000)
Travel time to work - 30 to 39 minutes (%)
Travel time to work - 30 to 39 minutes (% change since 2000)
Travel time to work - 40 to 59 minutes (%)
Travel time to work - 40 to 59 minutes (% change since 2000)
Travel time to work - 60 to 89 minutes (%)
Travel time to work - 60 to 89 minutes (% change since 2000)
Travel time to work - 90 or more minutes (%)
Travel time to work - 90 or more minutes (% change since 2000)
Marital status - Never married (%)
Marital status - Now married (%)
Marital status - Separated (%)
Marital status - Widowed (%)
Marital status - Divorced (%)
Median family income ($)
Median family income (% change since 2000)
Median non-family income ($)
Median non-family income (% change since 2000)
Median per capita income ($)
Median per capita income (% change since 2000)
Median family income ($) - White
Median family income ($) - Black or African American
Median family income ($) - Asian
Median family income ($) - Hispanic or Latino
Median family income ($) - American Indian and Alaska Native
Median family income ($) - Multirace
Median family income ($) - Other Race
Median year house/condo built
Median year apartment built
Year house built - Built 2005 or later (%)
Year house built - Built 2000 to 2004 (%)
Year house built - Built 1990 to 1999 (%)
Year house built - Built 1980 to 1989 (%)
Year house built - Built 1970 to 1979 (%)
Year house built - Built 1960 to 1969 (%)
Year house built - Built 1950 to 1959 (%)
Year house built - Built 1940 to 1949 (%)
Year house built - Built 1939 or earlier (%)
Average household size
Household density (households per square mile)
Average household size - White
Average household size - Black or African American
Average household size - Asian
Average household size - Hispanic or Latino
Average household size - American Indian and Alaska Native
Average household size - Multirace
Average household size - Other Race
Occupied housing units (%)
Vacant housing units (%)
Owner occupied housing units (%)
Renter occupied housing units (%)
Vacancy status - For rent (%)
Vacancy status - For sale only (%)
Vacancy status - Rented or sold, not occupied (%)
Vacancy status - For seasonal, recreational, or occasional use (%)
Vacancy status - For migrant workers (%)
Vacancy status - Other vacant (%)
Residents with income below the poverty level (%)
Residents with income below 50% of the poverty level (%)
Children below poverty level (%)
Poor families by family type - Married-couple family (%)
Poor families by family type - Male, no wife present (%)
Poor families by family type - Female, no husband present (%)
Poverty status for native-born residents (%)
Poverty status for foreign-born residents (%)
Poverty among high school graduates not in families (%)
Poverty among people who did not graduate high school not in families (%)
Residents with income below the poverty level (%) - White
Residents with income below the poverty level (%) - Black or African American
Residents with income below the poverty level (%) - Asian
Residents with income below the poverty level (%) - Hispanic or Latino
Residents with income below the poverty level (%) - American Indian and Alaska Native
Residents with income below the poverty level (%) - Multirace
Residents with income below the poverty level (%) - Other Race
Air pollution - Air Quality Index (AQI)
Air pollution - CO
Air pollution - NO2
Air pollution - SO2
Air pollution - Ozone
Air pollution - PM10
Air pollution - PM25
Air pollution - Pb
Crime - Murders per 100,000 population
Crime - Rapes per 100,000 population
Crime - Robberies per 100,000 population
Crime - Assaults per 100,000 population
Crime - Burglaries per 100,000 population
Crime - Thefts per 100,000 population
Crime - Auto thefts per 100,000 population
Crime - Arson per 100,000 population
Crime - City-data.com crime index
Crime - Violent crime index
Crime - Property crime index
Crime - Murders per 100,000 population (5 year average)
Crime - Rapes per 100,000 population (5 year average)
Crime - Robberies per 100,000 population (5 year average)
Crime - Assaults per 100,000 population (5 year average)
Crime - Burglaries per 100,000 population (5 year average)
Crime - Thefts per 100,000 population (5 year average)
Crime - Auto thefts per 100,000 population (5 year average)
Crime - Arson per 100,000 population (5 year average)
Crime - City-data.com crime index (5 year average)
Crime - Violent crime index (5 year average)
Crime - Property crime index (5 year average)
1996 Presidential Elections Results (%) - Democratic Party (Clinton)
1996 Presidential Elections Results (%) - Republican Party (Dole)
1996 Presidential Elections Results (%) - Other
2000 Presidential Elections Results (%) - Democratic Party (Gore)
2000 Presidential Elections Results (%) - Republican Party (Bush)
2000 Presidential Elections Results (%) - Other
2004 Presidential Elections Results (%) - Democratic Party (Kerry)
2004 Presidential Elections Results (%) - Republican Party (Bush)
2004 Presidential Elections Results (%) - Other
2008 Presidential Elections Results (%) - Democratic Party (Obama)
2008 Presidential Elections Results (%) - Republican Party (McCain)
2008 Presidential Elections Results (%) - Other
2012 Presidential Elections Results (%) - Democratic Party (Obama)
2012 Presidential Elections Results (%) - Republican Party (Romney)
2012 Presidential Elections Results (%) - Other
2016 Presidential Elections Results (%) - Democratic Party (Clinton)
2016 Presidential Elections Results (%) - Republican Party (Trump)
2016 Presidential Elections Results (%) - Other
2020 Presidential Elections Results (%) - Democratic Party (Biden)
2020 Presidential Elections Results (%) - Republican Party (Trump)
2020 Presidential Elections Results (%) - Other
Ancestries Reported - Arab (%)
Ancestries Reported - Czech (%)
Ancestries Reported - Danish (%)
Ancestries Reported - Dutch (%)
Ancestries Reported - English (%)
Ancestries Reported - French (%)
Ancestries Reported - French Canadian (%)
Ancestries Reported - German (%)
Ancestries Reported - Greek (%)
Ancestries Reported - Hungarian (%)
Ancestries Reported - Irish (%)
Ancestries Reported - Italian (%)
Ancestries Reported - Lithuanian (%)
Ancestries Reported - Norwegian (%)
Ancestries Reported - Polish (%)
Ancestries Reported - Portuguese (%)
Ancestries Reported - Russian (%)
Ancestries Reported - Scotch-Irish (%)
Ancestries Reported - Scottish (%)
Ancestries Reported - Slovak (%)
Ancestries Reported - Subsaharan African (%)
Ancestries Reported - Swedish (%)
Ancestries Reported - Swiss (%)
Ancestries Reported - Ukrainian (%)
Ancestries Reported - United States (%)
Ancestries Reported - Welsh (%)
Ancestries Reported - West Indian (%)
Ancestries Reported - Other (%)
Educational Attainment - No schooling completed (%)
Educational Attainment - Less than high school (%)
Educational Attainment - High school or equivalent (%)
Educational Attainment - Less than 1 year of college (%)
Educational Attainment - 1 or more years of college (%)
Educational Attainment - Associate degree (%)
Educational Attainment - Bachelor's degree (%)
Educational Attainment - Master's degree (%)
Educational Attainment - Professional school degree (%)
Educational Attainment - Doctorate degree (%)
School Enrollment - Nursery, preschool (%)
School Enrollment - Kindergarten (%)
School Enrollment - Grade 1 to 4 (%)
School Enrollment - Grade 5 to 8 (%)
School Enrollment - Grade 9 to 12 (%)
School Enrollment - College undergrad (%)
School Enrollment - Graduate or professional (%)
School Enrollment - Not enrolled in school (%)
School enrollment - Public schools (%)
School enrollment - Private schools (%)
School enrollment - Not enrolled (%)
Median number of rooms in houses and condos
Median number of rooms in apartments
Housing units lacking complete plumbing facilities (%)
Housing units lacking complete kitchen facilities (%)
Density of houses
Urban houses (%)
Rural houses (%)
Households with people 60 years and over (%)
Households with people 65 years and over (%)
Households with people 75 years and over (%)
Households with one or more nonrelatives (%)
Households with no nonrelatives (%)
Population in households (%)
Family households (%)
Nonfamily households (%)
Population in families (%)
Family households with own children (%)
Median number of bedrooms in owner occupied houses
Mean number of bedrooms in owner occupied houses
Median number of bedrooms in renter occupied houses
Mean number of bedrooms in renter occupied houses
Median number of vehichles in owner occupied houses
Mean number of vehichles in owner occupied houses
Median number of vehichles in renter occupied houses
Mean number of vehichles in renter occupied houses
Mortgage status - with mortgage (%)
Mortgage status - with second mortgage (%)
Mortgage status - with home equity loan (%)
Mortgage status - with both second mortgage and home equity loan (%)
Mortgage status - without a mortgage (%)
Average family size
Average family size - White
Average family size - Black or African American
Average family size - Asian
Average family size - Hispanic or Latino
Average family size - American Indian and Alaska Native
Average family size - Multirace
Average family size - Other Race
Geographical mobility - Same house 1 year ago (%)
Geographical mobility - Moved within same county (%)
Geographical mobility - Moved from different county within same state (%)
Geographical mobility - Moved from different state (%)
Geographical mobility - Moved from abroad (%)
Place of birth - Born in state of residence (%)
Place of birth - Born in other state (%)
Place of birth - Native, outside of US (%)
Place of birth - Foreign born (%)
Housing units in structures - 1, detached (%)
Housing units in structures - 1, attached (%)
Housing units in structures - 2 (%)
Housing units in structures - 3 or 4 (%)
Housing units in structures - 5 to 9 (%)
Housing units in structures - 10 to 19 (%)
Housing units in structures - 20 to 49 (%)
Housing units in structures - 50 or more (%)
Housing units in structures - Mobile home (%)
Housing units in structures - Boat, RV, van, etc. (%)
House/condo owner moved in on average (years ago)
Renter moved in on average (years ago)
Year householder moved into unit - Moved in 1999 to March 2000 (%)
Year householder moved into unit - Moved in 1995 to 1998 (%)
Year householder moved into unit - Moved in 1990 to 1994 (%)
Year householder moved into unit - Moved in 1980 to 1989 (%)
Year householder moved into unit - Moved in 1970 to 1979 (%)
Year householder moved into unit - Moved in 1969 or earlier (%)
Means of transportation to work - Drove car alone (%)
Means of transportation to work - Carpooled (%)
Means of transportation to work - Public transportation (%)
Means of transportation to work - Bus or trolley bus (%)
Means of transportation to work - Streetcar or trolley car (%)
Means of transportation to work - Subway or elevated (%)
Means of transportation to work - Railroad (%)
Means of transportation to work - Ferryboat (%)
Means of transportation to work - Taxicab (%)
Means of transportation to work - Motorcycle (%)
Means of transportation to work - Bicycle (%)
Means of transportation to work - Walked (%)
Means of transportation to work - Other means (%)
Working at home (%)
Industry diversity
Most Common Industries - Agriculture, forestry, fishing and hunting, and mining (%)
Most Common Industries - Agriculture, forestry, fishing and hunting (%)
Most Common Industries - Mining, quarrying, and oil and gas extraction (%)
Most Common Industries - Construction (%)
Most Common Industries - Manufacturing (%)
Most Common Industries - Wholesale trade (%)
Most Common Industries - Retail trade (%)
Most Common Industries - Transportation and warehousing, and utilities (%)
Most Common Industries - Transportation and warehousing (%)
Most Common Industries - Utilities (%)
Most Common Industries - Information (%)
Most Common Industries - Finance and insurance, and real estate and rental and leasing (%)
Most Common Industries - Finance and insurance (%)
Most Common Industries - Real estate and rental and leasing (%)
Most Common Industries - Professional, scientific, and management, and administrative and waste management services (%)
Most Common Industries - Professional, scientific, and technical services (%)
Most Common Industries - Management of companies and enterprises (%)
Most Common Industries - Administrative and support and waste management services (%)
Most Common Industries - Educational services, and health care and social assistance (%)
Most Common Industries - Educational services (%)
Most Common Industries - Health care and social assistance (%)
Most Common Industries - Arts, entertainment, and recreation, and accommodation and food services (%)
Most Common Industries - Arts, entertainment, and recreation (%)
Most Common Industries - Accommodation and food services (%)
Most Common Industries - Other services, except public administration (%)
Most Common Industries - Public administration (%)
Occupation diversity
Most Common Occupations - Management, business, science, and arts occupations (%)
Most Common Occupations - Management, business, and financial occupations (%)
Most Common Occupations - Management occupations (%)
Most Common Occupations - Business and financial operations occupations (%)
Most Common Occupations - Computer, engineering, and science occupations (%)
Most Common Occupations - Computer and mathematical occupations (%)
Most Common Occupations - Architecture and engineering occupations (%)
Most Common Occupations - Life, physical, and social science occupations (%)
Most Common Occupations - Education, legal, community service, arts, and media occupations (%)
Most Common Occupations - Community and social service occupations (%)
Most Common Occupations - Legal occupations (%)
Most Common Occupations - Education, training, and library occupations (%)
Most Common Occupations - Arts, design, entertainment, sports, and media occupations (%)
Most Common Occupations - Healthcare practitioners and technical occupations (%)
Most Common Occupations - Health diagnosing and treating practitioners and other technical occupations (%)
Most Common Occupations - Health technologists and technicians (%)
Most Common Occupations - Service occupations (%)
Most Common Occupations - Healthcare support occupations (%)
Most Common Occupations - Protective service occupations (%)
Most Common Occupations - Fire fighting and prevention, and other protective service workers including supervisors (%)
Most Common Occupations - Law enforcement workers including supervisors (%)
Most Common Occupations - Food preparation and serving related occupations (%)
Most Common Occupations - Building and grounds cleaning and maintenance occupations (%)
Most Common Occupations - Personal care and service occupations (%)
Most Common Occupations - Sales and office occupations (%)
Most Common Occupations - Sales and related occupations (%)
Most Common Occupations - Office and administrative support occupations (%)
Most Common Occupations - Natural resources, construction, and maintenance occupations (%)
Most Common Occupations - Farming, fishing, and forestry occupations (%)
Most Common Occupations - Construction and extraction occupations (%)
Most Common Occupations - Installation, maintenance, and repair occupations (%)
Most Common Occupations - Production, transportation, and material moving occupations (%)
Most Common Occupations - Production occupations (%)
Most Common Occupations - Transportation occupations (%)
Most Common Occupations - Material moving occupations (%)
People in Group quarters - Institutionalized population (%)
People in Group quarters - Correctional institutions (%)
People in Group quarters - Federal prisons and detention centers (%)
People in Group quarters - Halfway houses (%)
People in Group quarters - Local jails and other confinement facilities (including police lockups) (%)
People in Group quarters - Military disciplinary barracks (%)
People in Group quarters - State prisons (%)
People in Group quarters - Other types of correctional institutions (%)
People in Group quarters - Nursing homes (%)
People in Group quarters - Hospitals/wards, hospices, and schools for the handicapped (%)
People in Group quarters - Hospitals/wards and hospices for chronically ill (%)
People in Group quarters - Hospices or homes for chronically ill (%)
People in Group quarters - Military hospitals or wards for chronically ill (%)
People in Group quarters - Other hospitals or wards for chronically ill (%)
People in Group quarters - Hospitals or wards for drug/alcohol abuse (%)
People in Group quarters - Mental (Psychiatric) hospitals or wards (%)
People in Group quarters - Schools, hospitals, or wards for the mentally retarded (%)
People in Group quarters - Schools, hospitals, or wards for the physically handicapped (%)
People in Group quarters - Institutions for the deaf (%)
People in Group quarters - Institutions for the blind (%)
People in Group quarters - Orthopedic wards and institutions for the physically handicapped (%)
People in Group quarters - Wards in general hospitals for patients who have no usual home elsewhere (%)
People in Group quarters - Wards in military hospitals for patients who have no usual home elsewhere (%)
People in Group quarters - Juvenile institutions (%)
People in Group quarters - Long-term care (%)
People in Group quarters - Homes for abused, dependent, and neglected children (%)
People in Group quarters - Residential treatment centers for emotionally disturbed children (%)
People in Group quarters - Training schools for juvenile delinquents (%)
People in Group quarters - Short-term care, detention or diagnostic centers for delinquent children (%)
People in Group quarters - Type of juvenile institution unknown (%)
People in Group quarters - Noninstitutionalized population (%)
People in Group quarters - College dormitories (includes college quarters off campus) (%)
People in Group quarters - Military quarters (%)
People in Group quarters - On base (%)
People in Group quarters - Barracks, unaccompanied personnel housing (UPH), (Enlisted/Officer), ;and similar group living quarters for military personnel (%)
People in Group quarters - Transient quarters for temporary residents (%)
People in Group quarters - Military ships (%)
People in Group quarters - Group homes (%)
People in Group quarters - Homes or halfway houses for drug/alcohol abuse (%)
People in Group quarters - Homes for the mentally ill (%)
People in Group quarters - Homes for the mentally retarded (%)
People in Group quarters - Homes for the physically handicapped (%)
People in Group quarters - Other group homes (%)
People in Group quarters - Religious group quarters (%)
People in Group quarters - Dormitories (%)
People in Group quarters - Agriculture workers' dormitories on farms (%)
People in Group quarters - Job Corps and vocational training facilities (%)
People in Group quarters - Other workers' dormitories (%)
People in Group quarters - Crews of maritime vessels (%)
People in Group quarters - Other nonhousehold living situations (%)
People in Group quarters - Other noninstitutional group quarters (%)
Residents speaking English at home (%)
Residents speaking English at home - Born in the United States (%)
Residents speaking English at home - Native, born elsewhere (%)
Residents speaking English at home - Foreign born (%)
Residents speaking Spanish at home (%)
Residents speaking Spanish at home - Born in the United States (%)
Residents speaking Spanish at home - Native, born elsewhere (%)
Residents speaking Spanish at home - Foreign born (%)
Residents speaking other language at home (%)
Residents speaking other language at home - Born in the United States (%)
Residents speaking other language at home - Native, born elsewhere (%)
Residents speaking other language at home - Foreign born (%)
Class of Workers - Employee of private company (%)
Class of Workers - Self-employed in own incorporated business (%)
Class of Workers - Private not-for-profit wage and salary workers (%)
Class of Workers - Local government workers (%)
Class of Workers - State government workers (%)
Class of Workers - Federal government workers (%)
Class of Workers - Self-employed workers in own not incorporated business and Unpaid family workers (%)
House heating fuel used in houses and condos - Utility gas (%)
House heating fuel used in houses and condos - Bottled, tank, or LP gas (%)
House heating fuel used in houses and condos - Electricity (%)
House heating fuel used in houses and condos - Fuel oil, kerosene, etc. (%)
House heating fuel used in houses and condos - Coal or coke (%)
House heating fuel used in houses and condos - Wood (%)
House heating fuel used in houses and condos - Solar energy (%)
House heating fuel used in houses and condos - Other fuel (%)
House heating fuel used in houses and condos - No fuel used (%)
House heating fuel used in apartments - Utility gas (%)
House heating fuel used in apartments - Bottled, tank, or LP gas (%)
House heating fuel used in apartments - Electricity (%)
House heating fuel used in apartments - Fuel oil, kerosene, etc. (%)
House heating fuel used in apartments - Coal or coke (%)
House heating fuel used in apartments - Wood (%)
House heating fuel used in apartments - Solar energy (%)
House heating fuel used in apartments - Other fuel (%)
House heating fuel used in apartments - No fuel used (%)
Armed forces status - In Armed Forces (%)
Armed forces status - Civilian (%)
Armed forces status - Civilian - Veteran (%)
Armed forces status - Civilian - Nonveteran (%)
Fatal accidents locations in years 2005-2021
Fatal accidents locations in 2005
Fatal accidents locations in 2006
Fatal accidents locations in 2007
Fatal accidents locations in 2008
Fatal accidents locations in 2009
Fatal accidents locations in 2010
Fatal accidents locations in 2011
Fatal accidents locations in 2012
Fatal accidents locations in 2013
Fatal accidents locations in 2014
Fatal accidents locations in 2015
Fatal accidents locations in 2016
Fatal accidents locations in 2017
Fatal accidents locations in 2018
Fatal accidents locations in 2019
Fatal accidents locations in 2020
Fatal accidents locations in 2021
Alcohol use - People drinking some alcohol every month (%)
Alcohol use - People not drinking at all (%)
Alcohol use - Average days/month drinking alcohol
Alcohol use - Average drinks/week
Alcohol use - Average days/year people drink much
Audiometry - Average condition of hearing (%)
Audiometry - People that can hear a whisper from across a quiet room (%)
Audiometry - People that can hear normal voice from across a quiet room (%)
Audiometry - Ears ringing, roaring, buzzing (%)
Audiometry - Had a job exposure to loud noise (%)
Audiometry - Had off-work exposure to loud noise (%)
Blood Pressure & Cholesterol - Has high blood pressure (%)
Blood Pressure & Cholesterol - Checking blood pressure at home (%)
Blood Pressure & Cholesterol - Frequently checking blood cholesterol (%)
Blood Pressure & Cholesterol - Has high cholesterol level (%)
Consumer Behavior - Money monthly spent on food at supermarket/grocery store
Consumer Behavior - Money monthly spent on food at other stores
Consumer Behavior - Money monthly spent on eating out
Consumer Behavior - Money monthly spent on carryout/delivered foods
Consumer Behavior - Income spent on food at supermarket/grocery store (%)
Consumer Behavior - Income spent on food at other stores (%)
Consumer Behavior - Income spent on eating out (%)
Consumer Behavior - Income spent on carryout/delivered foods (%)
Current Health Status - General health condition (%)
Current Health Status - Blood donors (%)
Current Health Status - Has blood ever tested for HIV virus (%)
Current Health Status - Left-handed people (%)
Dermatology - People using sunscreen (%)
Diabetes - Diabetics (%)
Diabetes - Had a blood test for high blood sugar (%)
Diabetes - People taking insulin (%)
Diet Behavior & Nutrition - Diet health (%)
Diet Behavior & Nutrition - Milk product consumption (# of products/month)
Diet Behavior & Nutrition - Meals not home prepared (#/week)
Diet Behavior & Nutrition - Meals from fast food or pizza place (#/week)
Diet Behavior & Nutrition - Ready-to-eat foods (#/month)
Diet Behavior & Nutrition - Frozen meals/pizza (#/month)
Drug Use - People that ever used marijuana or hashish (%)
Drug Use - Ever used hard drugs (%)
Drug Use - Ever used any form of cocaine (%)
Drug Use - Ever used heroin (%)
Drug Use - Ever used methamphetamine (%)
Health Insurance - People covered by health insurance (%)
Kidney Conditions-Urology - Avg. # of times urinating at night
Medical Conditions - People with asthma (%)
Medical Conditions - People with anemia (%)
Medical Conditions - People with psoriasis (%)
Medical Conditions - People with overweight (%)
Medical Conditions - Elderly people having difficulties in thinking or remembering (%)
Medical Conditions - People who ever received blood transfusion (%)
Medical Conditions - People having trouble seeing even with glass/contacts (%)
Medical Conditions - People with arthritis (%)
Medical Conditions - People with gout (%)
Medical Conditions - People with congestive heart failure (%)
Medical Conditions - People with coronary heart disease (%)
Medical Conditions - People with angina pectoris (%)
Medical Conditions - People who ever had heart attack (%)
Medical Conditions - People who ever had stroke (%)
Medical Conditions - People with emphysema (%)
Medical Conditions - People with thyroid problem (%)
Medical Conditions - People with chronic bronchitis (%)
Medical Conditions - People with any liver condition (%)
Medical Conditions - People who ever had cancer or malignancy (%)
Mental Health - People who have little interest in doing things (%)
Mental Health - People feeling down, depressed, or hopeless (%)
Mental Health - People who have trouble sleeping or sleeping too much (%)
Mental Health - People feeling tired or having little energy (%)
Mental Health - People with poor appetite or overeating (%)
Mental Health - People feeling bad about themself (%)
Mental Health - People who have trouble concentrating on things (%)
Mental Health - People moving or speaking slowly or too fast (%)
Mental Health - People having thoughts they would be better off dead (%)
Oral Health - Average years since last visit a dentist
Oral Health - People embarrassed because of mouth (%)
Oral Health - People with gum disease (%)
Oral Health - General health of teeth and gums (%)
Oral Health - Average days a week using dental floss/device
Oral Health - Average days a week using mouthwash for dental problem
Oral Health - Average number of teeth
Pesticide Use - Households using pesticides to control insects (%)
Pesticide Use - Households using pesticides to kill weeds (%)
Physical Activity - People doing vigorous-intensity work activities (%)
Physical Activity - People doing moderate-intensity work activities (%)
Physical Activity - People walking or bicycling (%)
Physical Activity - People doing vigorous-intensity recreational activities (%)
Physical Activity - People doing moderate-intensity recreational activities (%)
Physical Activity - Average hours a day doing sedentary activities
Physical Activity - Average hours a day watching TV or videos
Physical Activity - Average hours a day using computer
Physical Functioning - People having limitations keeping them from working (%)
Physical Functioning - People limited in amount of work they can do (%)
Physical Functioning - People that need special equipment to walk (%)
Physical Functioning - People experiencing confusion/memory problems (%)
Physical Functioning - People requiring special healthcare equipment (%)
Prescription Medications - Average number of prescription medicines taking
Preventive Aspirin Use - Adults 40+ taking low-dose aspirin (%)
Reproductive Health - Vaginal deliveries (%)
Reproductive Health - Cesarean deliveries (%)
Reproductive Health - Deliveries resulted in a live birth (%)
Reproductive Health - Pregnancies resulted in a delivery (%)
Reproductive Health - Women breastfeeding newborns (%)
Reproductive Health - Women that had a hysterectomy (%)
Reproductive Health - Women that had both ovaries removed (%)
Reproductive Health - Women that have ever taken birth control pills (%)
Reproductive Health - Women taking birth control pills (%)
Reproductive Health - Women that have ever used Depo-Provera or injectables (%)
Reproductive Health - Women that have ever used female hormones (%)
Sexual Behavior - People 18+ that ever had sex (vaginal, anal, or oral) (%)
Sexual Behavior - Males 18+ that ever had vaginal sex with a woman (%)
Sexual Behavior - Males 18+ that ever performed oral sex on a woman (%)
Sexual Behavior - Males 18+ that ever had anal sex with a woman (%)
Sexual Behavior - Males 18+ that ever had any sex with a man (%)
Sexual Behavior - Females 18+ that ever had vaginal sex with a man (%)
Sexual Behavior - Females 18+ that ever performed oral sex on a man (%)
Sexual Behavior - Females 18+ that ever had anal sex with a man (%)
Sexual Behavior - Females 18+ that ever had any kind of sex with a woman (%)
Sexual Behavior - Average age people first had sex
Sexual Behavior - Average number of female sex partners in lifetime (males 18+)
Sexual Behavior - Average number of female vaginal sex partners in lifetime (males 18+)
Sexual Behavior - Average age people first performed oral sex on a woman (18+)
Sexual Behavior - Average number of woman performed oral sex on in lifetime (18+)
Sexual Behavior - Average number of male sex partners in lifetime (males 18+)
Sexual Behavior - Average number of male anal sex partners in lifetime (males 18+)
Sexual Behavior - Average age people first performed oral sex on a man (18+)
Sexual Behavior - Average number of male oral sex partners in lifetime (18+)
Sexual Behavior - People using protection when performing oral sex (%)
Sexual Behavior - Average number of times people have vaginal or anal sex a year
Sexual Behavior - People having sex without condom (%)
Sexual Behavior - Average number of male sex partners in lifetime (females 18+)
Sexual Behavior - Average number of male vaginal sex partners in lifetime (females 18+)
Sexual Behavior - Average number of female sex partners in lifetime (females 18+)
Sexual Behavior - Circumcised males 18+ (%)
Sleep Disorders - Average hours sleeping at night
Sleep Disorders - People that has trouble sleeping (%)
Smoking-Cigarette Use - People smoking cigarettes (%)
Taste & Smell - People 40+ having problems with smell (%)
Taste & Smell - People 40+ having problems with taste (%)
Taste & Smell - People 40+ that ever had wisdom teeth removed (%)
Taste & Smell - People 40+ that ever had tonsils teeth removed (%)
Taste & Smell - People 40+ that ever had a loss of consciousness because of a head injury (%)
Taste & Smell - People 40+ that ever had a broken nose or other serious injury to face or skull (%)
Taste & Smell - People 40+ that ever had two or more sinus infections (%)
Weight - Average height (inches)
Weight - Average weight (pounds)
Weight - Average BMI
Weight - People that are obese (%)
Weight - People that ever were obese (%)
Weight - People trying to lose weight (%)
100%
urban population.
Estimated median house/condo value in 2022: $73,535
48224:
$73,535Michigan:
$224,400
Median resident age: This zip code:
32.6 yearsMichigan median age:
40.3 years
Average household size: This zip code:
2.8 peopleMichigan:
2.4 people
Averages for the 2020 tax year for zip code 48224, filed in 2021:
Average Adjusted Gross Income (AGI) in 2020: $31,941 (Individual Income Tax Returns) Here:
$31,941State:
$68,945
Salary/wage: $28,888 (reported on 78.1% of returns )Here:
$28,888State:
$57,142
(% of AGI for various income ranges: 926.6% for AGIs below $25k , 2960.8% for AGIs $25k-50k , 7093.7% for AGIs $50k-75k , 11557.2% for AGIs $75k-100k , 17922.5% for AGIs $100k-200k ) Taxable interest for individuals: $555 (reported on 8.6% of returns )This zip code:
$555Michigan:
$1,630
(% of AGI for various income ranges: 1.8% for AGIs below $25k , 2.9% for AGIs $25k-50k , 19.1% for AGIs $50k-75k , 48.6% for AGIs $75k-100k , 51.1% for AGIs $100k-200k ) Ordinary dividends: $1,719 (reported on 3.4% of returns )(% of AGI for various income ranges: 1.7% for AGIs below $25k , 4.8% for AGIs $25k-50k , 14.3% for AGIs $50k-75k , 17.2% for AGIs $75k-100k , 143.9% for AGIs $100k-200k ) Net capital gain/loss in AGI: +$4,052 (reported on 2.8% of returns )Here:
+$4,052State:
+$20,064
(% of AGI for various income ranges: 0.8% for AGIs below $25k , 4.2% for AGIs $25k-50k , 21.8% for AGIs $50k-75k , 60.8% for AGIs $75k-100k , 397.9% for AGIs $100k-200k ) Taxable individual retirement arrangement distribution: $13,911 (reported on 2.8% of returns )48224:
$13,911Michigan:
$19,803
(% of AGI for various income ranges: 8.8% for AGIs below $25k , 24.0% for AGIs $25k-50k , 143.0% for AGIs $50k-75k , 293.3% for AGIs $75k-100k , 732.5% for AGIs $100k-200k ) Total itemized deductions: $23,204 (reported on 3.2% of returns )Here:
$23,204State:
$34,117
(% of AGI for various income ranges: 12.8% for AGIs below $25k , 62.1% for AGIs $25k-50k , 291.4% for AGIs $50k-75k , 483.6% for AGIs $75k-100k , 1324.3% for AGIs $100k-200k ) Charity contributions: $9,522 (reported on 2.9% of returns )(% of AGI for various income ranges: 2.4% for AGIs below $25k , 20.5% for AGIs $25k-50k , 107.2% for AGIs $50k-75k , 185.8% for AGIs $75k-100k , 576.1% for AGIs $100k-200k ) Taxes paid: $6,112 (reported on 3.2% of returns )(% of AGI for various income ranges: 2.1% for AGIs below $25k , 11.1% for AGIs $25k-50k , 76.4% for AGIs $50k-75k , 142.8% for AGIs $75k-100k , 440.7% for AGIs $100k-200k ) Earned income credit: $2,964 (reported on 41.4% of returns )(% of AGI for various income ranges: 197.7% for AGIs below $25k , 150.8% for AGIs $25k-50k ) Percentage of individuals using paid preparers for their 2020 taxes: 91.4%(% for various income ranges: 92.7% for AGIs below $25k , 92.3% for AGIs $25k-50k , 85.5% for AGIs $50k-75k , 85.7% for AGIs $75k-100k , 86.3% for AGIs $100k-200k , 100.0% for AGIs over 200k )
Averages for the 2012 tax year for zip code 48224, filed in 2013:
Average Adjusted Gross Income (AGI) in 2012: $26,578 (Individual Income Tax Returns) Here:
$26,578State:
$55,609
Salary/wage: $25,203 (reported on 79.2% of returns )Here:
$25,203State:
$46,782
(% of AGI for various income ranges: 66.2% for AGIs below $25k , 81.4% for AGIs $25k-50k , 79.7% for AGIs $50k-75k , 78.7% for AGIs $75k-100k , 76.1% for AGIs $100k-200k , 57.7% for AGIs over 200k ) Taxable interest for individuals: $1,500 (reported on 10.4% of returns )This zip code:
$1,500Michigan:
$1,491
(% of AGI for various income ranges: 1.1% for AGIs below $25k , 0.4% for AGIs $25k-50k , 0.2% for AGIs $50k-75k , 0.1% for AGIs $75k-100k , 0.6% for AGIs $100k-200k ) Ordinary dividends: $1,692 (reported on 3.9% of returns )(% of AGI for various income ranges: 0.3% for AGIs below $25k , 0.1% for AGIs $25k-50k , 0.2% for AGIs $50k-75k , 0.2% for AGIs $75k-100k , 0.5% for AGIs $100k-200k ) Net capital gain/loss in AGI: +$314 (reported on 2.1% of returns )(% of AGI for various income ranges: 0.3% for AGIs $100k-200k ) Profit/loss from business: +$7,083 (reported on 25.1% of returns )Here:
+$7,083State:
+$11,523
(% of AGI for various income ranges: 21.3% for AGIs below $25k , 0.3% for AGIs $50k-75k , 0.7% for AGIs $75k-100k , 0.8% for AGIs $100k-200k ) Taxable individual retirement arrangement distribution: $11,503 (reported on 3.5% of returns )48224:
$11,503Michigan:
$15,298
(% of AGI for various income ranges: 0.6% for AGIs below $25k , 1.4% for AGIs $25k-50k , 1.8% for AGIs $50k-75k , 2.5% for AGIs $75k-100k , 3.1% for AGIs $100k-200k ) Total itemized deductions: $15,595 (26% of AGI, reported on 17.4% of returns )Here:
$15,595State:
$21,628
Here:
26.0% of AGIState:
18.4% of AGI
(% of AGI for various income ranges: 3.5% for AGIs below $25k , 11.0% for AGIs $25k-50k , 14.5% for AGIs $50k-75k , 15.2% for AGIs $75k-100k , 14.9% for AGIs $100k-200k , 11.7% for AGIs over 200k ) Charity contributions: $4,426 (reported on 14.8% of returns )(% of AGI for various income ranges: 0.6% for AGIs below $25k , 2.6% for AGIs $25k-50k , 3.5% for AGIs $50k-75k , 3.9% for AGIs $75k-100k , 4.2% for AGIs $100k-200k ) Taxes paid: $5,776 (reported on 17.3% of returns )(% of AGI for various income ranges: 0.8% for AGIs below $25k , 3.5% for AGIs $25k-50k , 5.5% for AGIs $50k-75k , 6.2% for AGIs $75k-100k , 7.4% for AGIs $100k-200k ) Earned income credit: $3,108 (reported on 48.3% of returns )(% of AGI for various income ranges: 16.8% for AGIs below $25k , 1.8% for AGIs $25k-50k ) Percentage of individuals using paid preparers for their 2012 taxes: 53.9%(% for various income ranges: 54.0% for AGIs below $25k , 51.0% for AGIs $25k-50k , 57.6% for AGIs $50k-75k , 54.5% for AGIs $75k-100k , 62.8% for AGIs $100k-200k )
Averages for the 2004 tax year for zip code 48224, filed in 2005:
Average Adjusted Gross Income (AGI) in 2004: $32,911 (Individual Income Tax Returns) Here:
$32,911State:
$48,204
Salary/wage: $32,503 (reported on 89.7% of returns )Here:
$32,503State:
$42,791
(% of AGI for various income ranges: 78.2% for AGIs below $10k , 81.4% for AGIs $10k-25k , 90.6% for AGIs $25k-50k , 91.6% for AGIs $50k-75k , 90.5% for AGIs $75k-100k , 87.1% for AGIs over 100k ) Taxable interest for individuals: $819 (reported on 20.1% of returns )This zip code:
$819Michigan:
$1,725
(% of AGI for various income ranges: 1.2% for AGIs below $10k , 0.7% for AGIs $10k-25k , 0.3% for AGIs $25k-50k , 0.3% for AGIs $50k-75k , 0.6% for AGIs $75k-100k , 0.8% for AGIs over 100k ) Taxable dividends: $1,183 (reported on 7.4% of returns )(% of AGI for various income ranges: 0.9% for AGIs below $10k , 0.3% for AGIs $10k-25k , 0.2% for AGIs $25k-50k , 0.2% for AGIs $50k-75k , 0.4% for AGIs $75k-100k , 0.3% for AGIs over 100k ) Net capital gain/loss: +$2,067 (reported on 4.3% of returns )Here:
+$2,067State:
+$8,532
(% of AGI for various income ranges: -0.2% for AGIs below $10k , 0.1% for AGIs $10k-25k , 0.1% for AGIs $25k-50k , 0.1% for AGIs $50k-75k , 0.5% for AGIs $75k-100k , 1.2% for AGIs over 100k ) Profit/loss from business: +$3,454 (reported on 13.1% of returns )Here:
+$3,454State:
+$9,547
(% of AGI for various income ranges: 13.0% for AGIs below $10k , 5.4% for AGIs $10k-25k , 0.2% for AGIs $25k-50k , -0.0% for AGIs $50k-75k , 0.4% for AGIs $75k-100k , 0.4% for AGIs over 100k ) IRA payment deduction: $1,970 (reported on 0.9% of returns )48224:
$1,970Michigan:
$2,875
(% of AGI for various income ranges: 0.1% for AGIs $10k-25k , 0.1% for AGIs $25k-50k , 0.0% for AGIs $50k-75k , 0.0% for AGIs $75k-100k ) Total itemized deductions: $15,257 (28% of AGI, reported on 38.6% of returns )Here:
$15,257State:
$18,509
Here:
27.9% of AGIState:
20.7% of AGI
(% of AGI for various income ranges: 10.4% for AGIs below $10k , 9.6% for AGIs $10k-25k , 19.5% for AGIs $25k-50k , 21.1% for AGIs $50k-75k , 20.1% for AGIs $75k-100k , 17.3% for AGIs over 100k ) Charity contributions deductions: $3,603 (6% of AGI, reported on 34.5% of returns )Here:
6.4% of AGIState:
3.6% of AGI
(% of AGI for various income ranges: 1.0% for AGIs below $10k , 1.6% for AGIs $10k-25k , 3.9% for AGIs $25k-50k , 4.8% for AGIs $50k-75k , 4.4% for AGIs $75k-100k , 4.2% for AGIs over 100k ) Total tax: $3,986 (reported on 61.5% of returns )(% of AGI for various income ranges: 2.9% for AGIs below $10k , 2.6% for AGIs $10k-25k , 5.0% for AGIs $25k-50k , 8.7% for AGIs $50k-75k , 10.2% for AGIs $75k-100k , 14.2% for AGIs over 100k ) Earned income credit: $2,121 (reported on 35.9% of returns )Percentage of individuals using paid preparers for their 2004 taxes: 64.4%(% for various income ranges: 62.5% for AGIs below $10k , 69.5% for AGIs $10k-25k , 62.6% for AGIs $25k-50k , 61.3% for AGIs $50k-75k , 62.5% for AGIs $75k-100k , 63.7% for AGIs over 100k )
Estimated median household income in 2022: This zip code:
$40,102Michigan:
$66,986
Nearest zip codes: 48225 ,
48230 ,
48215 ,
48205 ,
48236 ,
48213 .
Detroit Zip Code Map
Percentage of family households: This zip code:
46.3%Michigan:
43.3%
Percentage of households with unmarried partners: This zip code:
9.4%Michigan:
45.7%
Likely homosexual households (counted as self-reported same-sex unmarried-partner households)
Lesbian couples: 0.0% of all households Gay men: 0.1% of all households
Household received Food Stamps/SNAP in the past 12 months: 5,787Household did not receive Food Stamps/SNAP in the past 12 months: 7,934
Women who had a birth in the past 12 months: 732 (180 now married , 530 unmarried) Women who did not have a birth in the past 12 months: 9,321 (1,861 now married , 7,502 unmarried)
Housing units in zip code 48224 with a mortgage: 2,827 (225
second mortgage , 10
home equity loan , 188
both second mortgage and home equity loan )
Houses without a mortgage: 96
Median monthly owner costs for units with a mortgage: $1,136
Median monthly owner costs for units without a mortgage: $532
Residents with income below the poverty level in 2022:
This zip code:
33.9%Whole state:
13.4%
Residents with income below 50% of the poverty level in 2022:
This zip code:
18.6%Whole state:
6.9%
Median number of rooms in houses and condos: Median number of rooms in apartments: Notable locations in this zip code not listed on our city pages
Click to draw/clear zip code borders Notable locations in zip code 48224: (A) , City of Detroit Fire Department Engine 58 Squad 6 (B) , Jefferson Library (C) . Display/hide their locations on the map
Churches in zip code 48224 include: (A) , Rhema Church (B) , Jamison Temple Missionary Baptist Church (C) , Metro Central Church of Christ (D) , Greater Future Missionary Baptist Church (E) , Greater Old Landmark Missionary Baptist Church (F) , Blessed Community Baptist Church (G) , Calvin East United Presbyterian Church (H) . Display/hide their locations on the map
Parks in zip code 48224 include: (1) , Corrigan Playground (2) , Messmer Park (3) , Sasser Playground (4) . Display/hide their locations on the map
Tourist attractions (not listed on the city page) :
Year house built (houses)
0 2020 or later60 2010 to 2019310 2000 to 2009139 1990 to 1999445 1980 to 1989751 1970 to 19791,125 1960 to 19693,499 1950 to 19594,873 1940 to 19495,338 1939 or earlier
Zip code 48224 household income distribution in 2022 1,677 Less than $10,000961 $10,000 to $14,999922 $15,000 to $19,999901 $20,000 to $24,999573 $25,000 to $29,999713 $30,000 to $34,999939 $35,000 to $39,999814 $40,000 to $44,999364 $45,000 to $49,9991,139 $50,000 to $59,9991,317 $60,000 to $74,9991,161 $75,000 to $99,999920 $100,000 to $124,999418 $125,000 to $149,999479 $150,000 to $199,999279 $200,000 or moreEstimate of home value of owner-occupied houses/condos in 2022 in zip code 48224 253 Less than $10,000208 $10,000 to $14,999214 $15,000 to $19,999183 $20,000 to $24,999264 $25,000 to $29,999385 $30,000 to $34,999327 $35,000 to $39,999823 $40,000 to $49,999376 $50,000 to $59,999564 $60,000 to $69,999359 $70,000 to $79,999361 $80,000 to $89,999189 $90,000 to $99,999597 $100,000 to $124,999317 $125,000 to $149,999527 $150,000 to $174,999294 $175,000 to $199,999414 $200,000 to $249,99968 $250,000 to $299,999163 $300,000 to $399,99932 $400,000 to $499,9998 $500,000 to $749,9997 $750,000 to $999,99916 $1,000,000 to $1,499,999Rent paid by renters in 2022 in zip code 48224 28 $100 to $14916 $150 to $19986 $200 to $24918 $250 to $29920 $300 to $3499 $350 to $399160 $400 to $44935 $450 to $499117 $500 to $549166 $550 to $599308 $600 to $649723 $650 to $699607 $700 to $749293 $750 to $7991,454 $800 to $899590 $900 to $999349 $1,000 to $1,24936 $1,250 to $1,49918 $1,500 to $1,999408 No cash rent
Median gross rent in 2022: $1,160.
Estimated median house (or condo) value in 2022 for: White Non-Hispanic householders: $67,120Black or African American householders: $74,743American Indian or Alaska Native householders: $80,600Asian householders: $99,193Some other race householders: $71,025Two or more races householders: $82,645Hispanic or Latino householders: $63,959Estimated median house or condo value in 2022: $73,535
48224:
$73,535Michigan:
$224,400
Lower value quartile - upper value quartile: $42,017 - $142,229
Mean price in 2022: Detached houses: $100,908Here:
$100,908State:
$280,038
Townhouses or other attached units: $108,360Here:
$108,360State:
$239,520
In 2-unit structures: $114,521Here:
$114,521State:
$219,481
Mobile homes: $532,561Here:
$532,561State:
$72,868
Housing units in structures:
One, detached: 14,203One, attached: 1,166Two: 5263 or 4: 475 to 9: 15310 to 19: 36820 to 49: 26250 or more: 68Mobile homes: 39Unemployment : 13.3%
Means of transportation to work in zip code 48224 68.0% 9,261 Drove a car alone9.5% 1,297 Carpooled5.6% 757 Bus or trolley bus0.9% 123 Taxi0.2% 22 Bicycle1.5% 199 Walked1.5% 199 Other means11.1% 1,509 Worked at homeTravel time to work (commute) in zip code 48224 116 Less than 5 minutes809 5 to 9 minutes1,406 10 to 14 minutes1,592 15 to 19 minutes2,423 20 to 24 minutes1,013 25 to 29 minutes2,202 30 to 34 minutes323 35 to 39 minutes208 40 to 44 minutes1,033 45 to 59 minutes592 60 to 89 minutes281 90 or more minutes
Neighborhoods in zip code 48224: Percentage of zip code residents living and working in this county: 75.4%
Household type by relationship:
Households: 38,102
Male householders: 5,508 (2,521 living alone ), Female householders: 7,945 (1,865 living alone )3,145 spouses (3,019 opposite-sex spouses ), 918 unmarried partners , (889 opposite-sex unmarried partners ), 13,639 children (13,113 natural , 166 adopted , 366 stepchildren ), 2,751 grandchildren , 814 brothers or sisters , 648 parents , 20 foster children , 986 other relatives , 1,175 non-relatives In group quarters: 402 (-1 institutionalized population )
Size of family households: 3,070 2-persons , 2,160 3-persons , 1,579 4-persons , 548 5-persons , 351 6-persons , 511 7-or-more-persons
Size of nonfamily households: 4,379 1-person , 714 2-persons , 58 3-persons , 15 5-persons
2,377 married couples with children. single-parent households (843 men , 4,924 women ).
97.1% of residents of 48224 zip code speak English at home. of residents speak Spanish at home (94% very well, 6% well ).of residents speak other Indo-European language at home (67% very well, 12% well, 20% not well ).of residents speak Asian or Pacific Island language at home (76% very well, 24% well ).of residents speak other language at home (73% very well, 19% well, 8% not at all ).
Foreign born population: 268 (0.7%)
(42.4%
of them are naturalized citizens )
This zip code:
0.7%Whole state:
6.9%
12% Liberia 9% Venezuela 7% Cabo Verde 4% Honduras 4% Costa Rica 3% Singapore 3% France 2% African 1% American 1% German 0% English 0% Irish 0% Nigerian 0% Polish
Year of entry for the foreign-born population
125 2010 or later 11 2000 to 2009 50 1990 to 1999 222 Before 1990
There are
58 Medical Specialists in Zip Code 48224 .
Major facilities with environmental interests located in this zip code:
FINNEY HIGH SCHOOL (17200 SOUTHAMPTON in DETROIT, MI)
(Geographic Names Information System) (National Center for Education Statistics) - STATE ID-01236 Conditionally Exempt Small Quantity Generators, less than 100 kg/month of hazardous waste (Resource Conservation and Recovery Act (tracking hazardous waste)) Organizations: DETROIT PUBLIC SCHOOLS (CONTACT/OPERATOR)
, DETROIT CITY SCHOOL DISTRICT (SCHOOL DISTRICT)
DETROIT SCHOOL OF INDUSTRIAL ARTS (11406 MORANG DRIVE in DETROIT, MI)
(National Center for Education Statistics) - STATE ID-08337
CHANDLER PARK ACADEMY-HAVERHILL (4901 HAVERHILL STREET in DETROIT, MI)
(National Center for Education Statistics) - STATE ID-08454
FISHER MAGNET MIDDLE SCHOOL (10125 KING RICHARD STREET in DETROIT, MI)
(National Center for Education Statistics) - STATE ID-03676 Organizations: DETROIT CITY SCHOOL DISTRICT (SCHOOL DISTRICT)
BETHANY LUTHERAN CHURCH (11475 E OUTER DR in DETROIT, MI)
COMPLIANCE ACTIVITY (Tracking inspections of insecticide, fungicide, and rodenticide, and toxic substances) (Resource Conservation and Recovery Act (tracking hazardous waste))
AMOCO OIL CO (17111 HARPER in DETROIT, MI)
(Resource Conservation and Recovery Act (tracking hazardous waste)) Organizations: AMOCO OIL COMPANY (CONTACT/OWNER)
, B P PRODUCTS NORTH AMERICA (CONTACT/OWNER)
Alternative names: AMOCO OIL CO 9530
MI DEPT/TRANSPORTATION BRIDGE (I-75 UNDER GRAND RIVER AVE in DETROIT, MI)
(Resource Conservation and Recovery Act (tracking hazardous waste)) Organizations: MICH DEPT OF TRANSPORTATION (CONTACT/OPERATOR)
Alternative names: MIDOT BRIDGE I-75 UNDER GRAND RIVER AVE
CHILDERS PRINT AND GRAPHICS INC (15700 HARPER AVE in DETROIT, MI)
(Resource Conservation and Recovery Act (tracking hazardous waste)) Organizations: JOHN CHILDERS (CONTACT/OPERATOR)
AMOCO OIL CO 5614 MAZZARA PETER J (15935 MACK in DETROIT, MI)
(Resource Conservation and Recovery Act (tracking hazardous waste)) Organizations: AMOCO OIL COMPANY (CONTACT/OWNER)
DOMINICAN HIGH SCHOOL (9740 MCKINNEY AVE in DETROIT, MI)
(Resource Conservation and Recovery Act (tracking hazardous waste)) Organizations: DOMINICAN ADRIAN SRS (CONTACT/OWNER)
MI DEPT/TRANSPORTATION BRIDGE (I-94 WB OVER I-94 RAMP in DETROIT, MI)
(Resource Conservation and Recovery Act (tracking hazardous waste)) Organizations: MICH DEPT OF TRANSPORTATION (CONTACT/OPERATOR)
Alternative names: MIDOT BRIDGE I-94 OVER RAMP FROM M-10
BIG DUDE & FA CAR WASH (9935 WHITTIER AT BALFOUR in DETROIT, MI)
(Resource Conservation and Recovery Act (tracking hazardous waste)) Organizations: EVENLY EDWARD (CONTACT/OWNER)
Housing units lacking complete plumbing facilities: 11.0%
Housing units lacking complete kitchen facilities: 14.5%
86.3% Utility gas 11.7% Electricity 1.1% No fuel used 0.7% Bottled, tank, or LP gas
Population in 1990: 52,938. Population change in the 1990s: +2,499 (+4.7%).
Place of birth for U.S.-born residents:
This state: 32,197Northeast: 322Midwest: 1,371South: 3,303West: 396
57% of the 48224 zip code residents lived in the same house 5 years ago.
Out of people who lived in different houses, 86% lived in this county.
Out of people who lived in different counties, 50% lived in Michigan.
90% of the 48224 zip code residents lived in the same house 1 year ago.
Out of people who lived in different houses, 68% moved from this county.
Out of people who lived in different houses, 24% moved from different county within same state.
Out of people who lived in different houses, 5% moved from different state.
Private vs. public school enrollment:
Students in private schools in grades 1 to 8 (elementary and middle school): 367
Students in private schools in grades 9 to 12 (high school): 63
Students in private undergraduate colleges: 99
Occupation by median earnings in the past 12 months ($)
92,365 Legal occupations 85,244 Health diagnosing and treating practitioners and other technical occupations 75,067 Business and financial operations occupations 56,790 Law enforcement workers including supervisors 54,723 Architecture and engineering occupations 52,710 Community and social service occupations
Top industries in this zip code by the number of employees in 2005:
Accommodation and Food Services: Limited-Service Restaurants (100-249 employees: 1 establishment, 20-49 employees: 9 establishments, 10-19 employees: 4 establishments, 5-9 employees: 3 establishments, 1-4 employees: 6 establishments)Health Care and Social Assistance: Continuing Care Retirement Communities (250-499: 1)Health Care and Social Assistance: Child Day Care Services (20-49: 3, 10-19: 3, 5-9: 2, 1-4: 5)Health Care and Social Assistance: Nursing Care Facilities (100-249: 1)Accommodation and Food Services: Full-Service Restaurants (20-49: 1, 10-19: 6, 5-9: 1, 1-4: 10)Other Services (except Public Administration): Religious Organizations (20-49: 1, 10-19: 2, 5-9: 3, 1-4: 9)Administrative and Support and Waste Management and Remediation Services: Janitorial Services (50-99: 1, 5-9: 4, 1-4: 1)
People in group quarters in 2010:
200 people in nursing facilities/skilled-nursing facilities
58 people in group homes intended for adults
13 people in other noninstitutional facilities
People in group quarters in 2000:
305 people in nursing homes
101 people in other noninstitutional group quarters
25 people in homes for the mentally ill
14 people in homes for the mentally retarded
6 people in other group homes
Fatal accident statistics in 2014:
Fatal accident count: 6Vehicles involved in fatal accidents: 8Fatal accidents caused by drunken drivers: 1Fatalities: 6Persons involved in fatal accidents: 20Pedestrians involved in fatal accidents: 1
Fatal accident statistics in 2013:
Fatal accident count: 7Vehicles involved in fatal accidents: 10Fatal accidents caused by drunken drivers: 1Fatalities: 7Persons involved in fatal accidents: 13Pedestrians involved in fatal accidents: 3
Home Mortgage Disclosure Act Aggregated Statistics For Year 2009(Based on 18 full and 8 partial tracts) A) FHA, FSA/RHS & VA B) Conventional C) Refinancings D) Home Improvement Loans F) Non-occupant Loans on G) Loans On Manufactured Number Average Value Number Average Value Number Average Value Number Average Value Number Average Value Number Average Value
LOANS ORIGINATED 62 $63,158 28 $52,719 146 $83,191 30 $12,964 37 $49,889 0 $0 APPLICATIONS APPROVED, NOT ACCEPTED 20 $54,042 11 $85,168 49 $89,074 6 $9,645 15 $67,485 0 $0 APPLICATIONS DENIED 87 $72,905 84 $68,934 338 $75,398 158 $16,597 115 $57,442 5 $55,634 APPLICATIONS WITHDRAWN 43 $71,737 6 $68,665 76 $85,364 11 $14,421 5 $53,666 0 $0 FILES CLOSED FOR INCOMPLETENESS 1 $71,860 11 $123,943 34 $92,037 9 $38,468 14 $54,188 0 $0
Aggregated Statistics For Year 2008(Based on 18 full and 8 partial tracts) A) FHA, FSA/RHS & VA B) Conventional C) Refinancings D) Home Improvement Loans E) Loans on Dwellings For 5+ Families F) Non-occupant Loans on G) Loans On Manufactured Number Average Value Number Average Value Number Average Value Number Average Value Number Average Value Number Average Value Number Average Value
LOANS ORIGINATED 127 $75,559 250 $79,665 487 $82,455 108 $28,504 2 $101,645 324 $71,023 2 $54,000 APPLICATIONS APPROVED, NOT ACCEPTED 15 $65,105 51 $78,875 106 $83,653 33 $32,701 0 $0 59 $75,963 3 $56,000 APPLICATIONS DENIED 98 $90,799 511 $84,937 1,126 $85,573 355 $30,399 0 $0 556 $74,047 17 $57,352 APPLICATIONS WITHDRAWN 46 $78,144 62 $81,236 242 $91,817 7 $55,206 0 $0 76 $69,828 0 $0 FILES CLOSED FOR INCOMPLETENESS 7 $76,797 51 $93,942 105 $98,834 20 $32,268 0 $0 48 $73,080 0 $0
Aggregated Statistics For Year 2007(Based on 18 full and 8 partial tracts) A) FHA, FSA/RHS & VA B) Conventional C) Refinancings D) Home Improvement Loans E) Loans on Dwellings For 5+ Families F) Non-occupant Loans on G) Loans On Manufactured Number Average Value Number Average Value Number Average Value Number Average Value Number Average Value Number Average Value Number Average Value
LOANS ORIGINATED 48 $84,887 1,029 $82,472 1,162 $83,684 159 $39,468 0 $0 627 $73,819 3 $73,440 APPLICATIONS APPROVED, NOT ACCEPTED 1 $106,350 349 $82,441 451 $89,630 41 $45,845 0 $0 214 $75,460 6 $52,863 APPLICATIONS DENIED 45 $99,195 1,516 $93,342 2,383 $92,774 523 $43,538 0 $0 921 $83,590 14 $48,276 APPLICATIONS WITHDRAWN 27 $88,253 201 $83,075 628 $96,721 26 $92,214 3 $58,700 135 $73,199 0 $0 FILES CLOSED FOR INCOMPLETENESS 7 $91,549 103 $103,048 206 $97,499 10 $69,727 0 $0 58 $97,218 0 $0
Aggregated Statistics For Year 2006(Based on 18 full and 8 partial tracts) A) FHA, FSA/RHS & VA B) Conventional C) Refinancings D) Home Improvement Loans E) Loans on Dwellings For 5+ Families F) Non-occupant Loans on G) Loans On Manufactured Number Average Value Number Average Value Number Average Value Number Average Value Number Average Value Number Average Value Number Average Value
LOANS ORIGINATED 86 $97,970 2,028 $80,806 2,062 $86,147 213 $39,150 4 $357,460 1,059 $75,675 4 $67,452 APPLICATIONS APPROVED, NOT ACCEPTED 14 $100,796 913 $81,985 838 $91,460 71 $35,427 0 $0 352 $75,897 5 $34,952 APPLICATIONS DENIED 32 $93,122 2,213 $85,029 3,399 $95,374 695 $34,587 2 $145,500 1,030 $77,472 14 $80,143 APPLICATIONS WITHDRAWN 11 $119,132 593 $82,538 1,229 $98,242 76 $55,726 0 $0 310 $76,101 1 $185,400 FILES CLOSED FOR INCOMPLETENESS 8 $104,248 194 $88,681 469 $103,009 13 $72,713 0 $0 62 $96,560 2 $77,380
Aggregated Statistics For Year 2005(Based on 18 full and 8 partial tracts) A) FHA, FSA/RHS & VA B) Conventional C) Refinancings D) Home Improvement Loans E) Loans on Dwellings For 5+ Families F) Non-occupant Loans on G) Loans On Manufactured Number Average Value Number Average Value Number Average Value Number Average Value Number Average Value Number Average Value Number Average Value
LOANS ORIGINATED 141 $95,023 2,199 $79,075 2,858 $88,542 233 $49,742 2 $758,000 1,305 $76,518 3 $80,923 APPLICATIONS APPROVED, NOT ACCEPTED 30 $94,514 792 $75,818 967 $91,246 61 $51,854 0 $0 346 $76,050 7 $43,526 APPLICATIONS DENIED 43 $94,223 1,716 $81,144 3,648 $94,791 589 $41,356 3 $185,223 843 $76,679 7 $106,077 APPLICATIONS WITHDRAWN 35 $105,194 802 $96,104 1,828 $105,741 239 $144,977 0 $0 381 $88,973 1 $51,000 FILES CLOSED FOR INCOMPLETENESS 11 $93,823 158 $83,454 545 $98,889 22 $76,824 0 $0 78 $75,538 0 $0
Aggregated Statistics For Year 2004(Based on 18 full and 8 partial tracts) A) FHA, FSA/RHS & VA B) Conventional C) Refinancings D) Home Improvement Loans E) Loans on Dwellings For 5+ Families F) Non-occupant Loans on G) Loans On Manufactured Number Average Value Number Average Value Number Average Value Number Average Value Number Average Value Number Average Value Number Average Value
LOANS ORIGINATED 295 $95,801 1,545 $81,938 3,236 $86,262 331 $48,109 2 $177,375 1,036 $76,046 9 $112,122 APPLICATIONS APPROVED, NOT ACCEPTED 23 $107,908 772 $82,383 1,070 $89,965 53 $41,232 0 $0 311 $82,098 4 $42,625 APPLICATIONS DENIED 71 $90,697 1,078 $84,904 3,163 $89,651 528 $31,075 4 $211,278 603 $74,513 12 $53,510 APPLICATIONS WITHDRAWN 32 $95,663 381 $83,825 1,419 $98,930 92 $59,572 4 $50,852 192 $78,585 8 $108,765 FILES CLOSED FOR INCOMPLETENESS 13 $101,765 119 $86,667 537 $97,289 24 $45,184 0 $0 54 $83,870 0 $0
Aggregated Statistics For Year 2003(Based on 18 full and 8 partial tracts) A) FHA, FSA/RHS & VA B) Conventional C) Refinancings D) Home Improvement Loans F) Non-occupant Loans on Number Average Value Number Average Value Number Average Value Number Average Value Number Average Value
LOANS ORIGINATED 382 $97,414 1,175 $85,229 4,196 $83,114 325 $13,495 817 $65,840 APPLICATIONS APPROVED, NOT ACCEPTED 21 $87,090 409 $85,722 1,049 $83,713 69 $14,174 220 $71,167 APPLICATIONS DENIED 80 $96,803 722 $87,290 3,134 $85,556 616 $11,305 402 $71,858 APPLICATIONS WITHDRAWN 44 $101,724 233 $84,222 1,184 $88,726 37 $23,877 134 $69,616 FILES CLOSED FOR INCOMPLETENESS 26 $92,527 66 $89,491 379 $85,736 13 $30,704 42 $72,282
Aggregated Statistics For Year 2002(Based on 18 full and 8 partial tracts) A) FHA, FSA/RHS & VA B) Conventional C) Refinancings D) Home Improvement Loans E) Loans on Dwellings For 5+ Families F) Non-occupant Loans on Number Average Value Number Average Value Number Average Value Number Average Value Number Average Value Number Average Value
LOANS ORIGINATED 561 $92,940 782 $82,026 3,389 $80,143 337 $13,330 0 $0 582 $68,890 APPLICATIONS APPROVED, NOT ACCEPTED 26 $97,913 177 $82,642 1,000 $78,782 97 $15,368 0 $0 110 $61,551 APPLICATIONS DENIED 78 $91,771 423 $73,817 2,724 $75,602 716 $9,782 2 $105,000 250 $64,738 APPLICATIONS WITHDRAWN 77 $90,846 166 $83,077 1,449 $78,832 32 $42,285 0 $0 91 $74,246 FILES CLOSED FOR INCOMPLETENESS 9 $88,548 69 $78,447 471 $84,550 3 $19,787 0 $0 50 $75,039
Aggregated Statistics For Year 2001(Based on 18 full and 8 partial tracts) A) FHA, FSA/RHS & VA B) Conventional C) Refinancings D) Home Improvement Loans E) Loans on Dwellings For 5+ Families F) Non-occupant Loans on Number Average Value Number Average Value Number Average Value Number Average Value Number Average Value Number Average Value
LOANS ORIGINATED 638 $89,587 716 $77,485 3,714 $77,248 467 $12,707 5 $121,572 462 $60,748 APPLICATIONS APPROVED, NOT ACCEPTED 37 $86,183 180 $77,576 932 $73,797 192 $15,772 2 $55,945 107 $55,655 APPLICATIONS DENIED 96 $82,828 448 $73,942 3,231 $68,117 1,150 $11,489 0 $0 286 $57,335 APPLICATIONS WITHDRAWN 130 $88,638 168 $81,570 1,580 $73,534 88 $27,537 0 $0 82 $55,140 FILES CLOSED FOR INCOMPLETENESS 24 $87,945 20 $72,168 401 $79,684 4 $16,562 0 $0 28 $57,189
Aggregated Statistics For Year 2000(Based on 18 full and 8 partial tracts) A) FHA, FSA/RHS & VA B) Conventional C) Refinancings D) Home Improvement Loans E) Loans on Dwellings For 5+ Families F) Non-occupant Loans on Number Average Value Number Average Value Number Average Value Number Average Value Number Average Value Number Average Value
LOANS ORIGINATED 837 $86,195 653 $75,675 2,160 $67,149 615 $11,704 3 $159,070 386 $54,128 APPLICATIONS APPROVED, NOT ACCEPTED 43 $78,570 166 $69,153 775 $64,478 338 $19,019 0 $0 109 $51,357 APPLICATIONS DENIED 127 $79,339 457 $68,052 2,526 $81,497 1,598 $12,649 0 $0 229 $51,964 APPLICATIONS WITHDRAWN 67 $78,872 199 $75,347 1,054 $60,777 51 $43,643 4 $129,210 83 $58,763 FILES CLOSED FOR INCOMPLETENESS 20 $75,639 43 $69,542 303 $66,321 12 $15,367 0 $0 24 $44,562
Aggregated Statistics For Year 1999(Based on 11 full and 4 partial tracts) A) FHA, FSA/RHS & VA B) Conventional C) Refinancings D) Home Improvement Loans E) Loans on Dwellings For 5+ Families F) Non-occupant Loans on Number Average Value Number Average Value Number Average Value Number Average Value Number Average Value Number Average Value
LOANS ORIGINATED 537 $77,875 346 $68,534 1,971 $60,968 320 $10,842 3 $339,607 248 $47,966 APPLICATIONS APPROVED, NOT ACCEPTED 14 $75,389 70 $66,860 693 $61,091 175 $14,112 1 $210,000 56 $49,566 APPLICATIONS DENIED 52 $77,982 166 $59,986 1,372 $58,255 666 $11,024 1 $10,000 138 $44,994 APPLICATIONS WITHDRAWN 66 $71,519 89 $67,279 885 $59,713 46 $26,231 0 $0 57 $57,278 FILES CLOSED FOR INCOMPLETENESS 12 $62,282 15 $58,793 284 $59,968 6 $31,162 0 $0 12 $50,448
Private Mortgage Insurance Companies Aggregated Statistics For Year 2009(Based on 14 full and 2 partial tracts) A) Conventional B) Refinancings C) Non-occupant Loans on Number Average Value Number Average Value Number Average Value
LOANS ORIGINATED 0 $0 0 $0 0 $0 APPLICATIONS APPROVED, NOT ACCEPTED 10 $121,754 4 $95,628 0 $0 APPLICATIONS DENIED 0 $0 0 $0 0 $0 APPLICATIONS WITHDRAWN 0 $0 0 $0 0 $0 FILES CLOSED FOR INCOMPLETENESS 11 $96,435 0 $0 2 $82,500
Aggregated Statistics For Year 2008(Based on 18 full and 8 partial tracts) A) Conventional B) Refinancings C) Non-occupant Loans on Number Average Value Number Average Value Number Average Value
LOANS ORIGINATED 127 $91,487 24 $90,834 27 $81,627 APPLICATIONS APPROVED, NOT ACCEPTED 161 $92,612 38 $109,763 45 $88,345 APPLICATIONS DENIED 51 $96,570 2 $86,450 11 $83,149 APPLICATIONS WITHDRAWN 29 $94,988 6 $113,413 8 $63,590 FILES CLOSED FOR INCOMPLETENESS 12 $83,560 1 $144,470 3 $120,157
Aggregated Statistics For Year 2007(Based on 18 full and 8 partial tracts) A) Conventional B) Refinancings C) Non-occupant Loans on Number Average Value Number Average Value Number Average Value
LOANS ORIGINATED 387 $92,816 119 $102,962 113 $88,220 APPLICATIONS APPROVED, NOT ACCEPTED 88 $100,389 43 $105,018 31 $81,372 APPLICATIONS DENIED 36 $99,212 5 $125,322 21 $83,598 APPLICATIONS WITHDRAWN 55 $93,358 1 $163,070 23 $83,396 FILES CLOSED FOR INCOMPLETENESS 7 $102,190 2 $94,620 7 $93,546
Aggregated Statistics For Year 2006(Based on 18 full and 8 partial tracts) A) Conventional B) Refinancings C) Non-occupant Loans on Number Average Value Number Average Value Number Average Value
LOANS ORIGINATED 131 $95,916 108 $99,123 57 $83,231 APPLICATIONS APPROVED, NOT ACCEPTED 53 $79,530 39 $110,444 31 $69,604 APPLICATIONS DENIED 5 $104,772 4 $89,100 4 $89,100 APPLICATIONS WITHDRAWN 16 $94,681 7 $140,589 6 $53,178 FILES CLOSED FOR INCOMPLETENESS 0 $0 2 $90,000 0 $0
Aggregated Statistics For Year 2005(Based on 18 full and 8 partial tracts) A) Conventional B) Refinancings C) Non-occupant Loans on Number Average Value Number Average Value Number Average Value
LOANS ORIGINATED 235 $93,307 126 $112,809 105 $86,655 APPLICATIONS APPROVED, NOT ACCEPTED 68 $94,060 71 $115,680 40 $79,538 APPLICATIONS DENIED 5 $92,920 8 $89,716 7 $78,169 APPLICATIONS WITHDRAWN 17 $81,228 17 $105,263 8 $72,624 FILES CLOSED FOR INCOMPLETENESS 0 $0 4 $105,270 0 $0
Aggregated Statistics For Year 2004(Based on 18 full and 8 partial tracts) A) Conventional B) Refinancings C) Non-occupant Loans on Number Average Value Number Average Value Number Average Value
LOANS ORIGINATED 264 $90,802 191 $102,927 118 $79,612 APPLICATIONS APPROVED, NOT ACCEPTED 113 $102,364 85 $106,923 50 $75,072 APPLICATIONS DENIED 24 $87,781 7 $123,210 11 $75,793 APPLICATIONS WITHDRAWN 25 $96,481 40 $110,418 12 $76,032 FILES CLOSED FOR INCOMPLETENESS 4 $113,715 0 $0 0 $0
Aggregated Statistics For Year 2003(Based on 18 full and 8 partial tracts) A) Conventional B) Refinancings C) Non-occupant Loans on Number Average Value Number Average Value Number Average Value
LOANS ORIGINATED 350 $91,146 291 $104,624 126 $71,212 APPLICATIONS APPROVED, NOT ACCEPTED 94 $85,006 84 $101,153 47 $79,174 APPLICATIONS DENIED 24 $82,677 14 $114,385 22 $87,915 APPLICATIONS WITHDRAWN 29 $99,381 29 $116,804 11 $77,374 FILES CLOSED FOR INCOMPLETENESS 0 $0 3 $91,523 2 $61,785
Aggregated Statistics For Year 2002(Based on 18 full and 8 partial tracts) A) Conventional B) Refinancings C) Non-occupant Loans on Number Average Value Number Average Value Number Average Value
LOANS ORIGINATED 249 $90,179 271 $101,670 67 $78,380 APPLICATIONS APPROVED, NOT ACCEPTED 44 $80,723 97 $106,021 14 $100,419 APPLICATIONS DENIED 23 $96,324 26 $97,550 17 $88,154 APPLICATIONS WITHDRAWN 24 $100,975 30 $107,498 11 $103,307 FILES CLOSED FOR INCOMPLETENESS 0 $0 3 $100,087 0 $0
Aggregated Statistics For Year 2001(Based on 18 full and 8 partial tracts) A) Conventional B) Refinancings C) Non-occupant Loans on Number Average Value Number Average Value Number Average Value
LOANS ORIGINATED 319 $87,101 286 $99,707 82 $65,133 APPLICATIONS APPROVED, NOT ACCEPTED 45 $78,314 56 $97,502 30 $70,692 APPLICATIONS DENIED 30 $67,222 29 $92,048 7 $70,759 APPLICATIONS WITHDRAWN 5 $119,246 11 $116,534 5 $81,306 FILES CLOSED FOR INCOMPLETENESS 2 $23,245 0 $0 0 $0
Aggregated Statistics For Year 2000(Based on 18 full and 8 partial tracts) A) Conventional B) Refinancings C) Non-occupant Loans on Number Average Value Number Average Value Number Average Value
LOANS ORIGINATED 260 $81,230 258 $77,027 54 $60,288 APPLICATIONS APPROVED, NOT ACCEPTED 33 $89,608 26 $84,805 9 $58,353 APPLICATIONS DENIED 20 $90,430 8 $95,378 4 $41,910 APPLICATIONS WITHDRAWN 7 $58,029 10 $75,869 3 $55,833 FILES CLOSED FOR INCOMPLETENESS 3 $76,963 0 $0 0 $0
Aggregated Statistics For Year 1999(Based on 11 full and 4 partial tracts) A) Conventional B) Refinancings C) Non-occupant Loans on Number Average Value Number Average Value Number Average Value
LOANS ORIGINATED 124 $82,750 79 $74,581 18 $59,765 APPLICATIONS APPROVED, NOT ACCEPTED 15 $86,255 15 $81,221 2 $51,000 APPLICATIONS DENIED 4 $74,078 9 $76,722 1 $38,940 APPLICATIONS WITHDRAWN 4 $72,502 3 $64,227 0 $0 FILES CLOSED FOR INCOMPLETENESS 0 $0 1 $70,000 0 $0
2002 - 2018 National Fire Incident Reporting System (NFIRS) incidents See full 2006 National Fire Incident Reporting System statistics for zip code 48224, Michigan
Most common first names in zip code 48224 among deceased individuals Name Count Lived (average)
John 550 74.3 years Mary 516 78.9 years William 395 74.3 years Joseph 340 74.0 years James 282 70.4 years George 264 75.0 years Charles 235 72.9 years Frank 227 76.2 years Helen 222 78.3 years Robert 221 67.1 years
Most common last names in zip code 48224 among deceased individuals Last name Count Lived (average)
Smith 159 72.1 years Williams 104 69.0 years Johnson 103 72.4 years Brown 80 72.6 years Jones 79 72.8 years Miller 67 74.5 years Davis 64 67.5 years Wilson 57 70.1 years Thomas 51 71.6 years Taylor 49 74.6 years
Businesses in zip code 48224
Name Count Name Count
Advance Auto Parts 1 Penske 1 AutoZone 1 Pizza Hut 1 Burger King 2 Popeyes 1 H&R Block 3 Rite Aid 1 KFC 1 Taco Bell 1 Little Caesars Pizza 2 True Value 2 McDonald's 1 Wendy's 2 Nike 2 White Castle 2

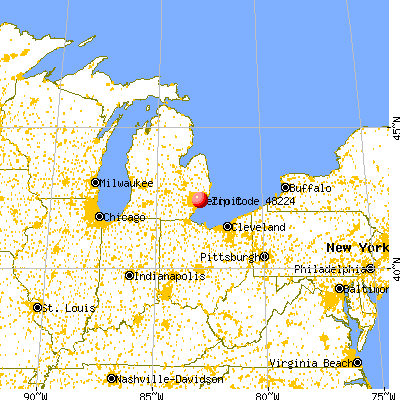


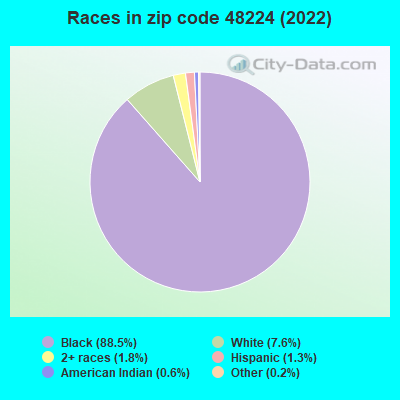


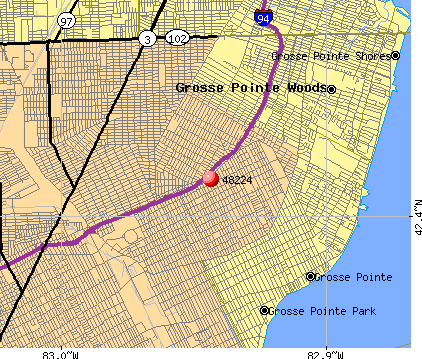 Nearest zip codes: 48225, 48230, 48215, 48205, 48236, 48213.
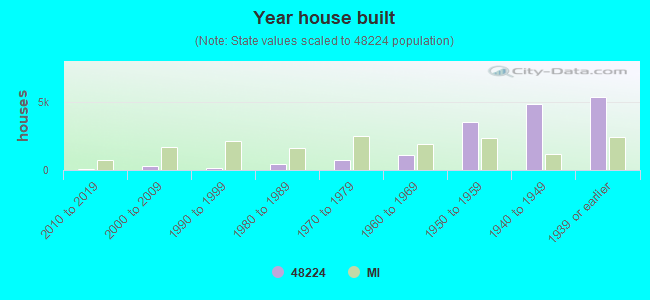

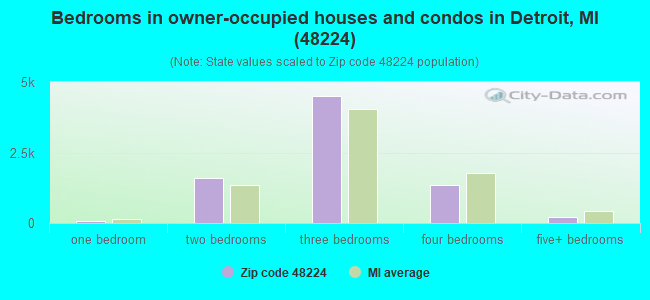
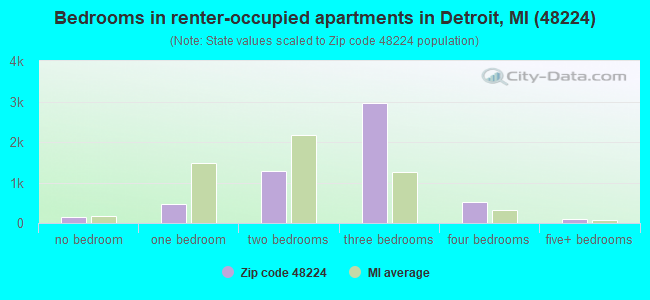
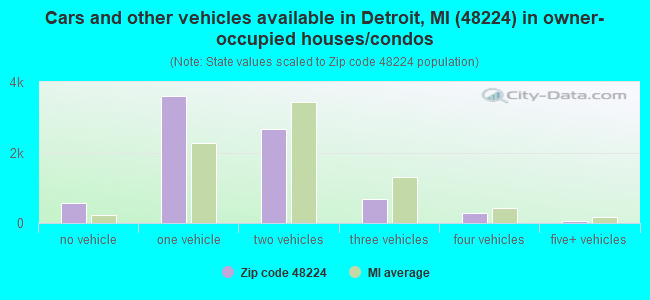
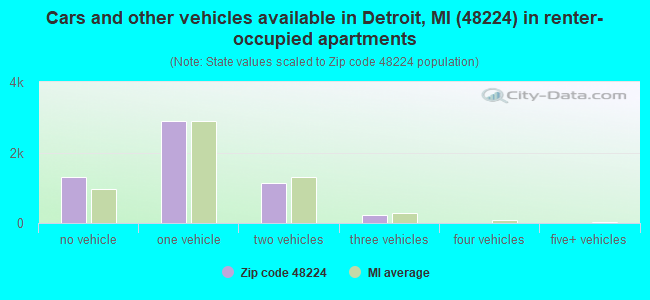


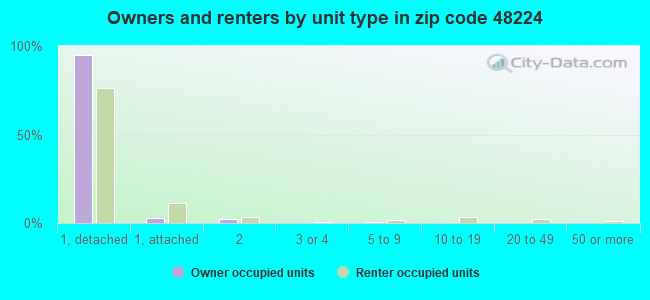
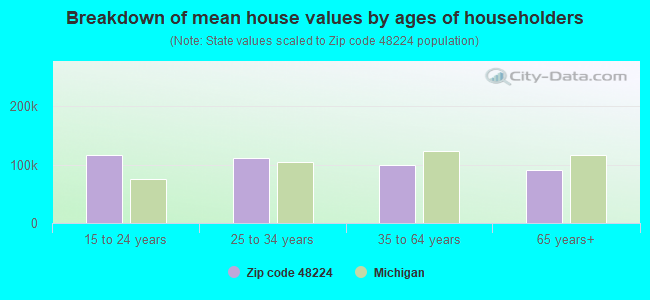


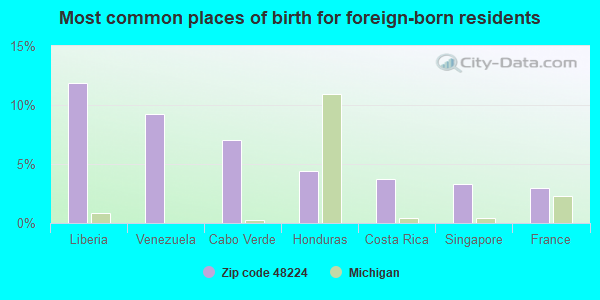
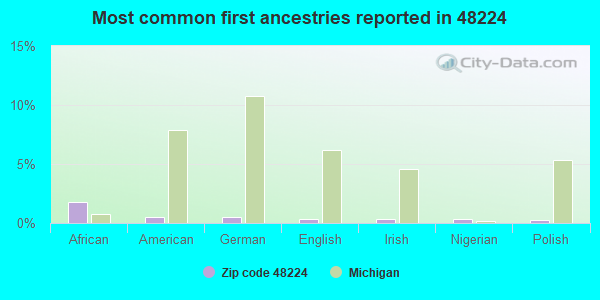
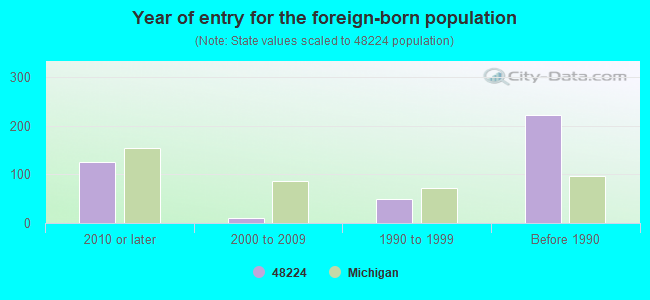


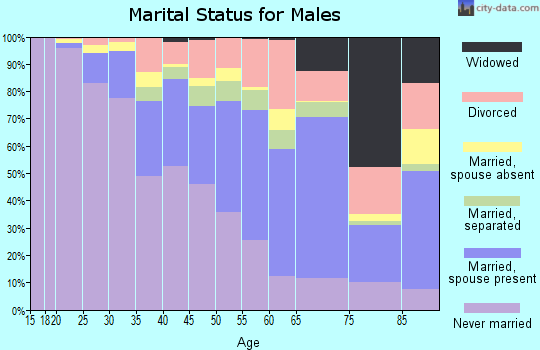

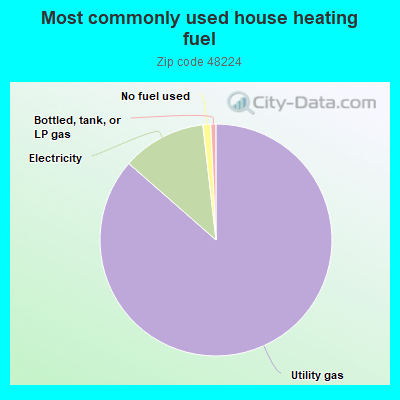
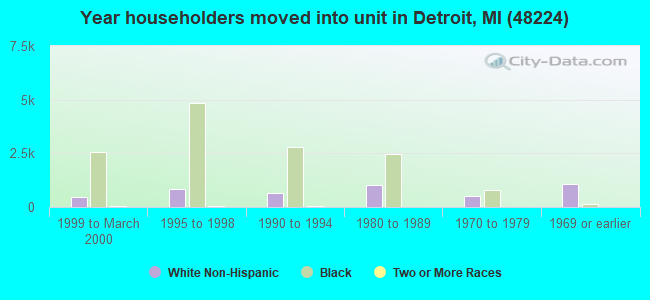
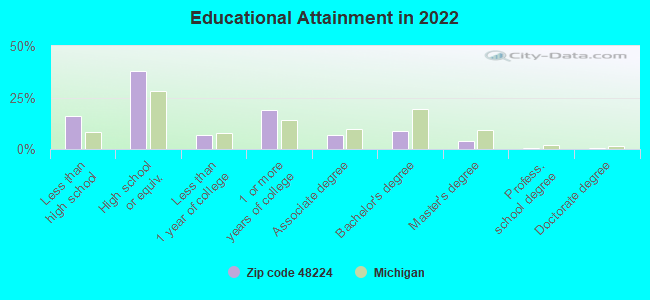
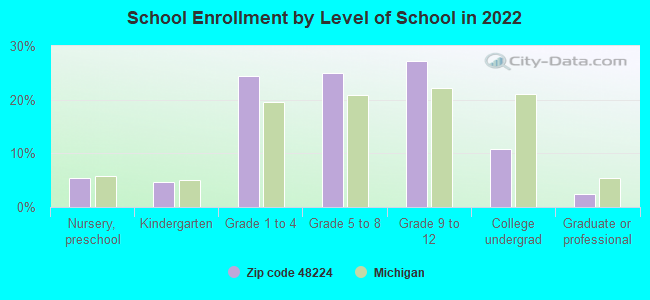
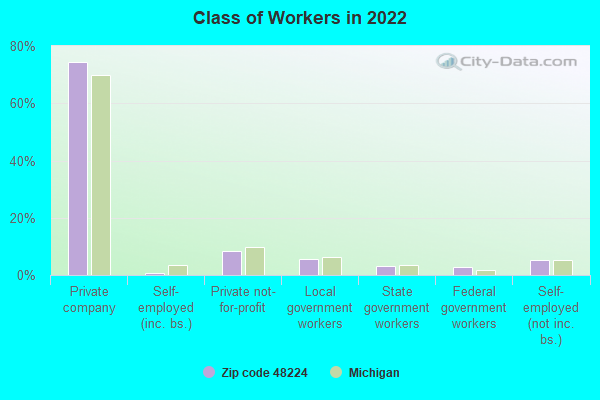
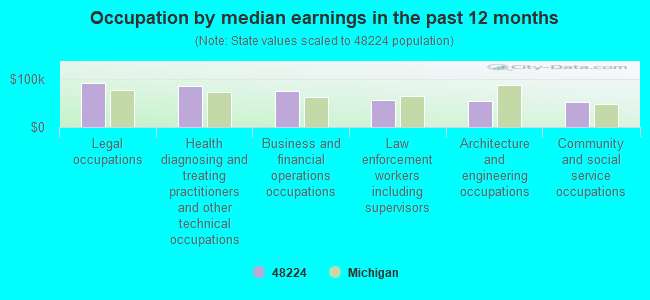
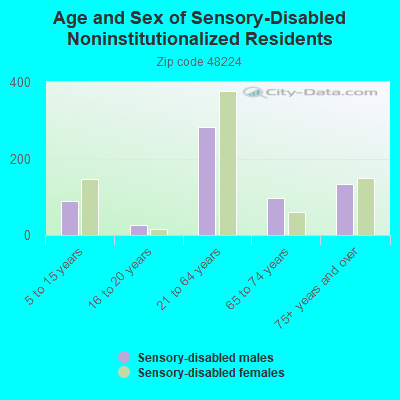
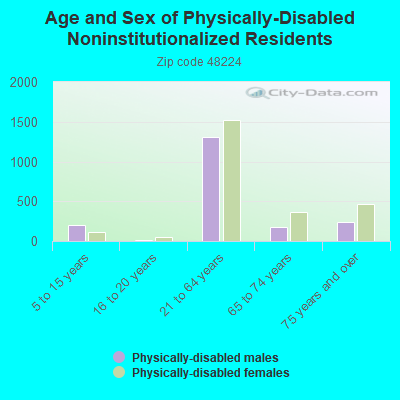
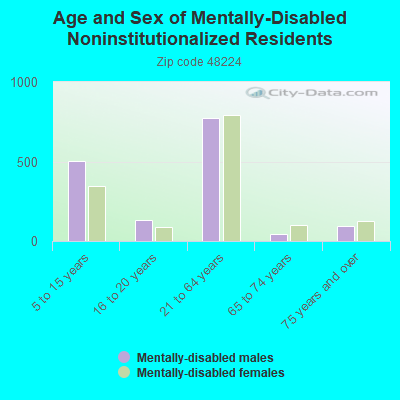
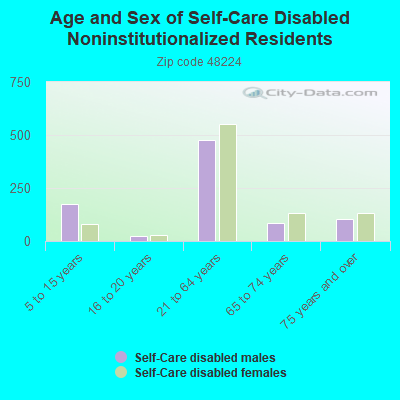
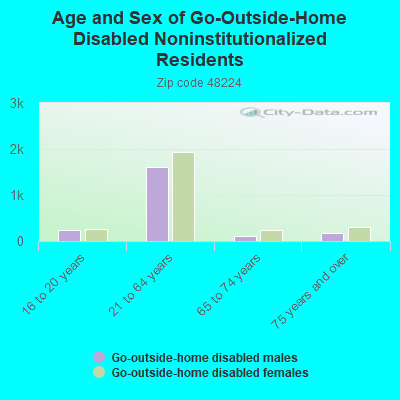
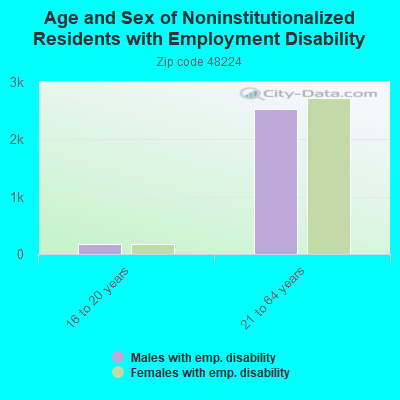
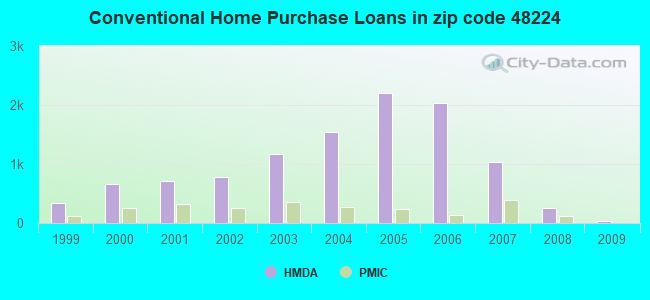
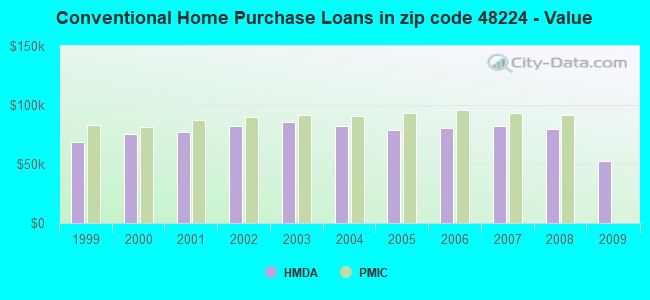
 Based on the data from the years 2002 - 2018 the average number of fires per year is 255. The highest number of fires - 496 took place in 2014, and the least - 0 in 2006. The data has an increasing trend.
 When looking into fire subcategories, the most reports belonged to: Structure Fires (61.2%), and Mobile Property/Vehicle Fires (19.9%).