Estimated zip code population in 2022: 31,740
Zip code population in 2010: 44,045
Zip code population in 2000: 67,012
Houses and condos: 17,243
Renter-occupied apartments: 7,809
% of renters here:
62%State:
27%
March 2022 cost of living index in zip code 48205: 93.8
(less than average, U.S. average is 100)
Land area: 6.4
sq. mi.
Water area: 0.0
sq. mi.
Population density: 4,973 people per square mile (average).
OSM Map
General Map
Google Map
MSN Map
OSM Map
General Map
Google Map
MSN Map
OSM Map
General Map
Google Map
MSN Map
OSM Map
General Map
Google Map
MSN Map
Please wait while loading the map...
Real estate property taxes paid for housing units in 2022:
This zip code:
2.4% ($1,270)Michigan:
1.2% ($2,746)
Median real estate property taxes paid for housing units with mortgages in 2022: $1,262 (2.2%)
Median real estate property taxes paid for housing units with no mortgage in 2022: $1,269 (2.4%)
Profiles of local businesses
Business Search - 14 Million verified businesses
Males: 15,467 Females: 16,273
For population 25 years and over in 48205:
High school or higher: 85.9%Bachelor's degree or higher: 7.9%Graduate or professional degree: 2.6%Unemployed: 13.4%Mean travel time to work (commute): 22.1 minutes
For population 15 years and over in 48205:
Never married: 66.0%Now married: 18.3%Separated: 3.0%Widowed: 5.4%Divorced: 7.3%
Zip code 48205 compared to state average:
Median household income below state average. Median house value significantly below state average. Unemployed percentage above state average. Black race population percentage significantly above state average. Hispanic race population percentage significantly below state average. Median age significantly below state average. Foreign-born population percentage significantly below state average. Renting percentage significantly above state average. Length of stay since moving in significantly above state average. House age above state average. Percentage of population with a bachelor's degree or higher significantly below state average. 29,937 94.3% Black 1,005 3.2% White 324 1.0% Two or more races 234 0.7% Asian 143 0.5% Hispanic or Latino 50 0.2% Some other race 43 0.1% American Indian
Data:
Median household income ($)
Median household income (% change since 2000)
Household income diversity
Ratio of average income to average house value (%)
Ratio of average income to average rent
Median household income ($) - White
Median household income ($) - Black or African American
Median household income ($) - Asian
Median household income ($) - Hispanic or Latino
Median household income ($) - American Indian and Alaska Native
Median household income ($) - Multirace
Median household income ($) - Other Race
Median household income for houses/condos with a mortgage ($)
Median household income for apartments without a mortgage ($)
Races - White alone (%)
Races - White alone (% change since 2000)
Races - Black alone (%)
Races - Black alone (% change since 2000)
Races - American Indian alone (%)
Races - American Indian alone (% change since 2000)
Races - Asian alone (%)
Races - Asian alone (% change since 2000)
Races - Hispanic (%)
Races - Hispanic (% change since 2000)
Races - Native Hawaiian and Other Pacific Islander alone (%)
Races - Native Hawaiian and Other Pacific Islander alone (% change since 2000)
Races - Two or more races (%)
Races - Two or more races (% change since 2000)
Races - Other race alone (%)
Races - Other race alone (% change since 2000)
Racial diversity
Unemployment (%)
Unemployment (% change since 2000)
Unemployment (%) - White
Unemployment (%) - Black or African American
Unemployment (%) - Asian
Unemployment (%) - Hispanic or Latino
Unemployment (%) - American Indian and Alaska Native
Unemployment (%) - Multirace
Unemployment (%) - Other Race
Population density (people per square mile)
Population - Males (%)
Population - Females (%)
Population - Males (%) - White
Population - Males (%) - Black or African American
Population - Males (%) - Asian
Population - Males (%) - Hispanic or Latino
Population - Males (%) - American Indian and Alaska Native
Population - Males (%) - Multirace
Population - Males (%) - Other Race
Population - Females (%) - White
Population - Females (%) - Black or African American
Population - Females (%) - Asian
Population - Females (%) - Hispanic or Latino
Population - Females (%) - American Indian and Alaska Native
Population - Females (%) - Multirace
Population - Females (%) - Other Race
Coronavirus confirmed cases (Apr 27, 2024)
Deaths caused by coronavirus (Apr 27, 2024)
Coronavirus confirmed cases (per 100k population) (Apr 27, 2024)
Deaths caused by coronavirus (per 100k population) (Apr 27, 2024)
Daily increase in number of cases (Apr 27, 2024)
Weekly increase in number of cases (Apr 27, 2024)
Cases doubled (in days) (Apr 27, 2024)
Hospitalized patients (Apr 18, 2022)
Negative test results (Apr 18, 2022)
Total test results (Apr 18, 2022)
COVID Vaccine doses distributed (per 100k population) (Sep 19, 2023)
COVID Vaccine doses administered (per 100k population) (Sep 19, 2023)
COVID Vaccine doses distributed (Sep 19, 2023)
COVID Vaccine doses administered (Sep 19, 2023)
Likely homosexual households (%)
Likely homosexual households (% change since 2000)
Likely homosexual households - Lesbian couples (%)
Likely homosexual households - Lesbian couples (% change since 2000)
Likely homosexual households - Gay men (%)
Likely homosexual households - Gay men (% change since 2000)
Cost of living index
Median gross rent ($)
Median contract rent ($)
Median monthly housing costs ($)
Median house or condo value ($)
Median house or condo value ($ change since 2000)
Mean house or condo value by units in structure - 1, detached ($)
Mean house or condo value by units in structure - 1, attached ($)
Mean house or condo value by units in structure - 2 ($)
Mean house or condo value by units in structure by units in structure - 3 or 4 ($)
Mean house or condo value by units in structure - 5 or more ($)
Mean house or condo value by units in structure - Boat, RV, van, etc. ($)
Mean house or condo value by units in structure - Mobile home ($)
Median house or condo value ($) - White
Median house or condo value ($) - Black or African American
Median house or condo value ($) - Asian
Median house or condo value ($) - Hispanic or Latino
Median house or condo value ($) - American Indian and Alaska Native
Median house or condo value ($) - Multirace
Median house or condo value ($) - Other Race
Median resident age
Resident age diversity
Median resident age - Males
Median resident age - Females
Median resident age - White
Median resident age - Black or African American
Median resident age - Asian
Median resident age - Hispanic or Latino
Median resident age - American Indian and Alaska Native
Median resident age - Multirace
Median resident age - Other Race
Median resident age - Males - White
Median resident age - Males - Black or African American
Median resident age - Males - Asian
Median resident age - Males - Hispanic or Latino
Median resident age - Males - American Indian and Alaska Native
Median resident age - Males - Multirace
Median resident age - Males - Other Race
Median resident age - Females - White
Median resident age - Females - Black or African American
Median resident age - Females - Asian
Median resident age - Females - Hispanic or Latino
Median resident age - Females - American Indian and Alaska Native
Median resident age - Females - Multirace
Median resident age - Females - Other Race
Commute - mean travel time to work (minutes)
Travel time to work - Less than 5 minutes (%)
Travel time to work - Less than 5 minutes (% change since 2000)
Travel time to work - 5 to 9 minutes (%)
Travel time to work - 5 to 9 minutes (% change since 2000)
Travel time to work - 10 to 19 minutes (%)
Travel time to work - 10 to 19 minutes (% change since 2000)
Travel time to work - 20 to 29 minutes (%)
Travel time to work - 20 to 29 minutes (% change since 2000)
Travel time to work - 30 to 39 minutes (%)
Travel time to work - 30 to 39 minutes (% change since 2000)
Travel time to work - 40 to 59 minutes (%)
Travel time to work - 40 to 59 minutes (% change since 2000)
Travel time to work - 60 to 89 minutes (%)
Travel time to work - 60 to 89 minutes (% change since 2000)
Travel time to work - 90 or more minutes (%)
Travel time to work - 90 or more minutes (% change since 2000)
Marital status - Never married (%)
Marital status - Now married (%)
Marital status - Separated (%)
Marital status - Widowed (%)
Marital status - Divorced (%)
Median family income ($)
Median family income (% change since 2000)
Median non-family income ($)
Median non-family income (% change since 2000)
Median per capita income ($)
Median per capita income (% change since 2000)
Median family income ($) - White
Median family income ($) - Black or African American
Median family income ($) - Asian
Median family income ($) - Hispanic or Latino
Median family income ($) - American Indian and Alaska Native
Median family income ($) - Multirace
Median family income ($) - Other Race
Median year house/condo built
Median year apartment built
Year house built - Built 2005 or later (%)
Year house built - Built 2000 to 2004 (%)
Year house built - Built 1990 to 1999 (%)
Year house built - Built 1980 to 1989 (%)
Year house built - Built 1970 to 1979 (%)
Year house built - Built 1960 to 1969 (%)
Year house built - Built 1950 to 1959 (%)
Year house built - Built 1940 to 1949 (%)
Year house built - Built 1939 or earlier (%)
Average household size
Household density (households per square mile)
Average household size - White
Average household size - Black or African American
Average household size - Asian
Average household size - Hispanic or Latino
Average household size - American Indian and Alaska Native
Average household size - Multirace
Average household size - Other Race
Occupied housing units (%)
Vacant housing units (%)
Owner occupied housing units (%)
Renter occupied housing units (%)
Vacancy status - For rent (%)
Vacancy status - For sale only (%)
Vacancy status - Rented or sold, not occupied (%)
Vacancy status - For seasonal, recreational, or occasional use (%)
Vacancy status - For migrant workers (%)
Vacancy status - Other vacant (%)
Residents with income below the poverty level (%)
Residents with income below 50% of the poverty level (%)
Children below poverty level (%)
Poor families by family type - Married-couple family (%)
Poor families by family type - Male, no wife present (%)
Poor families by family type - Female, no husband present (%)
Poverty status for native-born residents (%)
Poverty status for foreign-born residents (%)
Poverty among high school graduates not in families (%)
Poverty among people who did not graduate high school not in families (%)
Residents with income below the poverty level (%) - White
Residents with income below the poverty level (%) - Black or African American
Residents with income below the poverty level (%) - Asian
Residents with income below the poverty level (%) - Hispanic or Latino
Residents with income below the poverty level (%) - American Indian and Alaska Native
Residents with income below the poverty level (%) - Multirace
Residents with income below the poverty level (%) - Other Race
Air pollution - Air Quality Index (AQI)
Air pollution - CO
Air pollution - NO2
Air pollution - SO2
Air pollution - Ozone
Air pollution - PM10
Air pollution - PM25
Air pollution - Pb
Crime - Murders per 100,000 population
Crime - Rapes per 100,000 population
Crime - Robberies per 100,000 population
Crime - Assaults per 100,000 population
Crime - Burglaries per 100,000 population
Crime - Thefts per 100,000 population
Crime - Auto thefts per 100,000 population
Crime - Arson per 100,000 population
Crime - City-data.com crime index
Crime - Violent crime index
Crime - Property crime index
Crime - Murders per 100,000 population (5 year average)
Crime - Rapes per 100,000 population (5 year average)
Crime - Robberies per 100,000 population (5 year average)
Crime - Assaults per 100,000 population (5 year average)
Crime - Burglaries per 100,000 population (5 year average)
Crime - Thefts per 100,000 population (5 year average)
Crime - Auto thefts per 100,000 population (5 year average)
Crime - Arson per 100,000 population (5 year average)
Crime - City-data.com crime index (5 year average)
Crime - Violent crime index (5 year average)
Crime - Property crime index (5 year average)
1996 Presidential Elections Results (%) - Democratic Party (Clinton)
1996 Presidential Elections Results (%) - Republican Party (Dole)
1996 Presidential Elections Results (%) - Other
2000 Presidential Elections Results (%) - Democratic Party (Gore)
2000 Presidential Elections Results (%) - Republican Party (Bush)
2000 Presidential Elections Results (%) - Other
2004 Presidential Elections Results (%) - Democratic Party (Kerry)
2004 Presidential Elections Results (%) - Republican Party (Bush)
2004 Presidential Elections Results (%) - Other
2008 Presidential Elections Results (%) - Democratic Party (Obama)
2008 Presidential Elections Results (%) - Republican Party (McCain)
2008 Presidential Elections Results (%) - Other
2012 Presidential Elections Results (%) - Democratic Party (Obama)
2012 Presidential Elections Results (%) - Republican Party (Romney)
2012 Presidential Elections Results (%) - Other
2016 Presidential Elections Results (%) - Democratic Party (Clinton)
2016 Presidential Elections Results (%) - Republican Party (Trump)
2016 Presidential Elections Results (%) - Other
2020 Presidential Elections Results (%) - Democratic Party (Biden)
2020 Presidential Elections Results (%) - Republican Party (Trump)
2020 Presidential Elections Results (%) - Other
Ancestries Reported - Arab (%)
Ancestries Reported - Czech (%)
Ancestries Reported - Danish (%)
Ancestries Reported - Dutch (%)
Ancestries Reported - English (%)
Ancestries Reported - French (%)
Ancestries Reported - French Canadian (%)
Ancestries Reported - German (%)
Ancestries Reported - Greek (%)
Ancestries Reported - Hungarian (%)
Ancestries Reported - Irish (%)
Ancestries Reported - Italian (%)
Ancestries Reported - Lithuanian (%)
Ancestries Reported - Norwegian (%)
Ancestries Reported - Polish (%)
Ancestries Reported - Portuguese (%)
Ancestries Reported - Russian (%)
Ancestries Reported - Scotch-Irish (%)
Ancestries Reported - Scottish (%)
Ancestries Reported - Slovak (%)
Ancestries Reported - Subsaharan African (%)
Ancestries Reported - Swedish (%)
Ancestries Reported - Swiss (%)
Ancestries Reported - Ukrainian (%)
Ancestries Reported - United States (%)
Ancestries Reported - Welsh (%)
Ancestries Reported - West Indian (%)
Ancestries Reported - Other (%)
Educational Attainment - No schooling completed (%)
Educational Attainment - Less than high school (%)
Educational Attainment - High school or equivalent (%)
Educational Attainment - Less than 1 year of college (%)
Educational Attainment - 1 or more years of college (%)
Educational Attainment - Associate degree (%)
Educational Attainment - Bachelor's degree (%)
Educational Attainment - Master's degree (%)
Educational Attainment - Professional school degree (%)
Educational Attainment - Doctorate degree (%)
School Enrollment - Nursery, preschool (%)
School Enrollment - Kindergarten (%)
School Enrollment - Grade 1 to 4 (%)
School Enrollment - Grade 5 to 8 (%)
School Enrollment - Grade 9 to 12 (%)
School Enrollment - College undergrad (%)
School Enrollment - Graduate or professional (%)
School Enrollment - Not enrolled in school (%)
School enrollment - Public schools (%)
School enrollment - Private schools (%)
School enrollment - Not enrolled (%)
Median number of rooms in houses and condos
Median number of rooms in apartments
Housing units lacking complete plumbing facilities (%)
Housing units lacking complete kitchen facilities (%)
Density of houses
Urban houses (%)
Rural houses (%)
Households with people 60 years and over (%)
Households with people 65 years and over (%)
Households with people 75 years and over (%)
Households with one or more nonrelatives (%)
Households with no nonrelatives (%)
Population in households (%)
Family households (%)
Nonfamily households (%)
Population in families (%)
Family households with own children (%)
Median number of bedrooms in owner occupied houses
Mean number of bedrooms in owner occupied houses
Median number of bedrooms in renter occupied houses
Mean number of bedrooms in renter occupied houses
Median number of vehichles in owner occupied houses
Mean number of vehichles in owner occupied houses
Median number of vehichles in renter occupied houses
Mean number of vehichles in renter occupied houses
Mortgage status - with mortgage (%)
Mortgage status - with second mortgage (%)
Mortgage status - with home equity loan (%)
Mortgage status - with both second mortgage and home equity loan (%)
Mortgage status - without a mortgage (%)
Average family size
Average family size - White
Average family size - Black or African American
Average family size - Asian
Average family size - Hispanic or Latino
Average family size - American Indian and Alaska Native
Average family size - Multirace
Average family size - Other Race
Geographical mobility - Same house 1 year ago (%)
Geographical mobility - Moved within same county (%)
Geographical mobility - Moved from different county within same state (%)
Geographical mobility - Moved from different state (%)
Geographical mobility - Moved from abroad (%)
Place of birth - Born in state of residence (%)
Place of birth - Born in other state (%)
Place of birth - Native, outside of US (%)
Place of birth - Foreign born (%)
Housing units in structures - 1, detached (%)
Housing units in structures - 1, attached (%)
Housing units in structures - 2 (%)
Housing units in structures - 3 or 4 (%)
Housing units in structures - 5 to 9 (%)
Housing units in structures - 10 to 19 (%)
Housing units in structures - 20 to 49 (%)
Housing units in structures - 50 or more (%)
Housing units in structures - Mobile home (%)
Housing units in structures - Boat, RV, van, etc. (%)
House/condo owner moved in on average (years ago)
Renter moved in on average (years ago)
Year householder moved into unit - Moved in 1999 to March 2000 (%)
Year householder moved into unit - Moved in 1995 to 1998 (%)
Year householder moved into unit - Moved in 1990 to 1994 (%)
Year householder moved into unit - Moved in 1980 to 1989 (%)
Year householder moved into unit - Moved in 1970 to 1979 (%)
Year householder moved into unit - Moved in 1969 or earlier (%)
Means of transportation to work - Drove car alone (%)
Means of transportation to work - Carpooled (%)
Means of transportation to work - Public transportation (%)
Means of transportation to work - Bus or trolley bus (%)
Means of transportation to work - Streetcar or trolley car (%)
Means of transportation to work - Subway or elevated (%)
Means of transportation to work - Railroad (%)
Means of transportation to work - Ferryboat (%)
Means of transportation to work - Taxicab (%)
Means of transportation to work - Motorcycle (%)
Means of transportation to work - Bicycle (%)
Means of transportation to work - Walked (%)
Means of transportation to work - Other means (%)
Working at home (%)
Industry diversity
Most Common Industries - Agriculture, forestry, fishing and hunting, and mining (%)
Most Common Industries - Agriculture, forestry, fishing and hunting (%)
Most Common Industries - Mining, quarrying, and oil and gas extraction (%)
Most Common Industries - Construction (%)
Most Common Industries - Manufacturing (%)
Most Common Industries - Wholesale trade (%)
Most Common Industries - Retail trade (%)
Most Common Industries - Transportation and warehousing, and utilities (%)
Most Common Industries - Transportation and warehousing (%)
Most Common Industries - Utilities (%)
Most Common Industries - Information (%)
Most Common Industries - Finance and insurance, and real estate and rental and leasing (%)
Most Common Industries - Finance and insurance (%)
Most Common Industries - Real estate and rental and leasing (%)
Most Common Industries - Professional, scientific, and management, and administrative and waste management services (%)
Most Common Industries - Professional, scientific, and technical services (%)
Most Common Industries - Management of companies and enterprises (%)
Most Common Industries - Administrative and support and waste management services (%)
Most Common Industries - Educational services, and health care and social assistance (%)
Most Common Industries - Educational services (%)
Most Common Industries - Health care and social assistance (%)
Most Common Industries - Arts, entertainment, and recreation, and accommodation and food services (%)
Most Common Industries - Arts, entertainment, and recreation (%)
Most Common Industries - Accommodation and food services (%)
Most Common Industries - Other services, except public administration (%)
Most Common Industries - Public administration (%)
Occupation diversity
Most Common Occupations - Management, business, science, and arts occupations (%)
Most Common Occupations - Management, business, and financial occupations (%)
Most Common Occupations - Management occupations (%)
Most Common Occupations - Business and financial operations occupations (%)
Most Common Occupations - Computer, engineering, and science occupations (%)
Most Common Occupations - Computer and mathematical occupations (%)
Most Common Occupations - Architecture and engineering occupations (%)
Most Common Occupations - Life, physical, and social science occupations (%)
Most Common Occupations - Education, legal, community service, arts, and media occupations (%)
Most Common Occupations - Community and social service occupations (%)
Most Common Occupations - Legal occupations (%)
Most Common Occupations - Education, training, and library occupations (%)
Most Common Occupations - Arts, design, entertainment, sports, and media occupations (%)
Most Common Occupations - Healthcare practitioners and technical occupations (%)
Most Common Occupations - Health diagnosing and treating practitioners and other technical occupations (%)
Most Common Occupations - Health technologists and technicians (%)
Most Common Occupations - Service occupations (%)
Most Common Occupations - Healthcare support occupations (%)
Most Common Occupations - Protective service occupations (%)
Most Common Occupations - Fire fighting and prevention, and other protective service workers including supervisors (%)
Most Common Occupations - Law enforcement workers including supervisors (%)
Most Common Occupations - Food preparation and serving related occupations (%)
Most Common Occupations - Building and grounds cleaning and maintenance occupations (%)
Most Common Occupations - Personal care and service occupations (%)
Most Common Occupations - Sales and office occupations (%)
Most Common Occupations - Sales and related occupations (%)
Most Common Occupations - Office and administrative support occupations (%)
Most Common Occupations - Natural resources, construction, and maintenance occupations (%)
Most Common Occupations - Farming, fishing, and forestry occupations (%)
Most Common Occupations - Construction and extraction occupations (%)
Most Common Occupations - Installation, maintenance, and repair occupations (%)
Most Common Occupations - Production, transportation, and material moving occupations (%)
Most Common Occupations - Production occupations (%)
Most Common Occupations - Transportation occupations (%)
Most Common Occupations - Material moving occupations (%)
People in Group quarters - Institutionalized population (%)
People in Group quarters - Correctional institutions (%)
People in Group quarters - Federal prisons and detention centers (%)
People in Group quarters - Halfway houses (%)
People in Group quarters - Local jails and other confinement facilities (including police lockups) (%)
People in Group quarters - Military disciplinary barracks (%)
People in Group quarters - State prisons (%)
People in Group quarters - Other types of correctional institutions (%)
People in Group quarters - Nursing homes (%)
People in Group quarters - Hospitals/wards, hospices, and schools for the handicapped (%)
People in Group quarters - Hospitals/wards and hospices for chronically ill (%)
People in Group quarters - Hospices or homes for chronically ill (%)
People in Group quarters - Military hospitals or wards for chronically ill (%)
People in Group quarters - Other hospitals or wards for chronically ill (%)
People in Group quarters - Hospitals or wards for drug/alcohol abuse (%)
People in Group quarters - Mental (Psychiatric) hospitals or wards (%)
People in Group quarters - Schools, hospitals, or wards for the mentally retarded (%)
People in Group quarters - Schools, hospitals, or wards for the physically handicapped (%)
People in Group quarters - Institutions for the deaf (%)
People in Group quarters - Institutions for the blind (%)
People in Group quarters - Orthopedic wards and institutions for the physically handicapped (%)
People in Group quarters - Wards in general hospitals for patients who have no usual home elsewhere (%)
People in Group quarters - Wards in military hospitals for patients who have no usual home elsewhere (%)
People in Group quarters - Juvenile institutions (%)
People in Group quarters - Long-term care (%)
People in Group quarters - Homes for abused, dependent, and neglected children (%)
People in Group quarters - Residential treatment centers for emotionally disturbed children (%)
People in Group quarters - Training schools for juvenile delinquents (%)
People in Group quarters - Short-term care, detention or diagnostic centers for delinquent children (%)
People in Group quarters - Type of juvenile institution unknown (%)
People in Group quarters - Noninstitutionalized population (%)
People in Group quarters - College dormitories (includes college quarters off campus) (%)
People in Group quarters - Military quarters (%)
People in Group quarters - On base (%)
People in Group quarters - Barracks, unaccompanied personnel housing (UPH), (Enlisted/Officer), ;and similar group living quarters for military personnel (%)
People in Group quarters - Transient quarters for temporary residents (%)
People in Group quarters - Military ships (%)
People in Group quarters - Group homes (%)
People in Group quarters - Homes or halfway houses for drug/alcohol abuse (%)
People in Group quarters - Homes for the mentally ill (%)
People in Group quarters - Homes for the mentally retarded (%)
People in Group quarters - Homes for the physically handicapped (%)
People in Group quarters - Other group homes (%)
People in Group quarters - Religious group quarters (%)
People in Group quarters - Dormitories (%)
People in Group quarters - Agriculture workers' dormitories on farms (%)
People in Group quarters - Job Corps and vocational training facilities (%)
People in Group quarters - Other workers' dormitories (%)
People in Group quarters - Crews of maritime vessels (%)
People in Group quarters - Other nonhousehold living situations (%)
People in Group quarters - Other noninstitutional group quarters (%)
Residents speaking English at home (%)
Residents speaking English at home - Born in the United States (%)
Residents speaking English at home - Native, born elsewhere (%)
Residents speaking English at home - Foreign born (%)
Residents speaking Spanish at home (%)
Residents speaking Spanish at home - Born in the United States (%)
Residents speaking Spanish at home - Native, born elsewhere (%)
Residents speaking Spanish at home - Foreign born (%)
Residents speaking other language at home (%)
Residents speaking other language at home - Born in the United States (%)
Residents speaking other language at home - Native, born elsewhere (%)
Residents speaking other language at home - Foreign born (%)
Class of Workers - Employee of private company (%)
Class of Workers - Self-employed in own incorporated business (%)
Class of Workers - Private not-for-profit wage and salary workers (%)
Class of Workers - Local government workers (%)
Class of Workers - State government workers (%)
Class of Workers - Federal government workers (%)
Class of Workers - Self-employed workers in own not incorporated business and Unpaid family workers (%)
House heating fuel used in houses and condos - Utility gas (%)
House heating fuel used in houses and condos - Bottled, tank, or LP gas (%)
House heating fuel used in houses and condos - Electricity (%)
House heating fuel used in houses and condos - Fuel oil, kerosene, etc. (%)
House heating fuel used in houses and condos - Coal or coke (%)
House heating fuel used in houses and condos - Wood (%)
House heating fuel used in houses and condos - Solar energy (%)
House heating fuel used in houses and condos - Other fuel (%)
House heating fuel used in houses and condos - No fuel used (%)
House heating fuel used in apartments - Utility gas (%)
House heating fuel used in apartments - Bottled, tank, or LP gas (%)
House heating fuel used in apartments - Electricity (%)
House heating fuel used in apartments - Fuel oil, kerosene, etc. (%)
House heating fuel used in apartments - Coal or coke (%)
House heating fuel used in apartments - Wood (%)
House heating fuel used in apartments - Solar energy (%)
House heating fuel used in apartments - Other fuel (%)
House heating fuel used in apartments - No fuel used (%)
Armed forces status - In Armed Forces (%)
Armed forces status - Civilian (%)
Armed forces status - Civilian - Veteran (%)
Armed forces status - Civilian - Nonveteran (%)
Fatal accidents locations in years 2005-2021
Fatal accidents locations in 2005
Fatal accidents locations in 2006
Fatal accidents locations in 2007
Fatal accidents locations in 2008
Fatal accidents locations in 2009
Fatal accidents locations in 2010
Fatal accidents locations in 2011
Fatal accidents locations in 2012
Fatal accidents locations in 2013
Fatal accidents locations in 2014
Fatal accidents locations in 2015
Fatal accidents locations in 2016
Fatal accidents locations in 2017
Fatal accidents locations in 2018
Fatal accidents locations in 2019
Fatal accidents locations in 2020
Fatal accidents locations in 2021
Alcohol use - People drinking some alcohol every month (%)
Alcohol use - People not drinking at all (%)
Alcohol use - Average days/month drinking alcohol
Alcohol use - Average drinks/week
Alcohol use - Average days/year people drink much
Audiometry - Average condition of hearing (%)
Audiometry - People that can hear a whisper from across a quiet room (%)
Audiometry - People that can hear normal voice from across a quiet room (%)
Audiometry - Ears ringing, roaring, buzzing (%)
Audiometry - Had a job exposure to loud noise (%)
Audiometry - Had off-work exposure to loud noise (%)
Blood Pressure & Cholesterol - Has high blood pressure (%)
Blood Pressure & Cholesterol - Checking blood pressure at home (%)
Blood Pressure & Cholesterol - Frequently checking blood cholesterol (%)
Blood Pressure & Cholesterol - Has high cholesterol level (%)
Consumer Behavior - Money monthly spent on food at supermarket/grocery store
Consumer Behavior - Money monthly spent on food at other stores
Consumer Behavior - Money monthly spent on eating out
Consumer Behavior - Money monthly spent on carryout/delivered foods
Consumer Behavior - Income spent on food at supermarket/grocery store (%)
Consumer Behavior - Income spent on food at other stores (%)
Consumer Behavior - Income spent on eating out (%)
Consumer Behavior - Income spent on carryout/delivered foods (%)
Current Health Status - General health condition (%)
Current Health Status - Blood donors (%)
Current Health Status - Has blood ever tested for HIV virus (%)
Current Health Status - Left-handed people (%)
Dermatology - People using sunscreen (%)
Diabetes - Diabetics (%)
Diabetes - Had a blood test for high blood sugar (%)
Diabetes - People taking insulin (%)
Diet Behavior & Nutrition - Diet health (%)
Diet Behavior & Nutrition - Milk product consumption (# of products/month)
Diet Behavior & Nutrition - Meals not home prepared (#/week)
Diet Behavior & Nutrition - Meals from fast food or pizza place (#/week)
Diet Behavior & Nutrition - Ready-to-eat foods (#/month)
Diet Behavior & Nutrition - Frozen meals/pizza (#/month)
Drug Use - People that ever used marijuana or hashish (%)
Drug Use - Ever used hard drugs (%)
Drug Use - Ever used any form of cocaine (%)
Drug Use - Ever used heroin (%)
Drug Use - Ever used methamphetamine (%)
Health Insurance - People covered by health insurance (%)
Kidney Conditions-Urology - Avg. # of times urinating at night
Medical Conditions - People with asthma (%)
Medical Conditions - People with anemia (%)
Medical Conditions - People with psoriasis (%)
Medical Conditions - People with overweight (%)
Medical Conditions - Elderly people having difficulties in thinking or remembering (%)
Medical Conditions - People who ever received blood transfusion (%)
Medical Conditions - People having trouble seeing even with glass/contacts (%)
Medical Conditions - People with arthritis (%)
Medical Conditions - People with gout (%)
Medical Conditions - People with congestive heart failure (%)
Medical Conditions - People with coronary heart disease (%)
Medical Conditions - People with angina pectoris (%)
Medical Conditions - People who ever had heart attack (%)
Medical Conditions - People who ever had stroke (%)
Medical Conditions - People with emphysema (%)
Medical Conditions - People with thyroid problem (%)
Medical Conditions - People with chronic bronchitis (%)
Medical Conditions - People with any liver condition (%)
Medical Conditions - People who ever had cancer or malignancy (%)
Mental Health - People who have little interest in doing things (%)
Mental Health - People feeling down, depressed, or hopeless (%)
Mental Health - People who have trouble sleeping or sleeping too much (%)
Mental Health - People feeling tired or having little energy (%)
Mental Health - People with poor appetite or overeating (%)
Mental Health - People feeling bad about themself (%)
Mental Health - People who have trouble concentrating on things (%)
Mental Health - People moving or speaking slowly or too fast (%)
Mental Health - People having thoughts they would be better off dead (%)
Oral Health - Average years since last visit a dentist
Oral Health - People embarrassed because of mouth (%)
Oral Health - People with gum disease (%)
Oral Health - General health of teeth and gums (%)
Oral Health - Average days a week using dental floss/device
Oral Health - Average days a week using mouthwash for dental problem
Oral Health - Average number of teeth
Pesticide Use - Households using pesticides to control insects (%)
Pesticide Use - Households using pesticides to kill weeds (%)
Physical Activity - People doing vigorous-intensity work activities (%)
Physical Activity - People doing moderate-intensity work activities (%)
Physical Activity - People walking or bicycling (%)
Physical Activity - People doing vigorous-intensity recreational activities (%)
Physical Activity - People doing moderate-intensity recreational activities (%)
Physical Activity - Average hours a day doing sedentary activities
Physical Activity - Average hours a day watching TV or videos
Physical Activity - Average hours a day using computer
Physical Functioning - People having limitations keeping them from working (%)
Physical Functioning - People limited in amount of work they can do (%)
Physical Functioning - People that need special equipment to walk (%)
Physical Functioning - People experiencing confusion/memory problems (%)
Physical Functioning - People requiring special healthcare equipment (%)
Prescription Medications - Average number of prescription medicines taking
Preventive Aspirin Use - Adults 40+ taking low-dose aspirin (%)
Reproductive Health - Vaginal deliveries (%)
Reproductive Health - Cesarean deliveries (%)
Reproductive Health - Deliveries resulted in a live birth (%)
Reproductive Health - Pregnancies resulted in a delivery (%)
Reproductive Health - Women breastfeeding newborns (%)
Reproductive Health - Women that had a hysterectomy (%)
Reproductive Health - Women that had both ovaries removed (%)
Reproductive Health - Women that have ever taken birth control pills (%)
Reproductive Health - Women taking birth control pills (%)
Reproductive Health - Women that have ever used Depo-Provera or injectables (%)
Reproductive Health - Women that have ever used female hormones (%)
Sexual Behavior - People 18+ that ever had sex (vaginal, anal, or oral) (%)
Sexual Behavior - Males 18+ that ever had vaginal sex with a woman (%)
Sexual Behavior - Males 18+ that ever performed oral sex on a woman (%)
Sexual Behavior - Males 18+ that ever had anal sex with a woman (%)
Sexual Behavior - Males 18+ that ever had any sex with a man (%)
Sexual Behavior - Females 18+ that ever had vaginal sex with a man (%)
Sexual Behavior - Females 18+ that ever performed oral sex on a man (%)
Sexual Behavior - Females 18+ that ever had anal sex with a man (%)
Sexual Behavior - Females 18+ that ever had any kind of sex with a woman (%)
Sexual Behavior - Average age people first had sex
Sexual Behavior - Average number of female sex partners in lifetime (males 18+)
Sexual Behavior - Average number of female vaginal sex partners in lifetime (males 18+)
Sexual Behavior - Average age people first performed oral sex on a woman (18+)
Sexual Behavior - Average number of woman performed oral sex on in lifetime (18+)
Sexual Behavior - Average number of male sex partners in lifetime (males 18+)
Sexual Behavior - Average number of male anal sex partners in lifetime (males 18+)
Sexual Behavior - Average age people first performed oral sex on a man (18+)
Sexual Behavior - Average number of male oral sex partners in lifetime (18+)
Sexual Behavior - People using protection when performing oral sex (%)
Sexual Behavior - Average number of times people have vaginal or anal sex a year
Sexual Behavior - People having sex without condom (%)
Sexual Behavior - Average number of male sex partners in lifetime (females 18+)
Sexual Behavior - Average number of male vaginal sex partners in lifetime (females 18+)
Sexual Behavior - Average number of female sex partners in lifetime (females 18+)
Sexual Behavior - Circumcised males 18+ (%)
Sleep Disorders - Average hours sleeping at night
Sleep Disorders - People that has trouble sleeping (%)
Smoking-Cigarette Use - People smoking cigarettes (%)
Taste & Smell - People 40+ having problems with smell (%)
Taste & Smell - People 40+ having problems with taste (%)
Taste & Smell - People 40+ that ever had wisdom teeth removed (%)
Taste & Smell - People 40+ that ever had tonsils teeth removed (%)
Taste & Smell - People 40+ that ever had a loss of consciousness because of a head injury (%)
Taste & Smell - People 40+ that ever had a broken nose or other serious injury to face or skull (%)
Taste & Smell - People 40+ that ever had two or more sinus infections (%)
Weight - Average height (inches)
Weight - Average weight (pounds)
Weight - Average BMI
Weight - People that are obese (%)
Weight - People that ever were obese (%)
Weight - People trying to lose weight (%)
100%
urban population.
Estimated median house/condo value in 2022: $53,338
48205:
$53,338Michigan:
$224,400
Median resident age: This zip code:
31.2 yearsMichigan median age:
40.3 years
Average household size: This zip code:
2.5 peopleMichigan:
2.4 people
Averages for the 2020 tax year for zip code 48205, filed in 2021:
Average Adjusted Gross Income (AGI) in 2020: $27,196 (Individual Income Tax Returns) Here:
$27,196State:
$68,945
Salary/wage: $23,886 (reported on 77.8% of returns )Here:
$23,886State:
$57,142
(% of AGI for various income ranges: 942.7% for AGIs below $25k , 2833.2% for AGIs $25k-50k , 7268.2% for AGIs $50k-75k , 9891.1% for AGIs $75k-100k , 20574.0% for AGIs $100k-200k ) Taxable interest for individuals: $367 (reported on 7.3% of returns )This zip code:
$367Michigan:
$1,630
(% of AGI for various income ranges: 1.4% for AGIs below $25k , 0.8% for AGIs $25k-50k , 26.6% for AGIs $50k-75k , 13.9% for AGIs $75k-100k , 49.0% for AGIs $100k-200k ) Ordinary dividends: $758 (reported on 1.8% of returns )(% of AGI for various income ranges: 0.3% for AGIs below $25k , 0.5% for AGIs $25k-50k , 4.7% for AGIs $50k-75k , 27.8% for AGIs $75k-100k , 68.0% for AGIs $100k-200k ) Net capital gain/loss in AGI: +$1,565 (reported on 1.3% of returns )Here:
+$1,565State:
+$20,064
(% of AGI for various income ranges: 0.5% for AGIs $25k-50k , 10.6% for AGIs $50k-75k , 192.0% for AGIs $100k-200k ) Taxable individual retirement arrangement distribution: $9,921 (reported on 1.8% of returns )48205:
$9,921Michigan:
$19,803
(% of AGI for various income ranges: 5.9% for AGIs below $25k , 14.7% for AGIs $25k-50k , 75.5% for AGIs $50k-75k , 285.6% for AGIs $75k-100k , 479.0% for AGIs $100k-200k ) Total itemized deductions: $22,550 (reported on 2.1% of returns )Here:
$22,550State:
$34,117
(% of AGI for various income ranges: 6.3% for AGIs below $25k , 61.4% for AGIs $25k-50k , 259.5% for AGIs $50k-75k , 467.8% for AGIs $75k-100k , 1144.0% for AGIs $100k-200k ) Charity contributions: $9,200 (reported on 1.8% of returns )(% of AGI for various income ranges: 2.1% for AGIs below $25k , 17.8% for AGIs $25k-50k , 73.5% for AGIs $50k-75k , 198.9% for AGIs $75k-100k , 588.0% for AGIs $100k-200k ) Taxes paid: $5,536 (reported on 2.1% of returns )(% of AGI for various income ranges: 1.1% for AGIs below $25k , 11.5% for AGIs $25k-50k , 65.8% for AGIs $50k-75k , 151.1% for AGIs $75k-100k , 367.0% for AGIs $100k-200k ) Earned income credit: $2,986 (reported on 46.3% of returns )(% of AGI for various income ranges: 200.8% for AGIs below $25k , 164.3% for AGIs $25k-50k ) Percentage of individuals using paid preparers for their 2020 taxes: 92.1%(% for various income ranges: 93.1% for AGIs below $25k , 92.7% for AGIs $25k-50k , 86.6% for AGIs $50k-75k , 86.2% for AGIs $75k-100k , 81.8% for AGIs $100k-200k )
Averages for the 2012 tax year for zip code 48205, filed in 2013:
Average Adjusted Gross Income (AGI) in 2012: $22,720 (Individual Income Tax Returns) Here:
$22,720State:
$55,609
Salary/wage: $21,466 (reported on 78.1% of returns )Here:
$21,466State:
$46,782
(% of AGI for various income ranges: 65.6% for AGIs below $25k , 80.1% for AGIs $25k-50k , 78.2% for AGIs $50k-75k , 79.8% for AGIs $75k-100k , 75.5% for AGIs $100k-200k ) Taxable interest for individuals: $1,298 (reported on 8.7% of returns )This zip code:
$1,298Michigan:
$1,491
(% of AGI for various income ranges: 0.8% for AGIs below $25k , 0.4% for AGIs $25k-50k , 0.2% for AGIs $50k-75k , 0.2% for AGIs $100k-200k ) Ordinary dividends: $1,106 (reported on 2.3% of returns )(% of AGI for various income ranges: 0.1% for AGIs below $25k , 0.2% for AGIs $50k-75k , 0.1% for AGIs $100k-200k ) Net capital gain/loss in AGI: +$356 (reported on 1.2% of returns )(% of AGI for various income ranges: 0.4% for AGIs $100k-200k ) Profit/loss from business: +$7,270 (reported on 27.0% of returns )Here:
+$7,270State:
+$11,523
(% of AGI for various income ranges: 22.7% for AGIs below $25k ) Taxable individual retirement arrangement distribution: $10,706 (reported on 2.4% of returns )48205:
$10,706Michigan:
$15,298
(% of AGI for various income ranges: 0.4% for AGIs below $25k , 1.0% for AGIs $25k-50k , 1.7% for AGIs $50k-75k , 2.3% for AGIs $75k-100k , 3.2% for AGIs $100k-200k ) Total itemized deductions: $14,876 (28% of AGI, reported on 12.6% of returns )Here:
$14,876State:
$21,628
Here:
27.9% of AGIState:
18.4% of AGI
(% of AGI for various income ranges: 2.8% for AGIs below $25k , 9.6% for AGIs $25k-50k , 13.5% for AGIs $50k-75k , 13.6% for AGIs $75k-100k , 14.4% for AGIs $100k-200k ) Charity contributions: $4,231 (reported on 10.7% of returns )(% of AGI for various income ranges: 0.5% for AGIs below $25k , 2.2% for AGIs $25k-50k , 3.6% for AGIs $50k-75k , 3.9% for AGIs $75k-100k , 3.5% for AGIs $100k-200k ) Taxes paid: $5,200 (reported on 12.6% of returns )(% of AGI for various income ranges: 0.8% for AGIs below $25k , 2.9% for AGIs $25k-50k , 5.0% for AGIs $50k-75k , 5.6% for AGIs $75k-100k , 6.5% for AGIs $100k-200k ) Earned income credit: $3,184 (reported on 53.1% of returns )(% of AGI for various income ranges: 17.7% for AGIs below $25k , 2.0% for AGIs $25k-50k ) Percentage of individuals using paid preparers for their 2012 taxes: 55.5%(% for various income ranges: 55.4% for AGIs below $25k , 53.7% for AGIs $25k-50k , 60.7% for AGIs $50k-75k , 60.0% for AGIs $75k-100k , 57.9% for AGIs $100k-200k )
Averages for the 2004 tax year for zip code 48205, filed in 2005:
Average Adjusted Gross Income (AGI) in 2004: $26,719 (Individual Income Tax Returns) Here:
$26,719State:
$48,204
Salary/wage: $26,115 (reported on 89.8% of returns )Here:
$26,115State:
$42,791
(% of AGI for various income ranges: 75.2% for AGIs below $10k , 82.5% for AGIs $10k-25k , 89.8% for AGIs $25k-50k , 91.1% for AGIs $50k-75k , 91.9% for AGIs $75k-100k , 86.5% for AGIs over 100k ) Taxable interest for individuals: $731 (reported on 14.7% of returns )This zip code:
$731Michigan:
$1,725
(% of AGI for various income ranges: 0.8% for AGIs below $10k , 0.4% for AGIs $10k-25k , 0.3% for AGIs $25k-50k , 0.4% for AGIs $50k-75k , 0.4% for AGIs $75k-100k , 0.3% for AGIs over 100k ) Taxable dividends: $821 (reported on 4.4% of returns )(% of AGI for various income ranges: 0.3% for AGIs below $10k , 0.1% for AGIs $10k-25k , 0.1% for AGIs $25k-50k , 0.2% for AGIs $50k-75k , 0.1% for AGIs $75k-100k , 0.1% for AGIs over 100k ) Net capital gain/loss: +$2,249 (reported on 2.2% of returns )Here:
+$2,249State:
+$8,532
(% of AGI for various income ranges: -0.1% for AGIs below $10k , 0.0% for AGIs $10k-25k , 0.1% for AGIs $25k-50k , 0.1% for AGIs $50k-75k , 0.1% for AGIs $75k-100k , 1.8% for AGIs over 100k ) Profit/loss from business: +$4,886 (reported on 12.5% of returns )Here:
+$4,886State:
+$9,547
(% of AGI for various income ranges: 16.7% for AGIs below $10k , 6.7% for AGIs $10k-25k , -0.1% for AGIs $25k-50k , 0.3% for AGIs $50k-75k , 0.2% for AGIs $75k-100k , -0.1% for AGIs over 100k ) IRA payment deduction: $1,624 (reported on 0.6% of returns )48205:
$1,624Michigan:
$2,875
(% of AGI for various income ranges: 0.1% for AGIs below $10k , 0.0% for AGIs $10k-25k , 0.0% for AGIs $25k-50k , 0.0% for AGIs $50k-75k ) Total itemized deductions: $13,977 (28% of AGI, reported on 28.2% of returns )Here:
$13,977State:
$18,509
Here:
28.4% of AGIState:
20.7% of AGI
(% of AGI for various income ranges: 4.9% for AGIs below $10k , 7.5% for AGIs $10k-25k , 16.3% for AGIs $25k-50k , 19.3% for AGIs $50k-75k , 17.9% for AGIs $75k-100k , 17.0% for AGIs over 100k ) Charity contributions deductions: $3,432 (7% of AGI, reported on 25.0% of returns )Here:
6.7% of AGIState:
3.6% of AGI
(% of AGI for various income ranges: 0.4% for AGIs below $10k , 1.2% for AGIs $10k-25k , 3.5% for AGIs $25k-50k , 4.5% for AGIs $50k-75k , 4.2% for AGIs $75k-100k , 4.5% for AGIs over 100k ) Total tax: $3,065 (reported on 53.8% of returns )(% of AGI for various income ranges: 2.8% for AGIs below $10k , 2.5% for AGIs $10k-25k , 4.6% for AGIs $25k-50k , 8.4% for AGIs $50k-75k , 10.4% for AGIs $75k-100k , 13.5% for AGIs over 100k ) Earned income credit: $2,274 (reported on 47.2% of returns )Percentage of individuals using paid preparers for their 2004 taxes: 68.2%(% for various income ranges: 67.0% for AGIs below $10k , 73.3% for AGIs $10k-25k , 64.2% for AGIs $25k-50k , 65.3% for AGIs $50k-75k , 67.4% for AGIs $75k-100k , 63.0% for AGIs over 100k )
Estimated median household income in 2022: This zip code:
$41,725Michigan:
$66,986
Nearest zip codes: 48089 ,
48213 ,
48224 ,
48021 ,
48225 ,
48234 .
Detroit Zip Code Map
Percentage of family households: This zip code:
38.5%Michigan:
43.3%
Percentage of households with unmarried partners: This zip code:
27.7%Michigan:
45.7%
Likely homosexual households (counted as self-reported same-sex unmarried-partner households)
Lesbian couples: 0.1% of all households Gay men: 0.1% of all households
Household received Food Stamps/SNAP in the past 12 months: 5,527Household did not receive Food Stamps/SNAP in the past 12 months: 7,420
Women who had a birth in the past 12 months: 245 (0 now married , 233 unmarried) Women who did not have a birth in the past 12 months: 9,130 (1,037 now married , 8,151 unmarried)
Housing units in zip code 48205 with a mortgage: 1,286 (116
second mortgage , 80
both second mortgage and home equity loan )
Houses without a mortgage: 25
Median monthly owner costs for units with a mortgage: $934
Median monthly owner costs for units without a mortgage: $487
Residents with income below the poverty level in 2022:
This zip code:
26.9%Whole state:
13.4%
Residents with income below 50% of the poverty level in 2022:
This zip code:
14.1%Whole state:
6.9%
Median number of rooms in houses and condos: Median number of rooms in apartments: Notable locations in this zip code not listed on our city pages
Click to draw/clear zip code borders Notable locations in zip code 48205: (A) , Saint John Gratiot Center (B) , City of Detroit Fire Department Engine 50 Ladder 23 (C) , Benjamin Franklin Library (D) , DetroitNortheast City Hall (E) . Display/hide their locations on the map
Shopping Center: (1) . Display/hide its location on the map
Churches in zip code 48205 include: (A) , Open Door Church of God in Christ of Detroit (B) , Order of the Cannons Regular of the Holy Cross (C) , Redemption Lutheran Church (D) , Iconium Missionary Baptist Church (E) , King's Highway Missionary Baptist Church (F) , Lockett Memorial Church of God in Christ (G) , Zion Hill Baptist Church of East Detroit (H) , Miracle Tabernacle Church of God in Christ (I) . Display/hide their locations on the map
Cemetery: (1) . Display/hide its location on the map
Parks in zip code 48205 include: (1) , Assumption Roman Catholic Church Historical Marker (2) , Assumption Grotto Church Complex Historical Marker (3) , Wish Egan Playfield (4) , Heilmann Memorial Playground (5) , O'Brien Playground (6) . Display/hide their locations on the map
Year house built (houses)
0 2020 or later50 2010 to 2019174 2000 to 2009110 1990 to 1999261 1980 to 1989413 1970 to 19791,836 1960 to 19695,383 1950 to 19595,595 1940 to 19493,019 1939 or earlier
Zip code 48205 household income distribution in 2022 1,105 Less than $10,000734 $10,000 to $14,999590 $15,000 to $19,999785 $20,000 to $24,999845 $25,000 to $29,9991,041 $30,000 to $34,999830 $35,000 to $39,9991,047 $40,000 to $44,999748 $45,000 to $49,9991,006 $50,000 to $59,9991,615 $60,000 to $74,9991,356 $75,000 to $99,999541 $100,000 to $124,999150 $125,000 to $149,999209 $150,000 to $199,999157 $200,000 or moreEstimate of home value of owner-occupied houses/condos in 2022 in zip code 48205 276 Less than $10,000271 $10,000 to $14,999144 $15,000 to $19,999198 $20,000 to $24,999335 $25,000 to $29,999256 $30,000 to $34,999109 $35,000 to $39,999586 $40,000 to $49,999395 $50,000 to $59,999266 $60,000 to $69,999170 $70,000 to $79,999308 $80,000 to $89,999206 $90,000 to $99,999111 $100,000 to $124,99984 $125,000 to $149,999133 $150,000 to $174,99960 $200,000 to $249,9998 $250,000 to $299,99925 $300,000 to $399,99927 $400,000 to $499,999140 $500,000 to $749,9997 $2,000,000 or moreRent paid by renters in 2022 in zip code 48205 11 $150 to $1994 $250 to $29919 $300 to $34921 $350 to $39972 $400 to $44943 $450 to $499468 $500 to $549719 $550 to $599641 $600 to $6491,124 $650 to $6991,292 $700 to $749822 $750 to $7991,054 $800 to $899483 $900 to $999348 $1,000 to $1,24972 $1,250 to $1,4992 $2,500 to $2,999308 No cash rent
Median gross rent in 2022: $1,139.
Estimated median house (or condo) value in 2022 for: White Non-Hispanic householders: $48,372Black or African American householders: $54,108American Indian or Alaska Native householders: $115,751Asian householders: $52,225Some other race householders: $52,054Two or more races householders: $65,923Hispanic or Latino householders: $41,009Estimated median house or condo value in 2022: $53,338
48205:
$53,338Michigan:
$224,400
Lower value quartile - upper value quartile: $29,964 - $91,258
Mean price in 2022: Detached houses: $86,033Here:
$86,033State:
$280,038
Townhouses or other attached units: $49,178Here:
$49,178State:
$239,520
In 2-unit structures: $64,443Here:
$64,443State:
$219,481
Mobile homes: $67,824Here:
$67,824State:
$72,868
Housing units in structures:
One, detached: 15,463One, attached: 506Two: 2373 or 4: 615 to 9: 12310 to 19: 43120 to 49: 22950 or more: 55Mobile homes: 104Unemployment : 13.4%
Means of transportation to work in zip code 48205 72.1% 9,791 Drove a car alone13.7% 1,856 Carpooled3.8% 517 Bus or trolley bus0.0% 6 Taxi0.2% 23 Bicycle1.1% 144 Walked2.3% 316 Other means3.4% 459 Worked at homeTravel time to work (commute) in zip code 48205 155 Less than 5 minutes325 5 to 9 minutes2,117 10 to 14 minutes2,364 15 to 19 minutes3,559 20 to 24 minutes1,273 25 to 29 minutes1,426 30 to 34 minutes230 35 to 39 minutes329 40 to 44 minutes413 45 to 59 minutes464 60 to 89 minutes66 90 or more minutes
Neighborhoods in zip code 48205: Percentage of zip code residents living and working in this county: 58.1%
Household type by relationship:
Households: 31,740
Male householders: 5,252 (2,833 living alone ), Female householders: 7,435 (1,932 living alone )1,676 spouses (1,663 opposite-sex spouses ), 2,303 unmarried partners , (2,279 opposite-sex unmarried partners ), 9,810 children (9,282 natural , 77 adopted , 457 stepchildren ), 1,549 grandchildren , 731 brothers or sisters , 296 parents , 0 foster children , 1,223 other relatives , 1,219 non-relatives In group quarters: 243 (-1 institutionalized population )
Size of family households: 2,379 2-persons , 2,019 3-persons , 1,078 4-persons , 482 5-persons , 313 6-persons , 132 7-or-more-persons
Size of nonfamily households: 4,758 1-person , 1,199 2-persons , 228 3-persons , 89 4-persons
772 married couples with children. single-parent households (784 men , 4,110 women ).
97.7% of residents of 48205 zip code speak English at home. of residents speak Spanish at home (74% very well, 12% well, 14% not well ).of residents speak Asian or Pacific Island language at home (49% very well, 45% well, 6% not well ).of residents speak other language at home (89% very well, 11% not well ).
Foreign born population: 230 (0.7%)
(68.8%
of them are naturalized citizens )
This zip code:
0.7%Whole state:
6.9%
17% Indonesia 14% Liberia 11% Honduras 10% St. Vincent and the Grenadines 8% Malaysia 5% Haiti 4% Czechoslovakia (includes Czech Republic and Slovakia) 2% American 1% African 1% Moroccan 0% English 0% Polish 0% Italian 0% Nigerian
Year of entry for the foreign-born population
47 2010 or later 33 2000 to 2009 42 1990 to 1999 96 Before 1990
There are
66 Medical Specialists in Zip Code 48205 .
Major facilities with environmental interests located in this zip code:
FLEMING ELEMENTARY SCHOOL (18501 WALTHAM STREET in DETROIT, MI)
(National Center for Education Statistics) - STATE ID-01248 Conditionally Exempt Small Quantity Generators, less than 100 kg/month of hazardous waste (Resource Conservation and Recovery Act (tracking hazardous waste)) Organizations: DETROIT PUBLIC SCHOOLS (CONTACT/OPERATOR)
, DETROIT CITY SCHOOL DISTRICT (SCHOOL DISTRICT)
Alternative names: FLEMING ELEM SCHOOL
DETROIT PUBLIC SCHOOLS (18025 BROCK in DETROIT, MI)
(National Center for Education Statistics) - STATE ID-06095 Conditionally Exempt Small Quantity Generators, less than 100 kg/month of hazardous waste (Resource Conservation and Recovery Act (tracking hazardous waste)) Organizations: DETROIT CITY SCHOOL DISTRICT (SCHOOL DISTRICT)
Alternative names: COLUMBUS MIDDLE SCHOOL
3M DETROIT (11900 E. 8 MILE RD. in DETROIT, MI)
AIR SYNTHETIC MINOR (AIRS/AFS) CRITERIA AND HAZARDOUS AIR POLLUTANT INVENTORY (Inventory of air pollution sources) HAZARDOUS WASTE BIENNIAL REPORTER (Resource Conservation and Recovery Act (tracking hazardous waste)) Large Quantity Generators, more that 1000 kg of hazardous waste/month (Resource Conservation and Recovery Act (tracking hazardous waste)) TRI REPORTER (Tracking of toxic chemicals releasing facilities) Business SIC classification: ABRASIVE PRODUCTSOrganizations: 3M COMPANY (CONTACT/OPERATOR)
, MICHIGAN ABRASIVE COMPANY (CONTACT/OPERATOR)
Alternative names: 3M CO. DETROIT, 3M CO. DETROIT, 3M DETROIT-INDUSTRIAL ABRASIVES DIV, DETROIT ABRASIVES 3M
FINE & PERFORMING ARTS ACADEMY--EAST (17201 ANNOTT STREET in DETROIT, MI)
(National Center for Education Statistics) - STATE ID-07853 Organizations: DETROIT CITY SCHOOL DISTRICT (SCHOOL DISTRICT)
GENESIS (20045 JOANNE in DETROIT, MI)
(National Center for Education Statistics) - STATE ID-09126 Organizations: DETROIT CITY SCHOOL DISTRICT (SCHOOL DISTRICT)
ARCTIC MAINTENANCE INC (20000 HOOVER RD in DETROIT, MI)
(Resource Conservation and Recovery Act (tracking hazardous waste))
MEHDI GAS MART INC (13033 E 7 MILE RD in DETROIT, MI)
(Resource Conservation and Recovery Act (tracking hazardous waste)) Organizations: MAJED MASSAM (CONTACT/OWNER)
Alternative names: DRAGON FILL UP INC
GERRYS PAINT WORKS (14410 MAPLERIDGE in DETROIT, MI)
(Resource Conservation and Recovery Act (tracking hazardous waste)) Organizations: GRUBER GERALD (CONTACT/OWNER)
GOULBURN MERCURY (18660 GOULBURN ST. in DETROIT, MI)
SUPERFUND (Superfund database) (Resource Conservation and Recovery Act (tracking hazardous waste)) Alternative names: U.S. EPA (E) GOULBURN MERCURY SITE
DRUMMY OLDSMOBILE INC (13001 MCNICHOLS E in DETROIT, MI)
(Resource Conservation and Recovery Act (tracking hazardous waste)) Organizations: DRUMMY JOHN (CONTACT/OWNER)
EASTLAND COLLISION (12501 E MCNICHOLS in DETROIT, MI)
(Resource Conservation and Recovery Act (tracking hazardous waste)) Organizations: RUSSO ANTHONY (CONTACT/OWNER)
14534 TACOMA ST (14534 TACOMA ST in DETROIT, MI)
(Resource Conservation and Recovery Act (tracking hazardous waste))
15000 ASSOCIATES (15000 GRATIOT AVE in DETROIT, MI)
Conditionally Exempt Small Quantity Generators, less than 100 kg/month of hazardous waste (Resource Conservation and Recovery Act (tracking hazardous waste)) Business NAICS classification: OFFICES OF PHYSICIANS (EXCEPT MENTAL HEALTH SPECIALISTS).Organizations: LAURIE BARCLIFT (CONTACT/OPERATOR)
, CHUCK MADY (CONTACT/OWNER)
Alternative names: SARATOGA COMMUNITY HOSP
Housing units lacking complete plumbing facilities: 20.7%
Housing units lacking complete kitchen facilities: 22.1%
93.9% Utility gas 4.8% Electricity 0.7% Bottled, tank, or LP gas 0.5% No fuel used
Population in 1990: 65,127. Population change in the 1990s: +1,885 (+2.9%).
Place of birth for U.S.-born residents:
This state: 26,575Northeast: 316Midwest: 679South: 3,379West: 484
56% of the 48205 zip code residents lived in the same house 5 years ago.
Out of people who lived in different houses, 88% lived in this county.
Out of people who lived in different counties, 50% lived in Michigan.
90% of the 48205 zip code residents lived in the same house 1 year ago.
Out of people who lived in different houses, 67% moved from this county.
Out of people who lived in different houses, 23% moved from different county within same state.
Out of people who lived in different houses, 6% moved from different state.
Out of people who lived in different houses, 1% moved from abroad.
Private vs. public school enrollment:
Students in private schools in grades 1 to 8 (elementary and middle school): 167
Students in private schools in grades 9 to 12 (high school): 183
Students in private undergraduate colleges: 77
Occupation by median earnings in the past 12 months ($)
67,470 Law enforcement workers including supervisors 57,721 Computer and mathematical occupations 53,297 Business and financial operations occupations 49,057 Health diagnosing and treating practitioners and other technical occupations 47,948 Legal occupations 44,650 Installation, maintenance, and repair occupations
Companies with federal contracts located in this zip code:
DARNELL HARRIS (18645 WALTHAM ST in DETROIT, MI; small business)
$5,400 with Army for Chaplain Services. Signed on 2003-10-01. Completion date: 2004-09-30.
HARRIS, LISA (18645 WALTHAM in DETROIT, MI; small business)
$4,200 with Army for Services -- Basic Research (R&D). Signed on 2004-10-29. Completion date: 2004-10-01.
HARRIS, YONLONDA (18645 WALTHAM DR in DETROIT, MI; small business)
$2,600 with Army for Services -- Basic Research (R&D). Signed on 2004-10-29. Completion date: 2004-10-01.
Top industries in this zip code by the number of employees in 2005:
Accommodation and Food Services: Limited-Service Restaurants (50-99 employees: 1 establishment, 20-49 employees: 5 establishments, 10-19 employees: 7 establishments, 5-9 employees: 3 establishments, 1-4 employees: 7 establishments)Health Care and Social Assistance: Psychiatric and Substance Abuse Hospitals (100-249: 1)Health Care and Social Assistance: Nursing Care Facilities (100-249: 1)Other Services (except Public Administration): Religious Organizations (50-99: 1, 10-19: 2, 5-9: 4, 1-4: 8)Information: Wired Telecommunications Carriers (50-99: 1, 1-4: 1)
People in group quarters in 2010:
116 people in nursing facilities/skilled-nursing facilities
55 people in other noninstitutional facilities
36 people in residential treatment centers for adults
26 people in group homes for juveniles (non-correctional)
14 people in group homes intended for adults
4 people in in-patient hospice facilities
People in group quarters in 2000:
129 people in nursing homes
59 people in other noninstitutional group quarters
36 people in unknown juvenile institutions
21 people in homes or halfway houses for drug/alcohol abuse
4 people in homes for the mentally ill
4 people in religious group quarters
Fatal accident statistics in 2014:
Fatal accident count: 9Vehicles involved in fatal accidents: 14Fatal accidents caused by drunken drivers: 2Fatalities: 9Persons involved in fatal accidents: 18Pedestrians involved in fatal accidents: 5
Fatal accident statistics in 2013:
Fatal accident count: 9Vehicles involved in fatal accidents: 12Fatal accidents caused by drunken drivers: 1Fatalities: 9Persons involved in fatal accidents: 14Pedestrians involved in fatal accidents: 7
Home Mortgage Disclosure Act Aggregated Statistics For Year 2009(Based on 18 full and 12 partial tracts) A) FHA, FSA/RHS & VA B) Conventional C) Refinancings D) Home Improvement Loans F) Non-occupant Loans on G) Loans On Manufactured Number Average Value Number Average Value Number Average Value Number Average Value Number Average Value Number Average Value
LOANS ORIGINATED 35 $57,055 7 $57,976 71 $68,969 46 $16,691 11 $53,121 0 $0 APPLICATIONS APPROVED, NOT ACCEPTED 4 $36,905 2 $54,895 17 $55,123 9 $11,491 4 $30,405 0 $0 APPLICATIONS DENIED 24 $52,651 36 $41,041 201 $63,739 163 $16,681 62 $44,168 4 $49,195 APPLICATIONS WITHDRAWN 19 $55,428 4 $41,958 44 $72,148 3 $11,400 7 $61,337 0 $0 FILES CLOSED FOR INCOMPLETENESS 3 $74,840 3 $46,350 21 $76,728 6 $20,963 5 $52,248 0 $0
Aggregated Statistics For Year 2008(Based on 18 full and 12 partial tracts) A) FHA, FSA/RHS & VA B) Conventional C) Refinancings D) Home Improvement Loans E) Loans on Dwellings For 5+ Families F) Non-occupant Loans on G) Loans On Manufactured Number Average Value Number Average Value Number Average Value Number Average Value Number Average Value Number Average Value Number Average Value
LOANS ORIGINATED 59 $62,124 138 $60,372 300 $70,602 97 $18,245 1 $170,000 165 $58,284 0 $0 APPLICATIONS APPROVED, NOT ACCEPTED 12 $63,686 29 $74,903 76 $71,391 20 $54,250 0 $0 31 $59,154 1 $6,000 APPLICATIONS DENIED 69 $70,820 289 $69,569 769 $73,276 334 $22,470 1 $380,000 266 $57,546 10 $51,585 APPLICATIONS WITHDRAWN 23 $70,928 49 $69,155 182 $84,096 8 $52,926 0 $0 40 $62,109 0 $0 FILES CLOSED FOR INCOMPLETENESS 9 $71,572 36 $68,906 54 $70,519 19 $32,897 0 $0 25 $58,505 0 $0
Aggregated Statistics For Year 2007(Based on 18 full and 12 partial tracts) A) FHA, FSA/RHS & VA B) Conventional C) Refinancings D) Home Improvement Loans E) Loans on Dwellings For 5+ Families F) Non-occupant Loans on G) Loans On Manufactured Number Average Value Number Average Value Number Average Value Number Average Value Number Average Value Number Average Value Number Average Value
LOANS ORIGINATED 23 $74,337 777 $71,518 888 $69,895 127 $25,338 3 $444,083 657 $63,328 0 $0 APPLICATIONS APPROVED, NOT ACCEPTED 0 $0 283 $70,095 308 $73,552 28 $32,515 0 $0 166 $63,935 0 $0 APPLICATIONS DENIED 19 $91,979 1,265 $74,589 2,052 $77,842 512 $29,024 0 $0 870 $66,979 28 $60,463 APPLICATIONS WITHDRAWN 11 $92,709 164 $73,273 446 $79,535 37 $53,496 0 $0 102 $63,391 0 $0 FILES CLOSED FOR INCOMPLETENESS 0 $0 82 $74,696 145 $77,290 13 $46,748 0 $0 40 $65,664 1 $70,000
Aggregated Statistics For Year 2006(Based on 18 full and 12 partial tracts) A) FHA, FSA/RHS & VA B) Conventional C) Refinancings D) Home Improvement Loans E) Loans on Dwellings For 5+ Families F) Non-occupant Loans on G) Loans On Manufactured Number Average Value Number Average Value Number Average Value Number Average Value Number Average Value Number Average Value Number Average Value
LOANS ORIGINATED 57 $79,570 1,778 $67,848 1,611 $70,994 170 $39,630 1 $135,500 1,102 $64,634 0 $0 APPLICATIONS APPROVED, NOT ACCEPTED 5 $73,076 767 $72,268 762 $74,697 48 $37,352 0 $0 409 $67,094 2 $25,970 APPLICATIONS DENIED 17 $89,140 1,947 $71,523 2,998 $79,135 660 $32,018 3 $285,453 1,228 $65,100 8 $39,288 APPLICATIONS WITHDRAWN 9 $76,703 593 $74,702 1,031 $81,473 73 $56,852 2 $213,230 313 $66,837 0 $0 FILES CLOSED FOR INCOMPLETENESS 0 $0 127 $67,498 365 $84,195 7 $59,800 0 $0 60 $61,803 0 $0
Aggregated Statistics For Year 2005(Based on 18 full and 12 partial tracts) A) FHA, FSA/RHS & VA B) Conventional C) Refinancings D) Home Improvement Loans E) Loans on Dwellings For 5+ Families F) Non-occupant Loans on G) Loans On Manufactured Number Average Value Number Average Value Number Average Value Number Average Value Number Average Value Number Average Value Number Average Value
LOANS ORIGINATED 136 $86,118 2,100 $66,368 2,220 $73,357 249 $37,629 5 $298,088 1,344 $64,554 0 $0 APPLICATIONS APPROVED, NOT ACCEPTED 18 $83,871 678 $66,972 864 $73,760 55 $48,812 0 $0 377 $64,140 4 $54,000 APPLICATIONS DENIED 30 $85,606 1,831 $69,382 3,617 $78,355 628 $38,350 4 $171,928 1,112 $65,306 22 $57,145 APPLICATIONS WITHDRAWN 12 $83,060 740 $89,729 1,601 $89,675 216 $122,882 0 $0 394 $77,937 1 $75,090 FILES CLOSED FOR INCOMPLETENESS 9 $96,083 173 $72,495 454 $80,161 11 $40,003 0 $0 100 $65,296 1 $80,000
Aggregated Statistics For Year 2004(Based on 18 full and 12 partial tracts) A) FHA, FSA/RHS & VA B) Conventional C) Refinancings D) Home Improvement Loans E) Loans on Dwellings For 5+ Families F) Non-occupant Loans on G) Loans On Manufactured Number Average Value Number Average Value Number Average Value Number Average Value Number Average Value Number Average Value Number Average Value
LOANS ORIGINATED 220 $86,408 1,559 $64,896 2,811 $71,494 251 $39,264 0 $0 1,228 $58,159 146 $48,500 APPLICATIONS APPROVED, NOT ACCEPTED 26 $83,008 917 $63,235 993 $70,111 34 $43,035 0 $0 378 $61,342 300 $53,537 APPLICATIONS DENIED 81 $89,849 1,591 $61,224 3,054 $72,543 521 $28,196 3 $149,927 688 $58,738 628 $47,604 APPLICATIONS WITHDRAWN 41 $96,757 269 $81,501 1,240 $78,784 78 $61,158 1 $52,000 171 $64,172 2 $64,050 FILES CLOSED FOR INCOMPLETENESS 14 $98,484 79 $67,568 445 $82,778 18 $48,354 0 $0 55 $62,908 8 $37,691
Aggregated Statistics For Year 2003(Based on 18 full and 12 partial tracts) A) FHA, FSA/RHS & VA B) Conventional C) Refinancings D) Home Improvement Loans E) Loans on Dwellings For 5+ Families F) Non-occupant Loans on Number Average Value Number Average Value Number Average Value Number Average Value Number Average Value Number Average Value
LOANS ORIGINATED 268 $83,839 835 $64,143 2,961 $68,198 152 $14,750 4 $787,185 771 $56,400 APPLICATIONS APPROVED, NOT ACCEPTED 19 $91,891 328 $62,007 892 $70,876 62 $19,460 0 $0 211 $59,305 APPLICATIONS DENIED 60 $86,636 646 $66,212 3,208 $76,533 501 $11,436 0 $0 481 $56,875 APPLICATIONS WITHDRAWN 25 $73,242 217 $63,443 1,265 $81,693 34 $28,024 0 $0 128 $58,600 FILES CLOSED FOR INCOMPLETENESS 17 $89,495 45 $72,552 479 $107,108 6 $53,218 0 $0 38 $53,540
Aggregated Statistics For Year 2002(Based on 18 full and 12 partial tracts) A) FHA, FSA/RHS & VA B) Conventional C) Refinancings D) Home Improvement Loans E) Loans on Dwellings For 5+ Families F) Non-occupant Loans on Number Average Value Number Average Value Number Average Value Number Average Value Number Average Value Number Average Value
LOANS ORIGINATED 447 $80,569 605 $63,420 2,548 $66,004 244 $12,956 5 $325,130 599 $54,098 APPLICATIONS APPROVED, NOT ACCEPTED 24 $83,655 211 $67,700 826 $64,688 75 $13,414 1 $13,150 145 $54,670 APPLICATIONS DENIED 61 $80,882 382 $64,740 2,820 $63,595 633 $10,941 0 $0 314 $51,700 APPLICATIONS WITHDRAWN 63 $76,228 147 $64,186 1,307 $69,313 69 $29,457 0 $0 116 $52,018 FILES CLOSED FOR INCOMPLETENESS 7 $65,994 72 $65,868 423 $78,515 2 $17,755 0 $0 45 $58,439
Aggregated Statistics For Year 2001(Based on 18 full and 12 partial tracts) A) FHA, FSA/RHS & VA B) Conventional C) Refinancings D) Home Improvement Loans E) Loans on Dwellings For 5+ Families F) Non-occupant Loans on Number Average Value Number Average Value Number Average Value Number Average Value Number Average Value Number Average Value
LOANS ORIGINATED 641 $76,141 533 $59,612 2,780 $62,624 294 $11,037 1 $220,000 491 $48,891 APPLICATIONS APPROVED, NOT ACCEPTED 23 $70,139 162 $57,159 734 $59,866 157 $19,346 1 $50,000 117 $44,832 APPLICATIONS DENIED 94 $75,765 371 $57,247 3,143 $56,708 1,097 $11,297 1 $75,000 271 $44,227 APPLICATIONS WITHDRAWN 51 $62,124 148 $59,629 1,340 $60,177 78 $28,034 0 $0 101 $46,216 FILES CLOSED FOR INCOMPLETENESS 13 $85,768 20 $58,448 317 $61,994 8 $29,442 0 $0 37 $44,113
Aggregated Statistics For Year 2000(Based on 18 full and 12 partial tracts) A) FHA, FSA/RHS & VA B) Conventional C) Refinancings D) Home Improvement Loans E) Loans on Dwellings For 5+ Families F) Non-occupant Loans on Number Average Value Number Average Value Number Average Value Number Average Value Number Average Value Number Average Value
LOANS ORIGINATED 598 $72,912 496 $59,298 2,040 $54,472 461 $9,481 6 $82,658 428 $41,439 APPLICATIONS APPROVED, NOT ACCEPTED 39 $82,028 198 $47,481 802 $55,621 266 $14,632 0 $0 104 $42,271 APPLICATIONS DENIED 109 $65,604 1,144 $43,574 2,539 $50,321 1,418 $12,466 4 $61,672 284 $40,390 APPLICATIONS WITHDRAWN 57 $68,527 192 $66,539 1,045 $49,503 76 $22,464 4 $106,092 82 $44,399 FILES CLOSED FOR INCOMPLETENESS 16 $71,284 25 $48,398 295 $54,619 4 $19,558 0 $0 26 $51,115
Aggregated Statistics For Year 1999(Based on 13 full and 6 partial tracts) A) FHA, FSA/RHS & VA B) Conventional C) Refinancings D) Home Improvement Loans E) Loans on Dwellings For 5+ Families F) Non-occupant Loans on Number Average Value Number Average Value Number Average Value Number Average Value Number Average Value Number Average Value
LOANS ORIGINATED 548 $64,137 224 $54,917 1,873 $49,972 283 $10,042 3 $323,167 269 $40,868 APPLICATIONS APPROVED, NOT ACCEPTED 10 $66,663 151 $42,642 666 $47,977 158 $14,877 0 $0 81 $39,934 APPLICATIONS DENIED 78 $69,016 895 $39,139 1,510 $46,343 717 $11,116 1 $267,640 195 $38,591 APPLICATIONS WITHDRAWN 42 $67,139 116 $56,877 964 $46,285 43 $16,883 0 $0 85 $41,048 FILES CLOSED FOR INCOMPLETENESS 14 $62,488 16 $42,552 247 $47,290 8 $23,682 0 $0 17 $37,763
Private Mortgage Insurance Companies Aggregated Statistics For Year 2009(Based on 6 full and 2 partial tracts) A) Conventional B) Refinancings C) Non-occupant Loans on Number Average Value Number Average Value Number Average Value
LOANS ORIGINATED 1 $60,970 0 $0 0 $0 APPLICATIONS APPROVED, NOT ACCEPTED 2 $83,760 0 $0 0 $0 APPLICATIONS DENIED 0 $0 1 $55,000 0 $0 APPLICATIONS WITHDRAWN 0 $0 0 $0 0 $0 FILES CLOSED FOR INCOMPLETENESS 5 $84,848 0 $0 5 $84,848
Aggregated Statistics For Year 2008(Based on 18 full and 12 partial tracts) A) Conventional B) Refinancings C) Non-occupant Loans on Number Average Value Number Average Value Number Average Value
LOANS ORIGINATED 66 $68,483 14 $66,956 19 $70,670 APPLICATIONS APPROVED, NOT ACCEPTED 90 $77,094 19 $81,115 22 $86,077 APPLICATIONS DENIED 25 $80,738 3 $71,650 15 $76,819 APPLICATIONS WITHDRAWN 19 $73,616 4 $63,752 9 $78,667 FILES CLOSED FOR INCOMPLETENESS 18 $75,509 0 $0 8 $61,878
Aggregated Statistics For Year 2007(Based on 18 full and 12 partial tracts) A) Conventional B) Refinancings C) Non-occupant Loans on Number Average Value Number Average Value Number Average Value
LOANS ORIGINATED 302 $79,470 88 $84,579 111 $74,575 APPLICATIONS APPROVED, NOT ACCEPTED 56 $71,865 30 $88,778 31 $68,709 APPLICATIONS DENIED 34 $83,719 2 $74,000 18 $83,557 APPLICATIONS WITHDRAWN 29 $86,341 8 $72,112 11 $76,317 FILES CLOSED FOR INCOMPLETENESS 2 $65,530 1 $118,000 2 $65,530
Aggregated Statistics For Year 2006(Based on 18 full and 12 partial tracts) A) Conventional B) Refinancings C) Non-occupant Loans on Number Average Value Number Average Value Number Average Value
LOANS ORIGINATED 143 $75,680 87 $86,014 68 $67,988 APPLICATIONS APPROVED, NOT ACCEPTED 64 $73,441 24 $88,209 31 $65,287 APPLICATIONS DENIED 4 $70,905 3 $101,240 2 $82,500 APPLICATIONS WITHDRAWN 12 $57,320 12 $96,672 9 $54,649 FILES CLOSED FOR INCOMPLETENESS 5 $82,028 1 $66,000 3 $82,000
Aggregated Statistics For Year 2005(Based on 18 full and 12 partial tracts) A) Conventional B) Refinancings C) Non-occupant Loans on Number Average Value Number Average Value Number Average Value
LOANS ORIGINATED 155 $80,317 139 $83,047 83 $73,367 APPLICATIONS APPROVED, NOT ACCEPTED 64 $74,353 35 $84,451 39 $72,181 APPLICATIONS DENIED 2 $74,510 2 $74,000 4 $74,255 APPLICATIONS WITHDRAWN 29 $75,146 14 $88,394 18 $83,774 FILES CLOSED FOR INCOMPLETENESS 0 $0 8 $81,969 0 $0
Aggregated Statistics For Year 2004(Based on 18 full and 12 partial tracts) A) Conventional B) Refinancings C) Non-occupant Loans on Number Average Value Number Average Value Number Average Value
LOANS ORIGINATED 222 $72,108 118 $87,082 117 $63,268 APPLICATIONS APPROVED, NOT ACCEPTED 86 $74,255 46 $87,271 47 $64,030 APPLICATIONS DENIED 23 $81,546 7 $74,819 14 $66,980 APPLICATIONS WITHDRAWN 31 $70,302 19 $85,844 18 $65,916 FILES CLOSED FOR INCOMPLETENESS 3 $79,310 0 $0 1 $60,270
Aggregated Statistics For Year 2003(Based on 18 full and 12 partial tracts) A) Conventional B) Refinancings C) Non-occupant Loans on Number Average Value Number Average Value Number Average Value
LOANS ORIGINATED 249 $68,023 161 $84,664 135 $59,301 APPLICATIONS APPROVED, NOT ACCEPTED 69 $70,216 62 $85,004 33 $67,812 APPLICATIONS DENIED 17 $59,756 7 $81,343 13 $58,723 APPLICATIONS WITHDRAWN 19 $56,412 14 $71,882 14 $53,336 FILES CLOSED FOR INCOMPLETENESS 2 $53,755 0 $0 0 $0
Aggregated Statistics For Year 2002(Based on 18 full and 12 partial tracts) A) Conventional B) Refinancings C) Non-occupant Loans on Number Average Value Number Average Value Number Average Value
LOANS ORIGINATED 200 $66,591 179 $76,502 105 $59,580 APPLICATIONS APPROVED, NOT ACCEPTED 52 $57,558 63 $77,197 35 $54,778 APPLICATIONS DENIED 14 $61,979 7 $68,729 11 $58,429 APPLICATIONS WITHDRAWN 20 $69,957 23 $82,652 11 $63,219 FILES CLOSED FOR INCOMPLETENESS 1 $36,830 2 $64,605 1 $36,830
Aggregated Statistics For Year 2001(Based on 18 full and 12 partial tracts) A) Conventional B) Refinancings C) Non-occupant Loans on Number Average Value Number Average Value Number Average Value
LOANS ORIGINATED 186 $65,418 177 $75,810 100 $57,802 APPLICATIONS APPROVED, NOT ACCEPTED 30 $63,590 56 $78,024 23 $62,762 APPLICATIONS DENIED 10 $71,082 36 $75,164 15 $64,291 APPLICATIONS WITHDRAWN 9 $50,903 7 $99,701 6 $51,027 FILES CLOSED FOR INCOMPLETENESS 2 $46,270 1 $52,000 2 $42,770
Aggregated Statistics For Year 2000(Based on 18 full and 12 partial tracts) A) Conventional B) Refinancings C) Non-occupant Loans on Number Average Value Number Average Value Number Average Value
LOANS ORIGINATED 166 $58,197 210 $58,140 69 $48,273 APPLICATIONS APPROVED, NOT ACCEPTED 18 $55,341 22 $55,125 8 $48,891 APPLICATIONS DENIED 10 $50,586 7 $66,729 4 $51,500 APPLICATIONS WITHDRAWN 3 $62,000 6 $74,832 3 $67,390 FILES CLOSED FOR INCOMPLETENESS 1 $60,000 5 $79,840 1 $60,000
Aggregated Statistics For Year 1999(Based on 13 full and 6 partial tracts) A) Conventional B) Refinancings C) Non-occupant Loans on Number Average Value Number Average Value Number Average Value
LOANS ORIGINATED 58 $54,270 55 $57,633 24 $39,659 APPLICATIONS APPROVED, NOT ACCEPTED 7 $50,371 10 $57,025 3 $28,587 APPLICATIONS DENIED 4 $65,225 6 $55,215 2 $53,450 APPLICATIONS WITHDRAWN 3 $58,967 0 $0 2 $45,450 FILES CLOSED FOR INCOMPLETENESS 0 $0 0 $0 0 $0
2002 - 2018 National Fire Incident Reporting System (NFIRS) incidents See full 2006 National Fire Incident Reporting System statistics for zip code 48205, Michigan
Most common first names in zip code 48205 among deceased individuals Name Count Lived (average)
John 696 73.7 years Mary 559 78.4 years Joseph 477 73.0 years William 417 73.7 years Frank 343 74.8 years Edward 298 72.6 years James 287 68.2 years Anna 265 80.9 years Helen 264 76.6 years George 262 72.4 years
Most common last names in zip code 48205 among deceased individuals Last name Count Lived (average)
Smith 158 69.3 years Johnson 113 68.3 years Williams 107 64.0 years Brown 88 70.1 years Miller 85 72.9 years Jones 77 70.3 years Jackson 65 64.2 years Davis 64 68.3 years Thomas 52 67.7 years Harris 45 66.3 years
Businesses in zip code 48205
Name Count Name Count
AutoZone 2 Little Caesars Pizza 2 Baskin-Robbins 1 McDonald's 1 CVS 2 Nike 2 Church's Chicken 1 Pizza Hut 1 Dairy Queen 2 Popeyes 1 Domino's Pizza 1 T-Mobile 1 Dunkin Donuts 1 Taco Bell 1 Foot Locker 1 The Athlete's Foot 2 GameStop 1 UPS 2 H&R Block 2 Wendy's 1 KFC 1

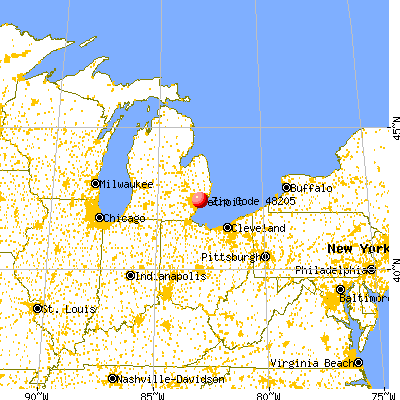


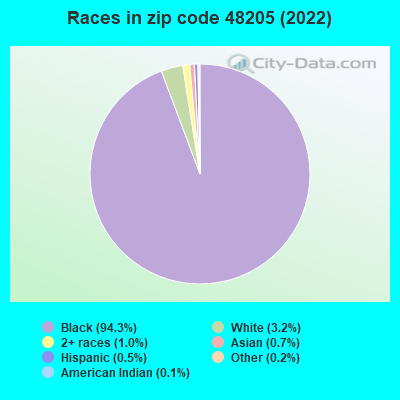


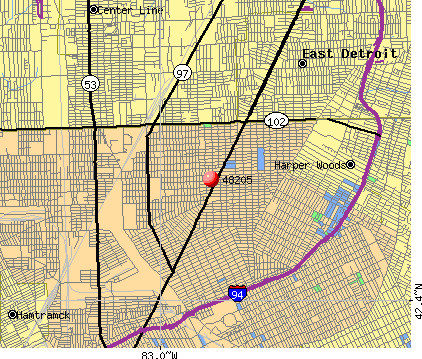 Nearest zip codes: 48089, 48213, 48224, 48021, 48225, 48234.
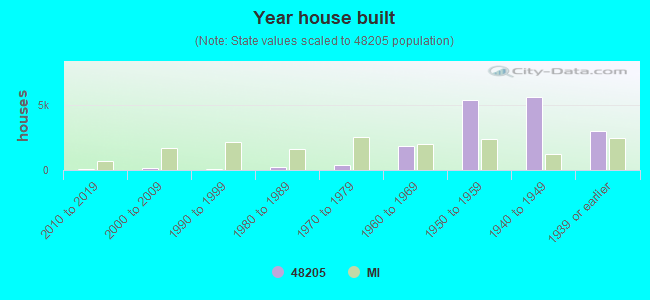

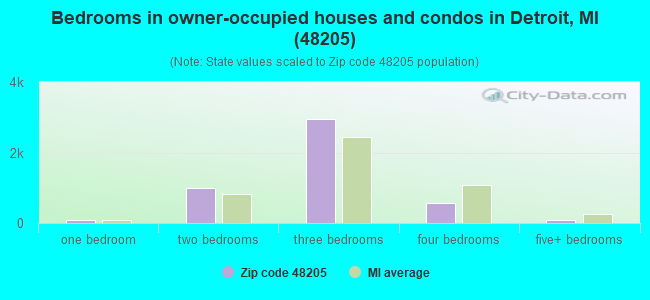
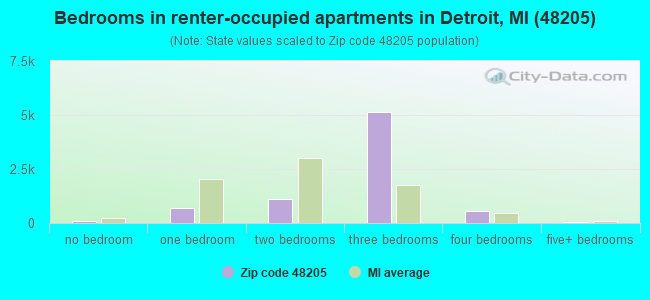
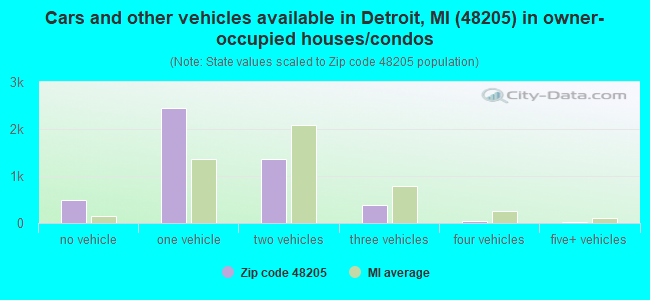
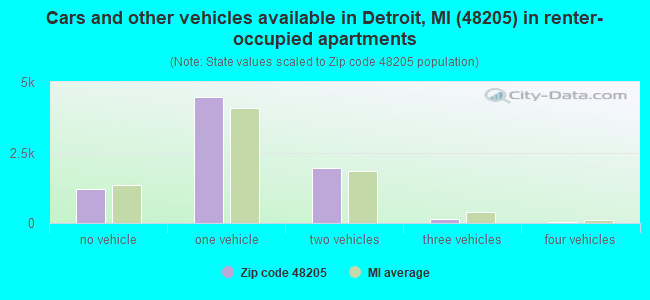


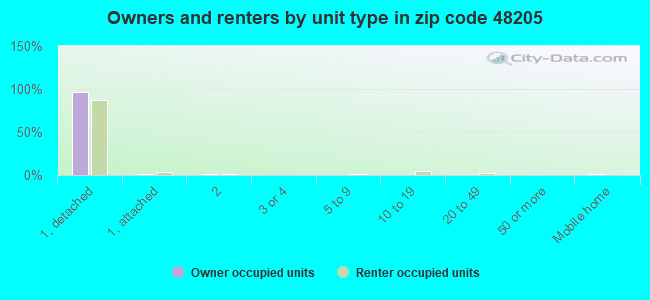
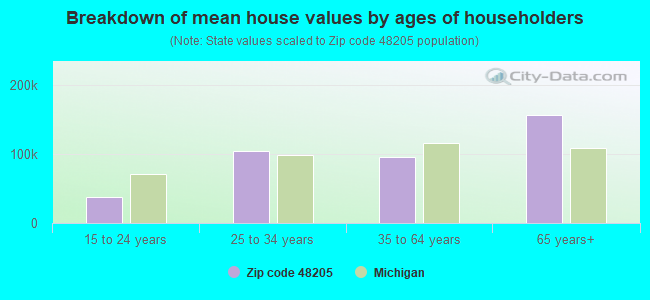


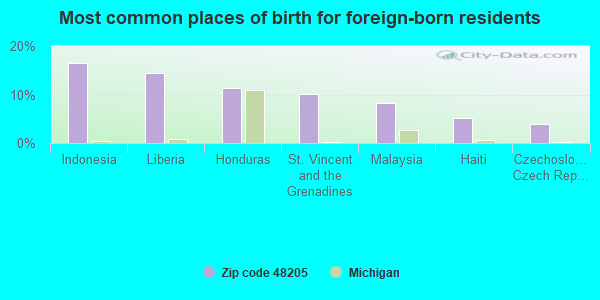
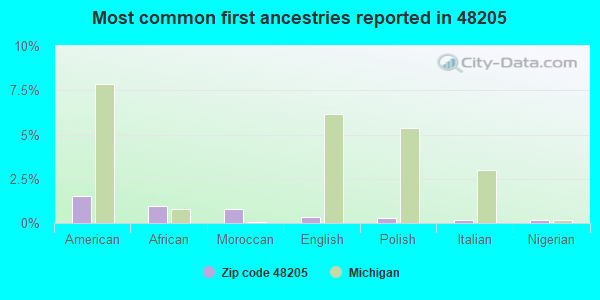
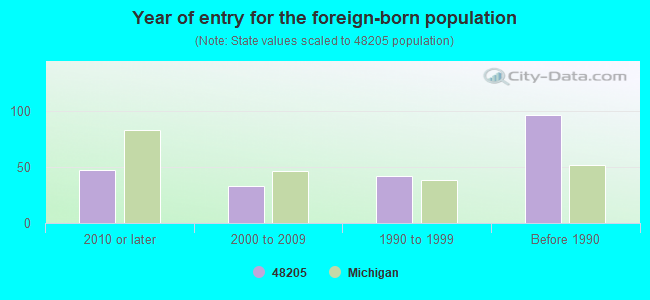
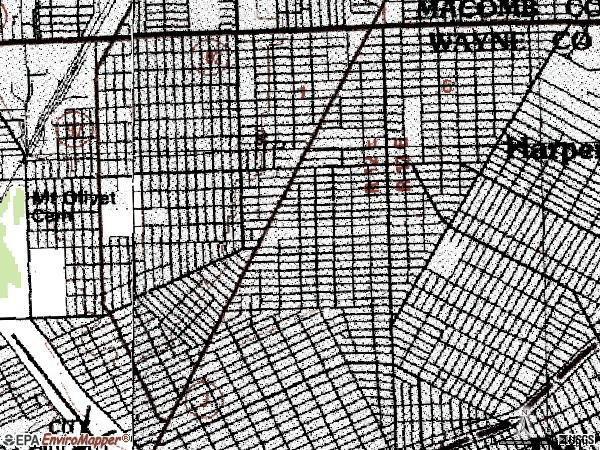

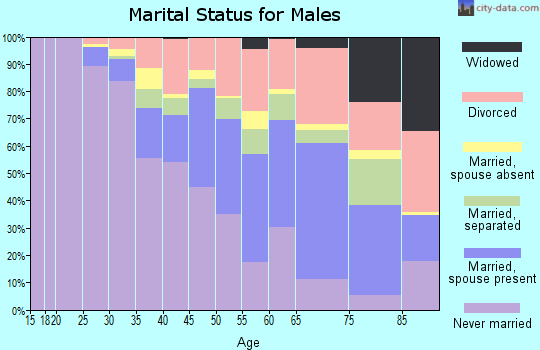
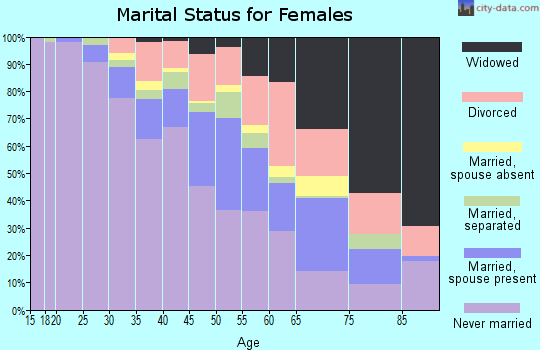
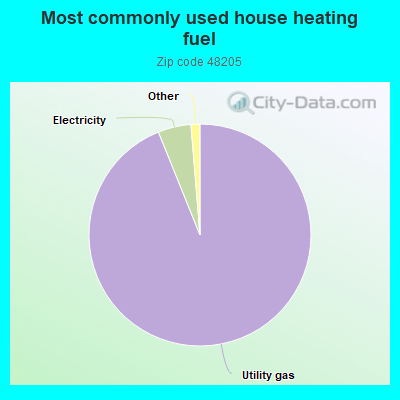
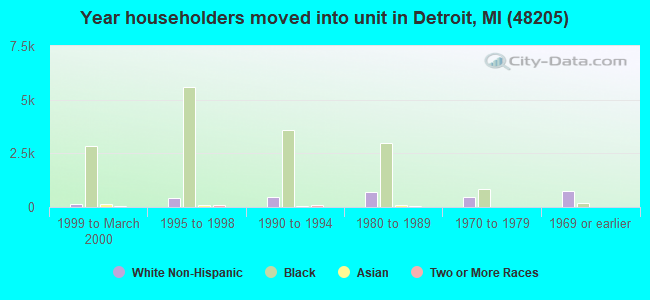
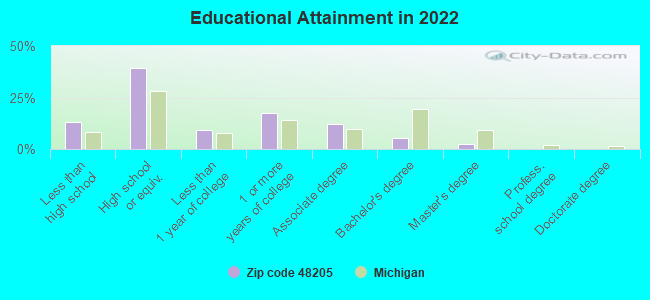
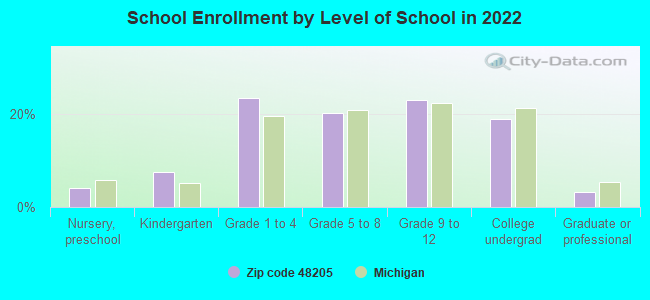
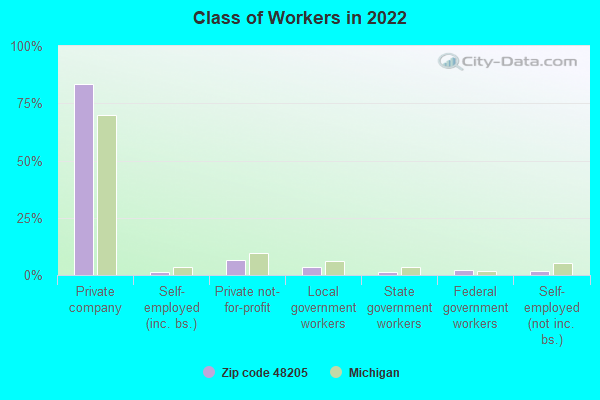
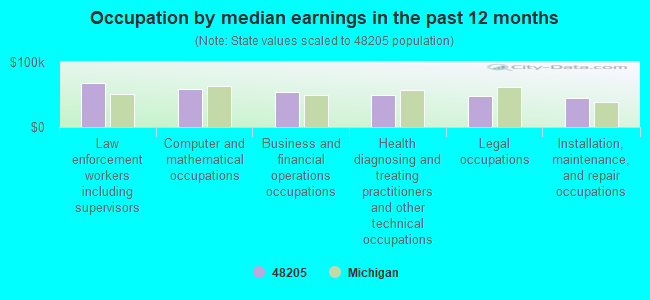
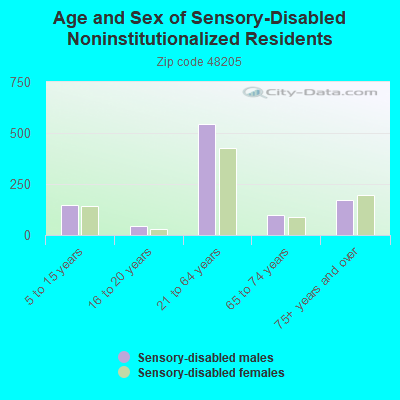
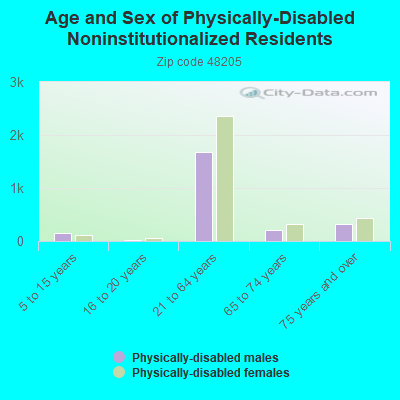
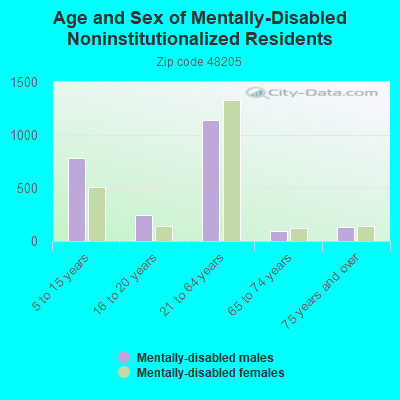
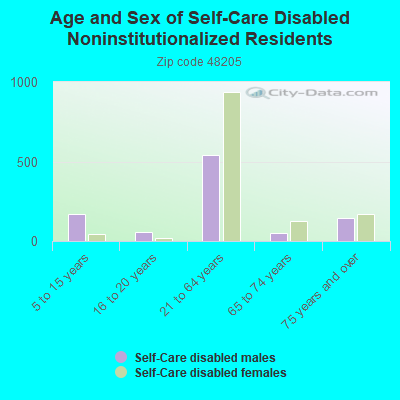
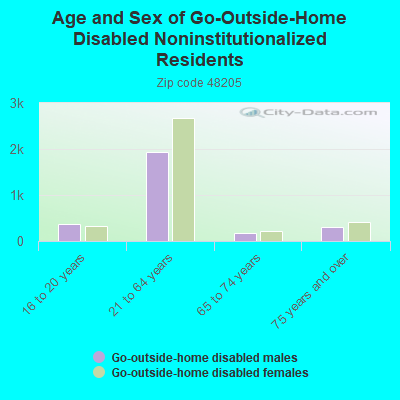
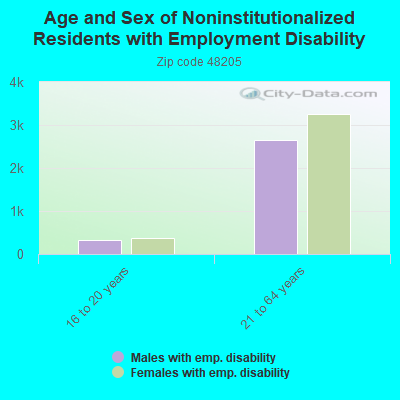
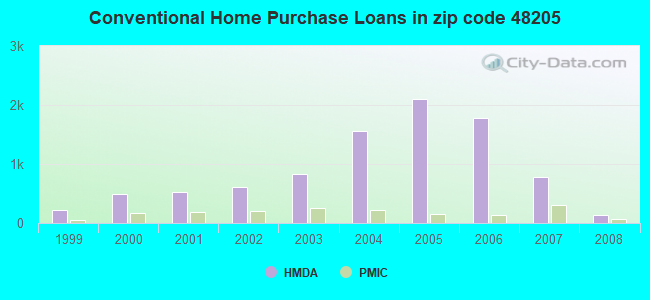
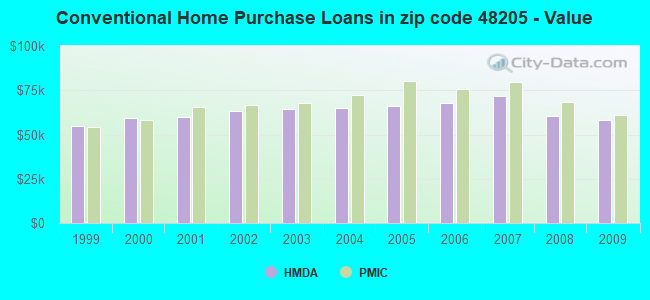
 Based on the data from the years 2002 - 2018 the average number of fire incidents per year is 429. The highest number of fires - 880 took place in 2014, and the least - 0 in 2007. The data has a growing trend.
 When looking into fire subcategories, the most incidents belonged to: Structure Fires (72.9%), and Mobile Property/Vehicle Fires (13.5%).