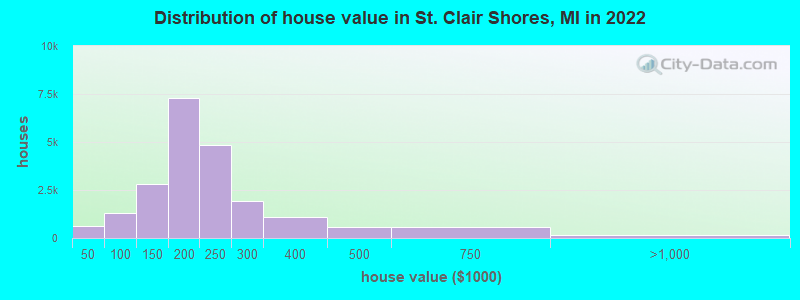
Estimated median house or condo value in 2022: $201,594 (it was $122,500 in 2000)
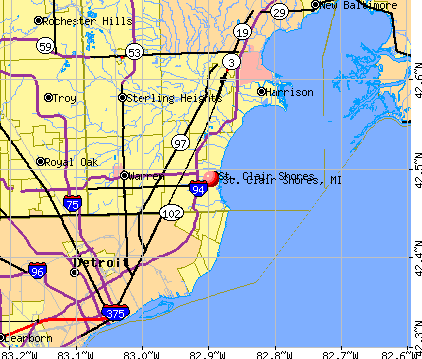
St. Clair Shores:
$201,594
MI:
$224,400
Mean prices in 2022:all housing units: $213,943; detached houses: $221,274; townhouses or other attached units: $187,806; in 2-unit structures: $290,385; in 3-to-4-unit structures: $107,365; in 5-or-more-unit structures: $80,615; mobile homes: $24,783
Median gross rent in 2022: $1,127.
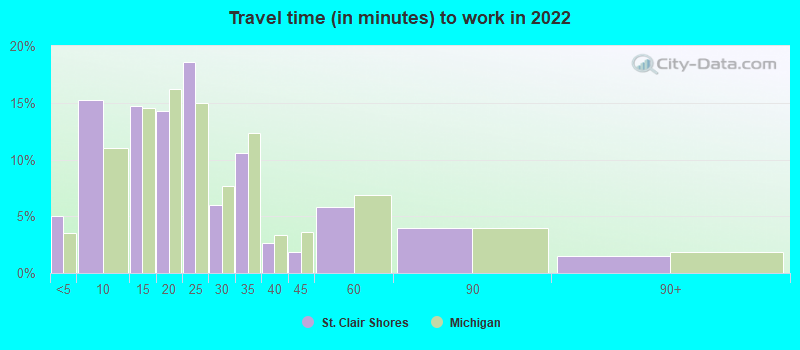
March 2022 cost of living index in St. Clair Shores: 96.3 (near average, U.S. average is 100)
Percentage of residents living in poverty in 2022: 7.2%
(7.1% for White Non-Hispanic residents, 7.4% for Black residents, 3.6% for Hispanic or Latino residents, 17.3% for American Indian residents, 10.2% for two or more races residents)
According to our research of Michigan and other state lists, there were 96 registered sex offenders living in St. Clair Shores, Michigan as of April 28, 2024. The ratio of all residents to sex offenders in St. Clair Shores is 630 to 1. The ratio of registered sex offenders to all residents in this city is lower than the state average.
Crime rates in St. Clair Shores by year
Type
2009
2010
2011
2012
2013
2014
2015
2016
2017
2018
2019
2020
2021
2022
Murders (per 100,000)
2 (3.3)
0 (0.0)
1 (1.7)
0 (0.0)
0 (0.0)
2 (3.3)
0 (0.0)
0 (0.0)
0 (0.0)
1 (1.7)
2 (3.4)
0 (0.0)
0 (0.0)
0 (0.0)
Rapes (per 100,000)
22 (36.6)
9 (15.1)
15 (25.1)
24 (40.1)
23 (38.5)
29 (48.2)
27 (44.9)
31 (51.7)
32 (53.5)
16 (26.8)
30 (50.5)
14 (23.8)
17 (29.2)
10 (17.3)
Robberies (per 100,000)
21 (35.0)
28 (46.9)
24 (40.2)
14 (23.4)
27 (45.2)
17 (28.3)
13 (21.6)
13 (21.7)
14 (23.4)
16 (26.8)
10 (16.8)
10 (17.0)
13 (22.3)
10 (17.3)
Assaults (per 100,000)
83 (138.2)
115 (192.6)
87 (145.8)
118 (197.2)
77 (128.9)
68 (113.0)
90 (149.7)
75 (125.1)
70 (117.1)
98 (164.4)
71 (119.6)
81 (137.5)
74 (127.0)
82 (142.2)
Burglaries (per 100,000)
204 (339.6)
194 (324.9)
248 (415.6)
283 (472.9)
181 (302.9)
145 (241.0)
125 (207.9)
139 (231.9)
93 (155.6)
86 (144.3)
80 (134.8)
60 (101.9)
73 (125.3)
49 (85.0)
Thefts (per 100,000)
759 (1,263)
808 (1,353)
747 (1,252)
822 (1,374)
580 (970.6)
544 (904.3)
576 (958.1)
609 (1,016)
564 (943.4)
458 (768.2)
422 (710.9)
332 (563.7)
346 (594.0)
357 (619.2)
Auto thefts (per 100,000)
105 (174.8)
85 (142.3)
93 (155.9)
89 (148.7)
85 (142.2)
78 (129.7)
67 (111.5)
63 (105.1)
45 (75.3)
56 (93.9)
57 (96.0)
48 (81.5)
50 (85.8)
99 (171.7)
Arson (per 100,000)
9 (15.0)
6 (10.0)
6 (10.1)
4 (6.7)
4 (6.7)
1 (1.7)
2 (3.3)
4 (6.7)
5 (8.4)
4 (6.7)
0 (0.0)
1 (1.7)
3 (5.1)
4 (6.9)
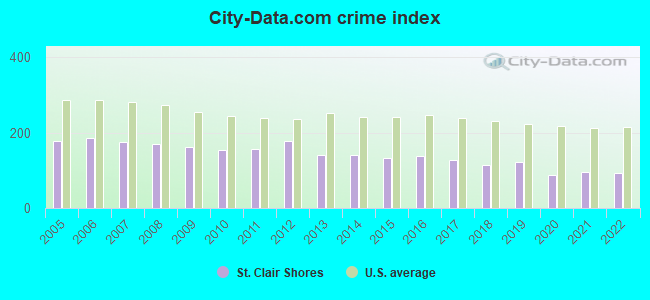
City-Data.com crime index
162.4
152.9
156.3
178.5
141.5
139.7
134.2
138.2
127.9
114.1
121.7
87.8
94.8
92.0
The City-Data.com crime index weighs serious crimes and violent crimes more heavily. Higher means more crime, U.S. average is 246.1. It adjusts for the number of visitors and daily workers commuting into cities.
- means the value is smaller than the state average.
Latest news from St. Clair Shores, MI collected exclusively by city-data.com from local newspapers, TV, and radio stations
Ancestries: Polish (13.4%), German (13.2%), Italian (9.8%), American (9.1%), Irish (6.1%), English (4.5%).
Current Local Time: EST time zone
Elevation: 585 feet
Land area: 11.5 square miles.
Population density: 5,008 people per square mile (average).
2,487 residents are foreign born (2.4% Europe, 0.7% Asia, 0.6% North America, 0.5% Latin America).
This city:
4.3%
Michigan:
6.9%
Median real estate property taxes paid for housing units with mortgages in 2022: $3,085 (1.5%) Median real estate property taxes paid for housing units with no mortgage in 2022: $2,598 (1.3%)
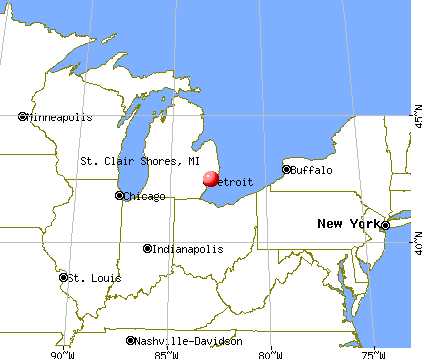
Nearest city with pop. 200,000+: Detroit, MI (12.6 miles , pop. 951,270).
Nearest city with pop. 1,000,000+: Chicago, IL (249.2 miles , pop. 2,896,016).
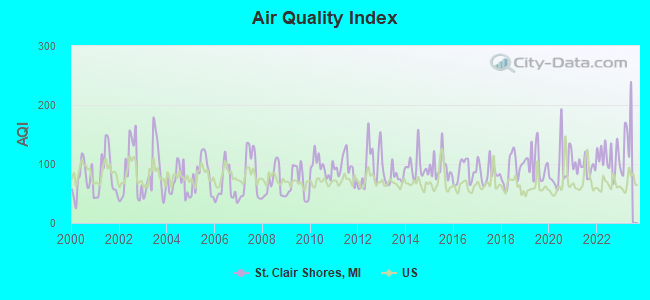
Air Quality Index (AQI) level in 2022 was 111. This is significantly worse than average.
City:
111
U.S.:
73
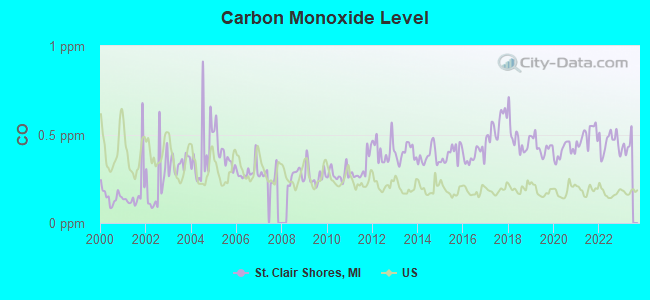
Carbon Monoxide (CO) [ppm] level in 2022 was 0.453. This is significantly worse than average.Closest monitor was 5.8 miles away from the city center.
City:
0.453
U.S.:
0.251
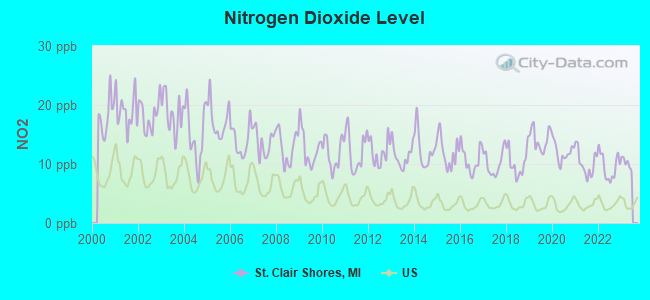
Nitrogen Dioxide (NO2) [ppb] level in 2022 was 9.58. This is significantly worse than average.Closest monitor was 0.5 miles away from the city center.
City:
9.58
U.S.:
5.11
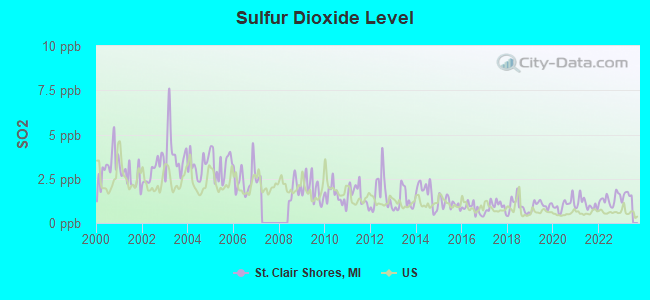
Sulfur Dioxide (SO2) [ppb] level in 2022 was 1.35. This is about average.Closest monitor was 0.5 miles away from the city center.
City:
1.35
U.S.:
1.51
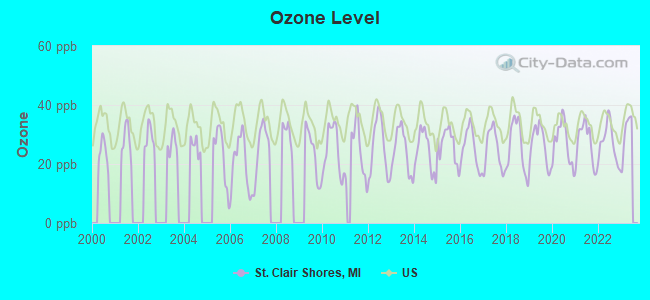
Ozone [ppb] level in 2022 was 27.1. This is better than average.Closest monitor was 10.6 miles away from the city center.
City:
27.1
U.S.:
33.3
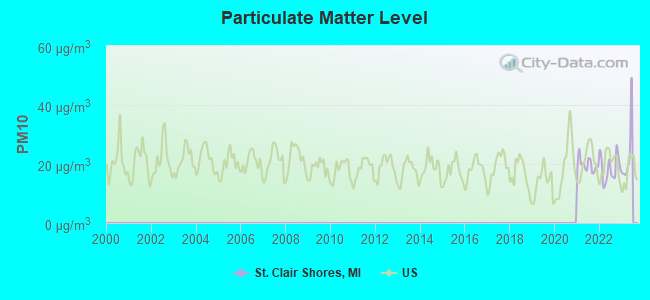
Particulate Matter (PM10) [µg/m3] level in 2022 was 18.6. This is about average.Closest monitor was 18.0 miles away from the city center.
City:
18.6
U.S.:
19.2
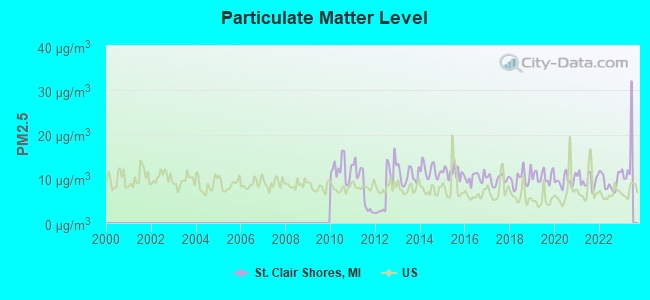
Particulate Matter (PM2.5) [µg/m3] level in 2022 was 9.32. This is about average.Closest monitor was 6.6 miles away from the city center.
City:
9.32
U.S.:
8.11
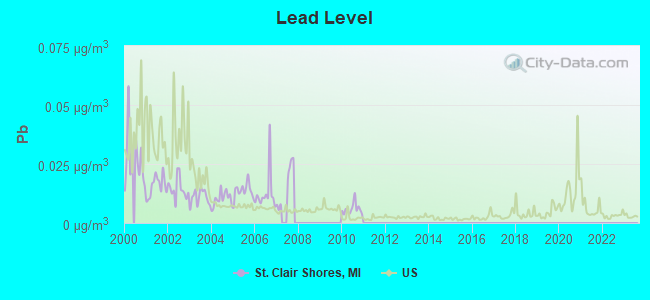
Lead (Pb) [µg/m3] level in 2010 was 0.00593. This is significantly better than average.Closest monitor was 3.6 miles away from the city center.
City:
0.00593
U.S.:
0.00931
Tornado activity:
St. Clair Shores-area historical tornado activity is slightly above Michigan state average. It is 12% greater than the overall U.S. average.
On 7/4/1957, a category F4 (max. wind speeds 207-260 mph) tornado 11.6 miles away from the St. Clair Shores city center injured 6 peopleand causedbetween $50,000 and $500,000 in damages.
On 5/8/1964, a category F4 tornado 13.1 miles away from the city center killed 11 peopleand injured 224 peopleand causedbetween $500,000 and $5,000,000 in damages.
Earthquake activity:
St. Clair Shores-area historical earthquake activity is significantly above Michigan state average. It is 50% smaller than the overall U.S. average.
On 9/25/1998 at 19:52:52, a magnitude 5.2 (4.8 MB, 4.3 MS, 5.2 LG, 4.5 MW, Depth: 3.1 mi, Class: Moderate, Intensity: VI - VII) earthquake occurred 145.9 miles away from St. Clair Shores center On 1/31/1986 at 16:46:43, a magnitude 5.0 (5.0 MB) earthquake occurred 108.2 miles away from the city center On 7/12/1986 at 08:19:37, a magnitude 4.5 (4.5 MB, Class: Light, Intensity: IV - V) earthquake occurred 155.0 miles away from St. Clair Shores center On 7/27/1980 at 18:52:21, a magnitude 5.2 (5.1 MB, 4.7 MS, 5.0 UK, 5.2 UK) earthquake occurred 301.3 miles away from the city center On 8/23/2011 at 17:51:04, a magnitude 5.8 (5.8 MW, Depth: 3.7 mi) earthquake occurred 410.9 miles away from the city center On 5/2/2015 at 16:23:07, a magnitude 4.2 (4.2 MW, Depth: 2.8 mi) earthquake occurred 130.6 miles away from St. Clair Shores center Magnitude types: regional Lg-wave magnitude (LG), body-wave magnitude (MB), surface-wave magnitude (MS), moment magnitude (MW)
Natural disasters:
The number of natural disasters in Macomb County (15) is near the US average (15). Major Disasters (Presidential) Declared: 9 Emergencies Declared: 5
Causes of natural disasters: Storms: 9, Floods: 7, Tornadoes: 3, Winter Storms: 2, Blizzard: 1, Hurricane: 1, Power Outage: 1, Snowstorm: 1, Wind: 1, Other: 1 (Note: some incidents may be assigned to more than one category).
Hospitals and medical centers near St. Clair Shores:
FMC - ST CLAIR SHORES (Dialysis Facility, about 1 miles away; SAINT CLAIR SHORES, MI)
SHOREPOINTE NURSING CENTER (Nursing Home, about 1 miles away; SAINT CLAIR SHORES, MI)
HENRY FORD CONT CARE CTR-ROSEV (Nursing Home, about 2 miles away; ROSEVILLE, MI)
HACKETT AND FABRY HOME HEALTHCARE (Home Health Center, about 2 miles away; SAINT CLAIR SHORES, MI)
FAITH HOME CARE SERVICES, L L C (Home Health Center, about 3 miles away; ROSEVILLE, MI)
COAST TO COAST SERVICES, INC (Home Health Center, about 3 miles away; SAINT CLAIR SHORES, MI)
PRIORITY ONE HOME HEALTH (Home Health Center, about 3 miles away; SAINT CLAIR SHORES, MI)
13 miles: DETROIT (11 W. BALTIMORE AVE.) . Services: ticket office, partially wheelchair accessible, enclosed waiting area, public restrooms, public payphones, free short-term parking, call for car rental service, taxi stand, public transit connection.
13 miles: ROYAL OAK (201 S. SHERMAN DR.) . Services: enclosed waiting area, public payphones, vending machines, paid short-term parking, taxi stand, intercity bus service, public transit connection.
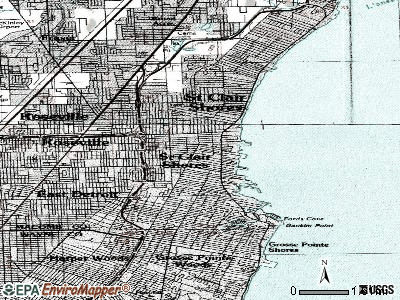
Notable locations in St. Clair Shores: Saint Clair Shores Country Club (A), Saint Clair Shores Police Department (B), Saint Clair Shores Library (C), Saint John Family Medical Center (D), Saint John Medical Center (E), Saint John Medical Center-Masonic (F), Henry Ford Medical Center - Saint Clair Shores and East Jefferson (G), Bon Secours Diagnostic Center and Family Practice (H), Bon Secours Internists (I), Bon Secours Rehabilitation Services (J), Saint Clair Shores Police Department (K), Saint Clair Shores Fire Department Station 1 Headquarters (L), Saint Clair Shores Fire Department Station 2 North (M), Saint Clair Shores Fire Department Station 3 South (N). Display/hide their locations on the map
Churches in St. Clair Shores include: First Bethany United Church of Christ (A), Lake Shore Presbyterian Church (B), Bethel Lutheran Church (C), Faith Cumberland Presbyterian Church (D), Saint Clair Shores Assembly of God Church (E), Bethel Baptist Church (F), First United Methodist Church (G), Saint Spyridon Greek Orthodox Church (H), Assumption Greek Orthodox Church (I). Display/hide their locations on the map
Parks in St. Clair Shores include: Lakefront Park (1), Blossom Health Inn Historical Marker (2), Lake Saint Clair (Lac Sainte Claire) Historical Marker (3), Milk River Settlement Historical Marker (4), Selinsky-Green Log House Historical Marker (5), Shoreline Interurban Railway Historical Marker (6), Brys Park (7), Sussex Park (8), Monroe Playground (9). Display/hide their locations on the map
Birthplace of: Candice Miller - Politician, Charles Faulkner - Master Neuro-linguistic Programmer and Trainer, Dave Coulier - Film actor, Faye Grant - Film actor, Nikki Nemitz - Softball player, Rachelle Consiglio - Television producer, Sarah Roberts (Michigan politician) - Politician.
Macomb County has a predicted average indoor radon screening level less than 2 pCi/L (pico curies per liter) - Low Potential
Average household size:
This city:
2.2 people
Michigan:
2.5 people
Percentage of family households:
This city:
59.9%
Whole state:
66.0%
Percentage of households with unmarried partners:
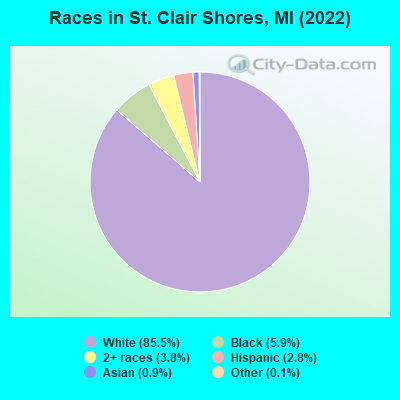
This city:
5.4%
Whole state:
6.4%
Likely homosexual households (counted as self-reported same-sex unmarried-partner households)
Lesbian couples: 0.3% of all households
Gay men: 0.2% of all households
People in group quarters in St. Clair Shores in 2010:
248 people in nursing facilities/skilled-nursing facilities
15 people in group homes intended for adults
7 people in workers' group living quarters and job corps centers
4 people in residential treatment centers for adults
3 people in other noninstitutional facilities
People in group quarters in St. Clair Shores in 2000:
372 people in nursing homes
57 people in other noninstitutional group quarters
25 people in homes for the mentally retarded
19 people in other group homes
11 people in religious group quarters
Banks with branches in St. Clair Shores (2011 data):
Comerica Bank: Jefferson-Marter Branch at 23191 Marter Road, branch established on 1995/10/24; Harper - Grossedale Branch at 30200 Harper Avenue, branch established on 1977/06/06. Info updated 2011/07/29: Bank assets: $60,970.5 mil, Deposits: $48,300.9 mil, headquarters in Dallas, TX, positive income, Commercial Lending Specialization, 497 total offices, Holding Company: Comerica Incorporated
First State Bank of East Detroit: Harper Branch at 24335 Harper Avenue, branch established on 1961/08/10; Mack Branch at 23600 Greater Mack Avenue, branch established on 1947/07/17. Info updated 2008/12/19: Bank assets: $557.8 mil, Deposits: $485.1 mil, headquarters in Eastpointe, MI, positive income, Commercial Lending Specialization, 11 total offices, Holding Company: First State Financial Corporation
Bank of America, National Association: Harper Avenue Branch at 25515 Harper Avenue, branch established on 1890/01/01; Marter-Jefferson Branch at 23225 Marter Road, branch established on 1890/01/01. Info updated 2009/11/18: Bank assets: $1,451,969.3 mil, Deposits: $1,077,176.8 mil, headquarters in Charlotte, NC, positive income, 5782 total offices, Holding Company: Bank Of America Corporation
Citizens Bank: Macomb Branch at 23505 Greater Mack, branch established on 1956/10/23. Info updated 2011/08/01: Bank assets: $9,212.3 mil, Deposits: $7,452.0 mil, headquarters in Flint, MI, positive income, Commercial Lending Specialization, 220 total offices, Holding Company: Citizens Republic Bancorp, Inc.
The Huntington National Bank: St. Clair Shores Branch at 26501 Little Mack, branch established on 1994/06/23. Info updated 2012/04/02: Bank assets: $54,183.4 mil, Deposits: $44,300.3 mil, headquarters in Columbus, OH, positive income, Commercial Lending Specialization, 878 total offices, Holding Company: Huntington Bancshares Incorporated
RBS Citizens, National Association: Mack / St. Joan at 21800 Greater Mack, branch established on 1934/05/01. Info updated 2007/09/19: Bank assets: $106,940.6 mil, Deposits: $75,690.2 mil, headquarters in Providence, RI, positive income, 1135 total offices, Holding Company: Uk Financial Investments Limited
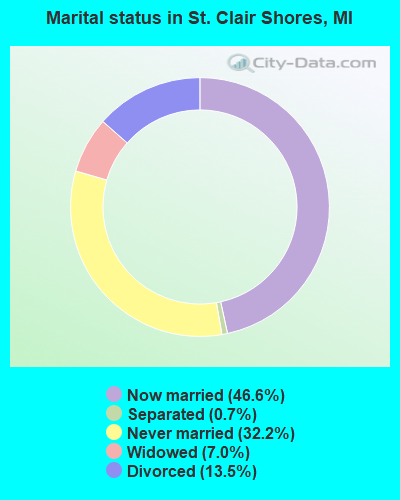
For population 15 years and over in St. Clair Shores:
Never married: 32.2%
Now married: 46.6%
Separated: 0.7%
Widowed: 7.0%
Divorced: 13.5%
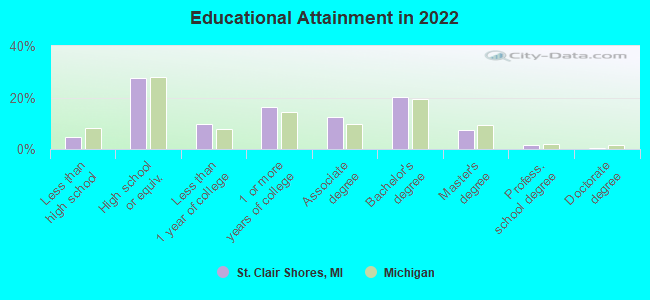
For population 25 years and over in St. Clair Shores:
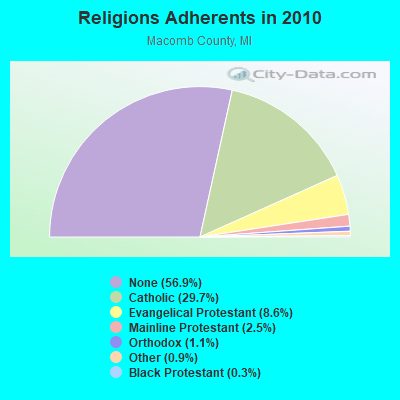
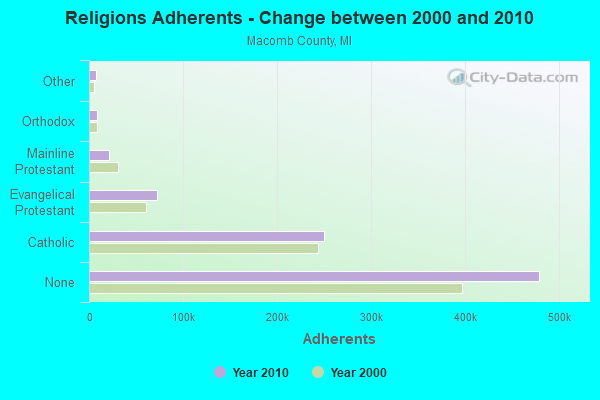
Religion statistics for St. Clair Shores, MI (based on Macomb County data)
Religion
Adherents
Congregations
Catholic
249,439
57
Evangelical Protestant
72,383
188
Mainline Protestant
21,221
65
Orthodox
8,925
6
Other
7,482
28
Black Protestant
2,670
12
None
478,858
-
Source: Clifford Grammich, Kirk Hadaway, Richard Houseal, Dale E.Jones, Alexei Krindatch, Richie Stanley and Richard H.Taylor. 2012. 2010 U.S.Religion Census: Religious Congregations & Membership Study. Association of Statisticians of American Religious Bodies. Jones, Dale E., et al. 2002. Congregations and Membership in the United States 2000. Nashville, TN: Glenmary Research Center. Graphs represent county-level data
Call Sign: N8HCH, Licensee ID: L00241323, Grant Date: 09/17/2015, Expiration Date: 11/28/2025, Certifier: Susan H Manning, Registrant: Susan H Manning, 404 Country Club Drive, St. Clair Shores, MI 48082-1004
Call Sign: N8RLP, Licensee ID: L00328335, Grant Date: 01/15/2022, Expiration Date: 01/15/2032, Registrant: David J West, 22518 Mylls, St. Clair Shores, MI 48081
Call Sign: KC8WPU, Licensee ID: L00682966, Grant Date: 04/10/2013, Expiration Date: 05/09/2023, Certifier: Benjamin M Morales, Registrant: Benjamin M Morales, 29112 Elmwood St., St. Clair Shores, MI 48082-1616
Call Sign: W8RIT, Previous Call Sign: KC8RVF, Licensee ID: L00376619, Grant Date: 04/16/2014, Expiration Date: 06/05/2024, Certifier: David A Edenfield, Registrant: David A Edenfield, 22723 Carolina, St. Clair Shores, MI 48080
Call Sign: K8CIR, Previous Call Sign: KA8CIR, Licensee ID: L00408703, Grant Date: 02/14/2020, Expiration Date: 02/14/2030, Certifier: John E Kacir Iv, Registrant: John E Kacir Iv, 23265 Joy St, St. Clair Shores, MI 48082
Home Mortgage Disclosure Act Aggregated Statistics For Year 2009 (Based on 22 full and 1 partial tracts)
A) FHA, FSA/RHS & VA Home Purchase Loans
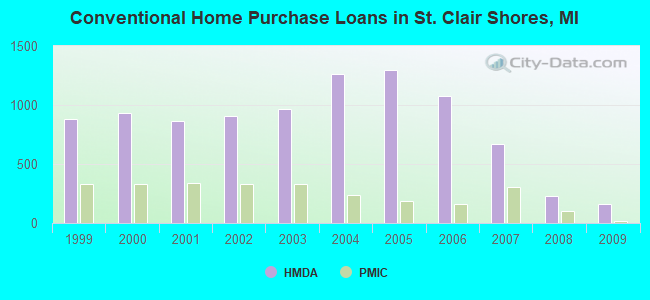
B) Conventional Home Purchase Loans
C) Refinancings
D) Home Improvement Loans
E) Loans on Dwellings For 5+ Families
F) Non-occupant Loans on < 5 Family Dwellings (A B C & D)
G) Loans On Manufactured Home Dwelling (A B C & D)
Number
Average Value
Number
Average Value
Number
Average Value
Number
Average Value
Number
Average Value
Number
Average Value
Number
Average Value
LOANS ORIGINATED
357
$82,136
160
$75,623
589
$119,852
38
$35,481
1
$1,616,000
68
$67,179
0
$0
APPLICATIONS APPROVED, NOT ACCEPTED
19
$100,526
9
$73,466
68
$125,559
11
$11,000
0
$0
4
$104,000
0
$0
APPLICATIONS DENIED
65
$89,902
35
$61,697
301
$122,861
39
$17,744
0
$0
23
$80,674
2
$54,000
APPLICATIONS WITHDRAWN
37
$83,226
23
$84,372
145
$123,259
1
$175,000
0
$0
11
$54,182
1
$75,000
FILES CLOSED FOR INCOMPLETENESS
6
$95,000
4
$82,250
53
$121,740
5
$51,200
0
$0
3
$108,000
0
$0
Aggregated Statistics For Year 2008 (Based on 22 full and 1 partial tracts)
A) FHA, FSA/RHS & VA Home Purchase Loans
B) Conventional Home Purchase Loans
C) Refinancings
D) Home Improvement Loans
E) Loans on Dwellings For 5+ Families
F) Non-occupant Loans on < 5 Family Dwellings (A B C & D)
G) Loans On Manufactured Home Dwelling (A B C & D)
Number
Average Value
Number
Average Value
Number
Average Value
Number
Average Value
Number
Average Value
Number
Average Value
Number
Average Value
LOANS ORIGINATED
290
$107,089
229
$106,032
522
$113,266
74
$28,908
1
$250,000
65
$70,031
0
$0
APPLICATIONS APPROVED, NOT ACCEPTED
22
$95,227
43
$138,442
96
$130,992
16
$19,312
0
$0
20
$101,100
1
$20,000
APPLICATIONS DENIED
56
$106,868
65
$96,351
420
$130,444
109
$24,529
0
$0
39
$86,921
14
$35,143
APPLICATIONS WITHDRAWN
24
$101,458
27
$99,454
153
$125,639
12
$87,167
0
$0
16
$95,342
0
$0
FILES CLOSED FOR INCOMPLETENESS
2
$92,500
15
$106,733
37
$147,712
4
$116,750
0
$0
3
$77,667
0
$0
Aggregated Statistics For Year 2007 (Based on 22 full and 1 partial tracts)
A) FHA, FSA/RHS & VA Home Purchase Loans
B) Conventional Home Purchase Loans
C) Refinancings
D) Home Improvement Loans
E) Loans on Dwellings For 5+ Families
F) Non-occupant Loans on < 5 Family Dwellings (A B C & D)
G) Loans On Manufactured Home Dwelling (A B C & D)
Number
Average Value
Number
Average Value
Number
Average Value
Number
Average Value
Number
Average Value
Number
Average Value
Number
Average Value
LOANS ORIGINATED
82
$124,525
671
$106,788
1,112
$109,399
157
$35,954
2
$3,961,500
110
$91,573
1
$130,000
APPLICATIONS APPROVED, NOT ACCEPTED
4
$104,000
60
$119,146
234
$120,051
35
$33,486
0
$0
24
$138,033
3
$58,000
APPLICATIONS DENIED
21
$127,286
156
$167,205
831
$128,329
177
$44,795
0
$0
71
$125,508
9
$47,111
APPLICATIONS WITHDRAWN
6
$104,667
48
$128,480
306
$134,024
19
$70,938
0
$0
15
$73,303
0
$0
FILES CLOSED FOR INCOMPLETENESS
4
$118,750
24
$114,542
93
$130,415
4
$23,788
0
$0
3
$163,333
0
$0
Aggregated Statistics For Year 2006 (Based on 22 full and 1 partial tracts)
A) FHA, FSA/RHS & VA Home Purchase Loans
B) Conventional Home Purchase Loans
C) Refinancings
D) Home Improvement Loans
E) Loans on Dwellings For 5+ Families
F) Non-occupant Loans on < 5 Family Dwellings (A B C & D)
G) Loans On Manufactured Home Dwelling (A B C & D)
Number
Average Value
Number
Average Value
Number
Average Value
Number
Average Value
Number
Average Value
Number
Average Value
Number
Average Value
LOANS ORIGINATED
102
$135,108
1,076
$102,834
1,514
$104,384
191
$40,264
0
$0
160
$96,149
4
$40,000
APPLICATIONS APPROVED, NOT ACCEPTED
5
$144,800
135
$117,218
317
$113,841
36
$55,944
0
$0
33
$81,010
4
$25,500
APPLICATIONS DENIED
7
$131,000
243
$124,903
1,012
$124,050
163
$44,823
1
$540,000
64
$101,176
12
$44,750
APPLICATIONS WITHDRAWN
8
$129,250
105
$109,438
512
$133,429
26
$93,973
2
$109,000
31
$100,494
2
$81,000
FILES CLOSED FOR INCOMPLETENESS
1
$68,000
27
$125,226
210
$136,347
10
$43,259
0
$0
7
$127,327
1
$112,000
Aggregated Statistics For Year 2005 (Based on 22 full and 1 partial tracts)
A) FHA, FSA/RHS & VA Home Purchase Loans
B) Conventional Home Purchase Loans
C) Refinancings
D) Home Improvement Loans
E) Loans on Dwellings For 5+ Families
F) Non-occupant Loans on < 5 Family Dwellings (A B C & D)
G) Loans On Manufactured Home Dwelling (A B C & D)
Number
Average Value
Number
Average Value
Number
Average Value
Number
Average Value
Number
Average Value
Number
Average Value
Number
Average Value
LOANS ORIGINATED
147
$136,103
1,298
$107,429
2,084
$116,142
202
$48,572
5
$656,800
162
$102,093
3
$59,000
APPLICATIONS APPROVED, NOT ACCEPTED
19
$126,124
190
$117,860
403
$115,518
42
$41,880
0
$0
23
$101,304
4
$57,750
APPLICATIONS DENIED
14
$132,643
278
$121,203
1,101
$124,783
164
$40,624
1
$557,000
41
$107,537
9
$42,556
APPLICATIONS WITHDRAWN
6
$136,818
138
$120,986
638
$135,276
52
$113,946
0
$0
27
$123,519
2
$100,500
FILES CLOSED FOR INCOMPLETENESS
0
$0
37
$121,754
370
$134,776
16
$50,938
0
$0
10
$85,100
0
$0
Aggregated Statistics For Year 2004 (Based on 22 full and 1 partial tracts)
A) FHA, FSA/RHS & VA Home Purchase Loans
B) Conventional Home Purchase Loans
C) Refinancings
D) Home Improvement Loans
E) Loans on Dwellings For 5+ Families
F) Non-occupant Loans on < 5 Family Dwellings (A B C & D)
G) Loans On Manufactured Home Dwelling (A B C & D)
Number
Average Value
Number
Average Value
Number
Average Value
Number
Average Value
Number
Average Value
Number
Average Value
Number
Average Value
LOANS ORIGINATED
181
$130,741
1,259
$119,415
2,458
$117,955
191
$47,203
2
$204,500
195
$117,561
10
$115,700
APPLICATIONS APPROVED, NOT ACCEPTED
16
$122,438
123
$114,013
391
$121,295
26
$40,709
0
$0
27
$178,360
3
$134,000
APPLICATIONS DENIED
33
$131,239
163
$115,219
953
$122,304
149
$41,850
1
$350,000
49
$127,796
9
$52,444
APPLICATIONS WITHDRAWN
14
$132,921
85
$112,973
493
$123,299
37
$76,575
0
$0
19
$132,316
1
$150,000
FILES CLOSED FOR INCOMPLETENESS
4
$126,250
36
$114,562
359
$137,127
9
$52,079
0
$0
11
$131,545
0
$0
Aggregated Statistics For Year 2003 (Based on 22 full and 1 partial tracts)
A) FHA, FSA/RHS & VA Home Purchase Loans
B) Conventional Home Purchase Loans
C) Refinancings
D) Home Improvement Loans
E) Loans on Dwellings For 5+ Families
F) Non-occupant Loans on < 5 Family Dwellings (A B C & D)
Number
Average Value
Number
Average Value
Number
Average Value
Number
Average Value
Number
Average Value
Number
Average Value
LOANS ORIGINATED
251
$130,920
965
$120,507
5,490
$111,774
151
$21,087
4
$791,250
208
$98,639
APPLICATIONS APPROVED, NOT ACCEPTED
14
$109,928
93
$130,157
597
$116,212
39
$13,610
0
$0
29
$97,554
APPLICATIONS DENIED
18
$129,512
106
$126,796
1,159
$120,682
129
$24,929
0
$0
46
$107,995
APPLICATIONS WITHDRAWN
13
$116,615
76
$117,762
613
$121,814
17
$23,706
0
$0
22
$103,818
FILES CLOSED FOR INCOMPLETENESS
13
$130,704
20
$109,650
183
$119,119
5
$42,830
0
$0
6
$101,833
Aggregated Statistics For Year 2002 (Based on 22 full and 1 partial tracts)
A) FHA, FSA/RHS & VA Home Purchase Loans
B) Conventional Home Purchase Loans
C) Refinancings
D) Home Improvement Loans
E) Loans on Dwellings For 5+ Families
F) Non-occupant Loans on < 5 Family Dwellings (A B C & D)
Number
Average Value
Number
Average Value
Number
Average Value
Number
Average Value
Number
Average Value
Number
Average Value
LOANS ORIGINATED
276
$126,576
909
$114,525
4,026
$110,416
239
$20,602
3
$1,255,667
165
$91,157
APPLICATIONS APPROVED, NOT ACCEPTED
6
$100,500
72
$133,379
459
$112,051
44
$23,655
0
$0
16
$87,062
APPLICATIONS DENIED
22
$123,545
102
$90,089
681
$102,890
138
$12,354
1
$2,760,000
22
$87,123
APPLICATIONS WITHDRAWN
27
$127,111
64
$146,715
588
$113,709
29
$34,086
0
$0
10
$77,400
FILES CLOSED FOR INCOMPLETENESS
7
$124,429
17
$110,176
196
$115,370
3
$19,000
0
$0
5
$92,200
Aggregated Statistics For Year 2001 (Based on 22 full and 1 partial tracts)
A) FHA, FSA/RHS & VA Home Purchase Loans
B) Conventional Home Purchase Loans
C) Refinancings
D) Home Improvement Loans
E) Loans on Dwellings For 5+ Families
F) Non-occupant Loans on < 5 Family Dwellings (A B C & D)
Number
Average Value
Number
Average Value
Number
Average Value
Number
Average Value
Number
Average Value
Number
Average Value
LOANS ORIGINATED
323
$119,713
861
$111,226
3,647
$105,384
334
$21,095
2
$1,880,000
113
$84,488
APPLICATIONS APPROVED, NOT ACCEPTED
7
$116,429
54
$100,150
381
$108,770
60
$23,514
1
$450,000
8
$75,115
APPLICATIONS DENIED
18
$106,222
82
$88,041
727
$95,882
172
$14,695
0
$0
11
$76,545
APPLICATIONS WITHDRAWN
17
$121,156
47
$129,019
572
$102,689
40
$28,554
0
$0
12
$97,518
FILES CLOSED FOR INCOMPLETENESS
1
$137,000
13
$138,154
138
$111,699
8
$18,046
0
$0
4
$121,000
Aggregated Statistics For Year 2000 (Based on 22 full and 1 partial tracts)
A) FHA, FSA/RHS & VA Home Purchase Loans
B) Conventional Home Purchase Loans
C) Refinancings
D) Home Improvement Loans
E) Loans on Dwellings For 5+ Families
F) Non-occupant Loans on < 5 Family Dwellings (A B C & D)
Number
Average Value
Number
Average Value
Number
Average Value
Number
Average Value
Number
Average Value
Number
Average Value
LOANS ORIGINATED
313
$117,373
931
$106,361
950
$88,669
434
$16,602
2
$367,500
54
$79,109
APPLICATIONS APPROVED, NOT ACCEPTED
14
$109,143
68
$92,821
168
$81,680
137
$18,987
0
$0
10
$44,200
APPLICATIONS DENIED
18
$115,500
92
$103,980
464
$77,227
198
$15,608
0
$0
15
$51,400
APPLICATIONS WITHDRAWN
13
$112,154
50
$111,145
239
$75,671
36
$48,699
0
$0
10
$70,885
FILES CLOSED FOR INCOMPLETENESS
3
$137,667
18
$108,417
130
$101,185
2
$24,000
0
$0
4
$119,750
Aggregated Statistics For Year 1999 (Based on 17 full and 6 partial tracts)
A) FHA, FSA/RHS & VA Home Purchase Loans
B) Conventional Home Purchase Loans
C) Refinancings
D) Home Improvement Loans
E) Loans on Dwellings For 5+ Families
F) Non-occupant Loans on < 5 Family Dwellings (A B C & D)
2002 - 2011 National Fire Incident Reporting System (NFIRS) incidents
Based on the data from the years 2002 - 2011 the average number of fire incidents per year is 113. The highest number of fire incidents - 148 took place in 2002, and the least - 98 in 2009. The data has a decreasing trend.
When looking into fire subcategories, the most incidents belonged to: Structure Fires (37.7%), and Outside Fires (26.4%).
Fire incident types reported to NFIRS in St. Clair Shores, MI
#2 on the list of "Top 101 cities with the most people born in the same U.S. state as the city (population 50,000+)"
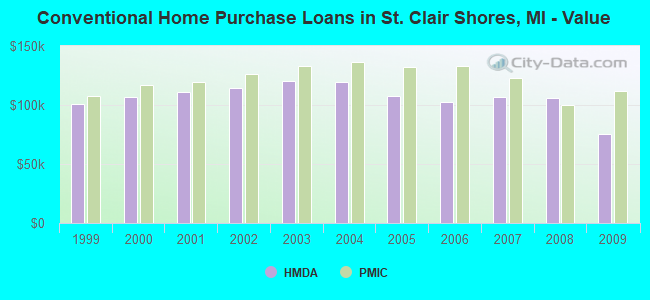
#5 on the list of "Top 100 cities with lowest ratio of median house value to median household income (pop. 50,000+)"
#7 on the list of "Top 101 larger cities with the largest decrease or smallest increase in house/condo value from 2000 (population 50,000+)"
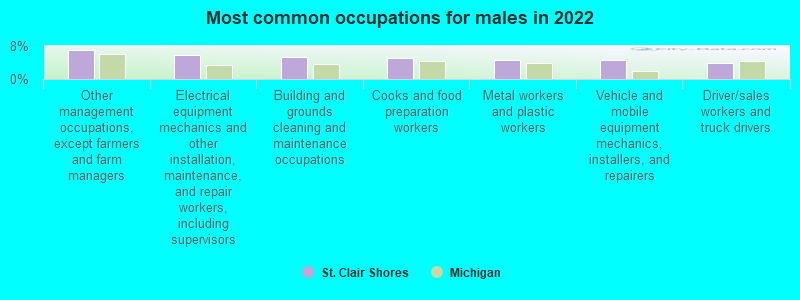
#21 on the list of "Top 101 cities with largest percentage of males in occupations: installation, maintenance, and repair occupations (population 50,000+)"
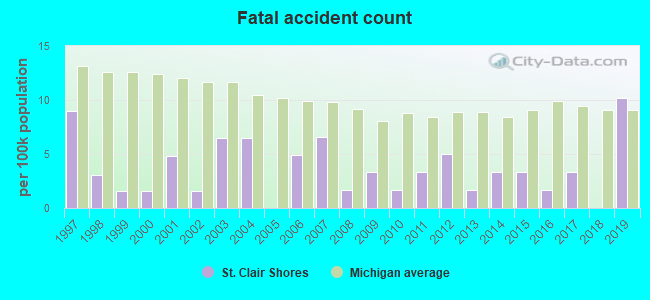
#21 on the list of "Top 101 cities with the highest ratio of rapes to murders between 2002 and 2012 (population 50,000+)"
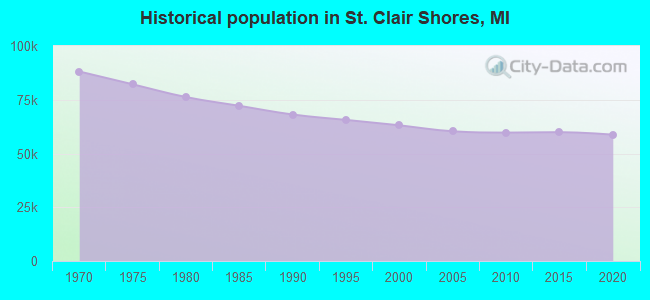
#22 on the list of "Top 101 cities with largest percentage population decreases in the 1990s) (population 50,000+)"
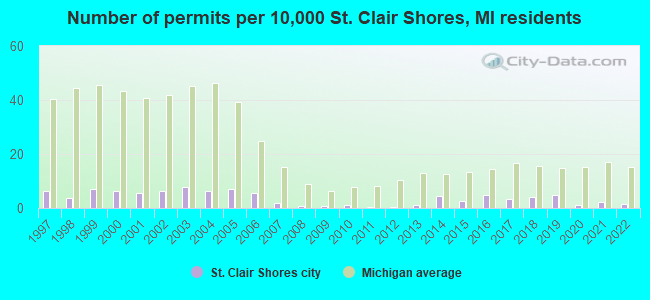
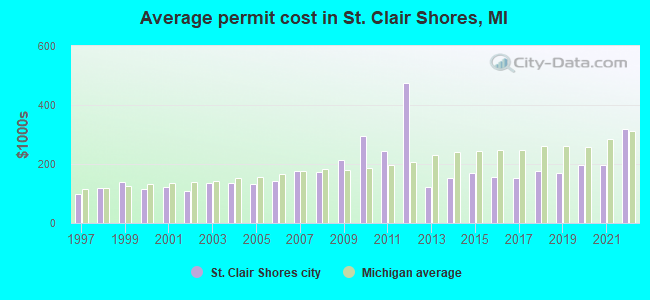
#24 on the list of "Top 101 cities with the highest cost per building permit(population 50,000+)"
#26 on the list of "Top 100 least racially diverse cities (pop. 50,000+)"
#27 on the list of "Top 101 cities with the largest percentage of one, detached housing units in structures (20,000+ housing units)"
#32 on the list of "Top 100 cities with oldest residents (pop. 50,000+)"
#34 on the list of "Top 101 cities with largest percentage of males in industries: manufacturing (population 50,000+)"
#34 on the list of "Top 101 cities with fewest building permits per 10,000 residents (population 50,000+)"
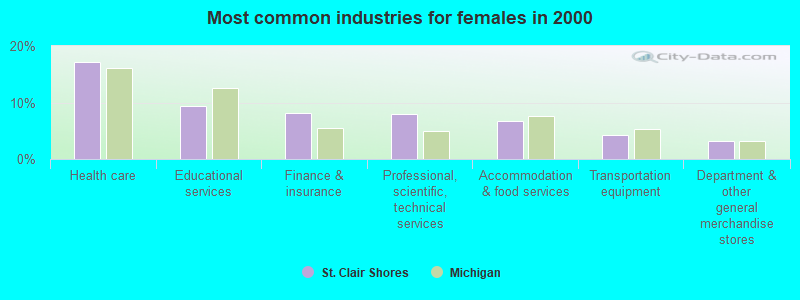
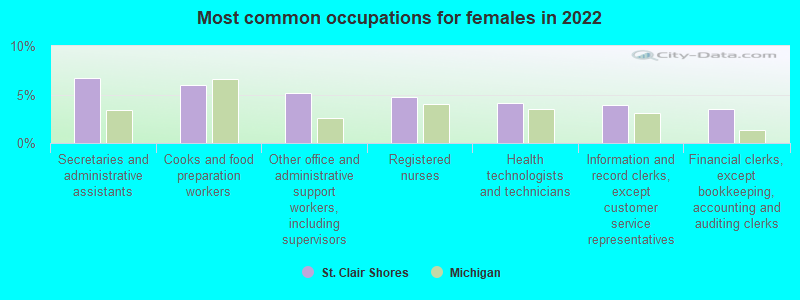
#39 on the list of "Top 101 cities with largest percentage of females in occupations: office and administrative support occupations (population 50,000+)"
#40 on the list of "Top 101 cities with the largest percentage population decrease from 2000 (population 50,000+)"
#42 on the list of "Top 100 cities with declining populations from 2000 to 2014 (pop. 50,000+)"
#59 on the list of "Top 101 cities with largest percentage of females in industries: recyclable material merchant wholesalers (population 50,000+)"
#59 on the list of "Top 101 cities with largest percentage of males in occupations: occupational and physical therapist assistants and aides (population 50,000+)"
#59 on the list of "Top 101 cities with largest percentage of females in occupations: woodworkers (population 50,000+)"
#59 on the list of "Top 101 cities with the lowest number of robberies per 100,000 residents (population 50,000+)"
#59 on the list of "Top 101 cities with largest percentage of females in industries: fuel dealers (population 50,000+)"
#8 on the list of "Top 101 counties with the largest increase in the number of infant deaths per 1000 residents 2000-2006 to 2007-2013 (pop. 50,000+)"
#23 on the list of "Top 101 counties with the highest percentage of residents that visited a dentist within the past year"
#28 on the list of "Top 101 counties with the most Orthodox adherents"
#46 on the list of "Top 101 counties with the most Catholic congregations"
#50 on the list of "Top 101 counties with the highest percentage of residents that smoked 100+ cigarettes in their lives"


 Recent articles from our blog. Our writers, many of them Ph.D. graduates or candidates, create easy-to-read articles on a wide variety of topics.

 (12.6 miles

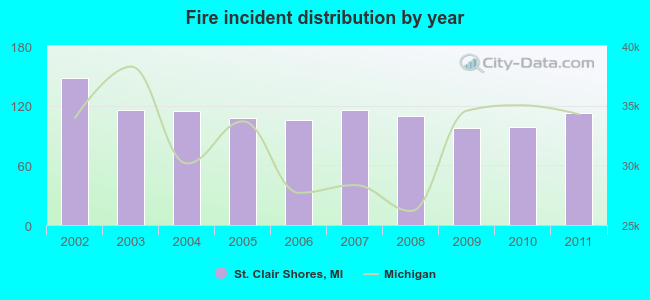 Based on the data from the years 2002 - 2011 the average number of fire incidents per year is 113. The highest number of fire incidents - 148 took place in 2002, and the least - 98 in 2009. The data has a decreasing trend.
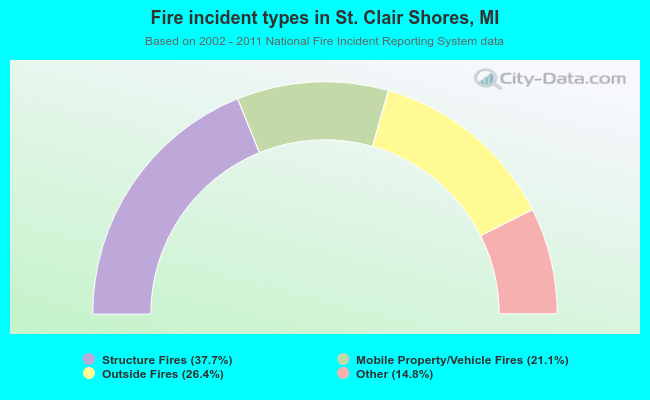 When looking into fire subcategories, the most incidents belonged to: Structure Fires (37.7%), and Outside Fires (26.4%).