Estimated zip code population in 2022: 22,019 Zip code population in 2010: 22,494 Zip code population in 2000: 23,504
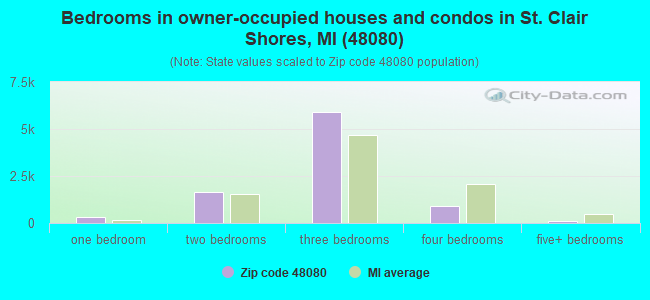
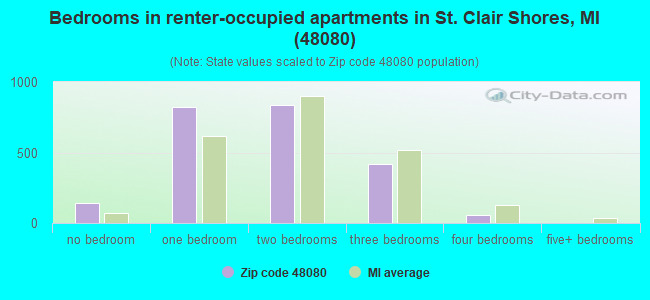
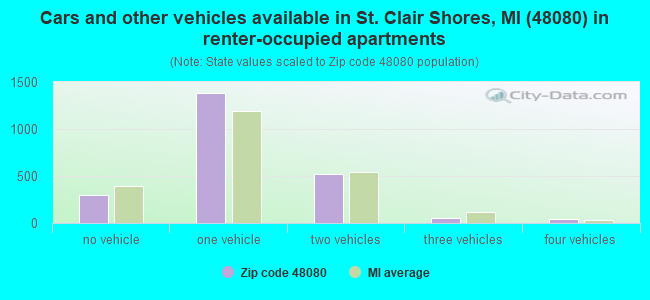
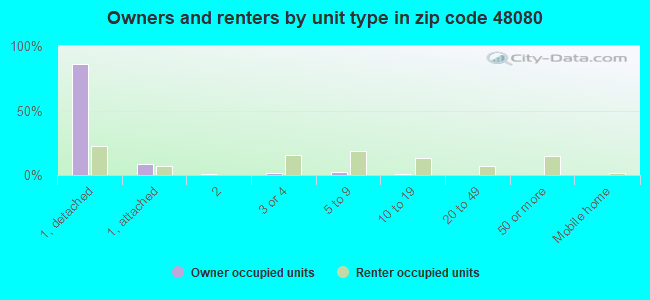
Houses and condos: 11,362 Renter-occupied apartments: 2,285
% of renters here:
20%
State:
27%
March 2022 cost of living index in zip code 48080: 95.6 (near average, U.S. average is 100)
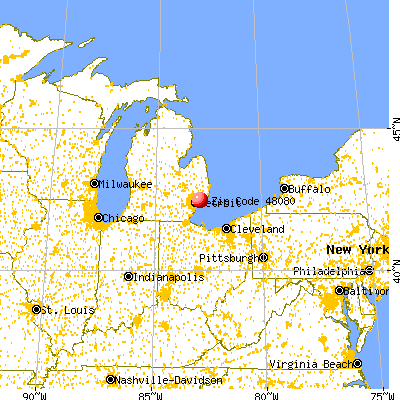
Land area: 4.4 sq. mi. Water area: 0.7 sq. mi.
Population density: 5,035 people per square mile
(average).
OSM Map
General Map
Google Map
MSN Map
OSM Map
General Map
Google Map
MSN Map
OSM Map
General Map
Google Map
MSN Map
OSM Map
General Map
Google Map
MSN Map
Please wait while loading the map...
Real estate property taxes paid for housing units in 2022:
This zip code:
1.4% ($2,820)
Michigan:
1.2% ($2,746)
Median real estate property taxes paid for housing units with mortgages in 2022: $3,126 (1.5%) Median real estate property taxes paid for housing units with no mortgage in 2022: $2,475 (1.4%)
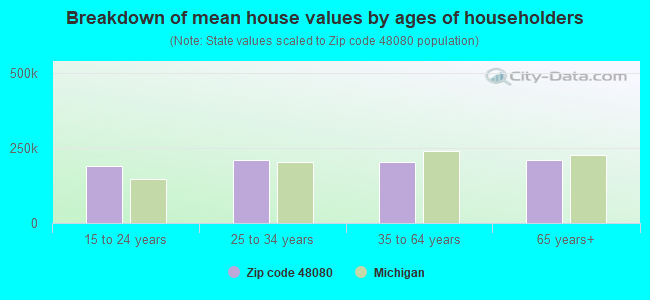
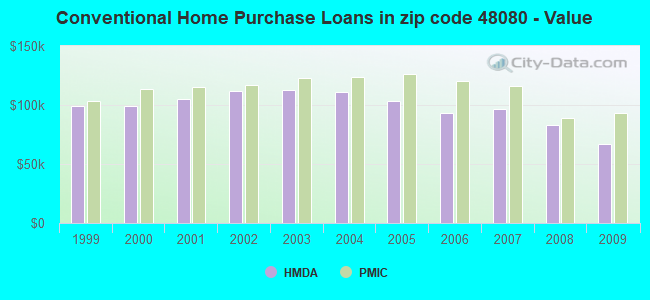
Estimated median house/condo value in 2022: $195,053
48080:
$195,053
Michigan:
$224,400
According to our research of Michigan and other state lists, there were 40 registered sex offenders living in 48080 zip code as of April 26, 2024. The ratio of all residents to sex offenders in zip code 48080 is 568 to 1. The ratio of registered sex offenders to all residents in this zip code is lower than the state average.
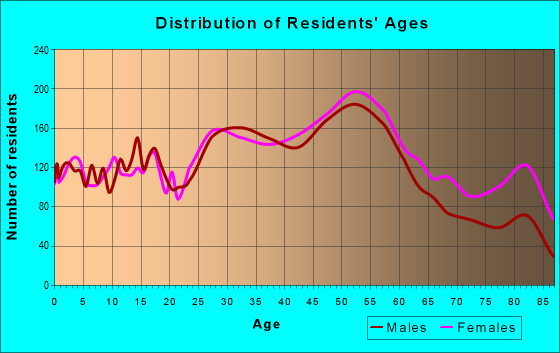
Median resident age:
This zip code:
44.1 years
Michigan median age:
40.3 years
Average household size:
This zip code:
1.9 people
Michigan:
2.4 people
Averages for the 2020 tax year for zip code 48080, filed in 2021:
Average Adjusted Gross Income (AGI) in 2020: $58,053 (Individual Income Tax Returns)
Here:
$58,053
State:
$68,945
Salary/wage: $52,480 (reported on 75.4% of returns)
Here:
$52,480
State:
$57,142
(% of AGI for various income ranges: 955.1% for AGIs below $25k, 3505.3% for AGIs $25k-50k, 6463.2% for AGIs $50k-75k, 9457.4% for AGIs $75k-100k, 17335.8% for AGIs $100k-200k, 61853.8% for AGIs over 200k)
Taxable interest for individuals: $1,101 (reported on 29.9% of returns)
This zip code:
$1,101
Michigan:
$1,630
(% of AGI for various income ranges: 25.3% for AGIs below $25k, 24.5% for AGIs $25k-50k, 33.0% for AGIs $50k-75k, 49.4% for AGIs $75k-100k, 111.0% for AGIs $100k-200k, 1288.8% for AGIs over 200k)
Ordinary dividends: $4,736 (reported on 19.1% of returns)
Here:
$4,736
State:
$6,972
(% of AGI for various income ranges: 39.2% for AGIs below $25k, 52.0% for AGIs $25k-50k, 104.8% for AGIs $50k-75k, 183.5% for AGIs $75k-100k, 380.7% for AGIs $100k-200k, 3217.5% for AGIs over 200k)
Net capital gain/loss in AGI: +$12,352 (reported on 17.0% of returns)
Here:
+$12,352
State:
+$20,064
(% of AGI for various income ranges: 4.6% for AGIs below $25k, 31.9% for AGIs $25k-50k, 62.0% for AGIs $50k-75k, 176.1% for AGIs $75k-100k, 521.5% for AGIs $100k-200k, 24045.0% for AGIs over 200k)
Profit/loss from business: +$9,365 (reported on 13.9% of returns)
Here:
+$9,365
State:
+$11,172
(% of AGI for various income ranges: 91.2% for AGIs below $25k, 86.7% for AGIs $25k-50k, 158.5% for AGIs $50k-75k, 231.6% for AGIs $75k-100k, 465.6% for AGIs $100k-200k, 4382.5% for AGIs over 200k)
Taxable individual retirement arrangement distribution: $16,266 (reported on 10.0% of returns)
48080:
$16,266
Michigan:
$19,803
(% of AGI for various income ranges: 73.6% for AGIs below $25k, 123.3% for AGIs $25k-50k, 206.4% for AGIs $50k-75k, 373.8% for AGIs $75k-100k, 692.4% for AGIs $100k-200k, 3670.0% for AGIs over 200k)
Self-employed (Keogh) retirement plans: $15,050 (reported on 0.3% of returns)
48080:
$15,050
Michigan:
$25,132
(% of AGI for various income ranges: 66.2% for AGIs $100k-200k)
Total itemized deductions: $26,449 (reported on 6.4% of returns)
Here:
$26,449
State:
$34,117
(% of AGI for various income ranges: 53.8% for AGIs below $25k, 110.4% for AGIs $25k-50k, 238.5% for AGIs $50k-75k, 341.6% for AGIs $75k-100k, 678.7% for AGIs $100k-200k, 5695.0% for AGIs over 200k)
Charity contributions: $6,520 (reported on 4.6% of returns)
Here:
$6,520
State:
$13,548
(% of AGI for various income ranges: 3.6% for AGIs below $25k, 17.1% for AGIs $25k-50k, 28.7% for AGIs $50k-75k, 53.0% for AGIs $75k-100k, 152.2% for AGIs $100k-200k, 1255.0% for AGIs over 200k)
Taxes paid: $7,170 (reported on 6.3% of returns)
48080:
$7,170
State:
$7,972
(% of AGI for various income ranges: 8.0% for AGIs below $25k, 23.3% for AGIs $25k-50k, 76.1% for AGIs $50k-75k, 114.4% for AGIs $75k-100k, 216.2% for AGIs $100k-200k, 991.2% for AGIs over 200k)
Earned income credit: $1,801 (reported on 10.3% of returns)
Here:
$1,801
State:
$2,251
(% of AGI for various income ranges: 56.5% for AGIs below $25k, 41.2% for AGIs $25k-50k, 0.8% for AGIs $50k-75k)
Percentage of individuals using paid preparers for their 2020 taxes: 92.1%
Here:
92%
State:
93%
(% for various income ranges: 91.4% for AGIs below $25k, 92.2% for AGIs $25k-50k, 92.0% for AGIs $50k-75k, 93.7% for AGIs $75k-100k, 92.4% for AGIs $100k-200k, 92.6% for AGIs over 200k)
Averages for the 2012 tax year for zip code 48080, filed in 2013:
Average Adjusted Gross Income (AGI) in 2012: $46,027 (Individual Income Tax Returns)
Here:
$46,027
State:
$55,609
Salary/wage: $43,260 (reported on 76.9% of returns)
Here:
$43,260
State:
$46,782
(% of AGI for various income ranges: 60.5% for AGIs below $25k, 74.3% for AGIs $25k-50k, 76.0% for AGIs $50k-75k, 78.1% for AGIs $75k-100k, 75.6% for AGIs $100k-200k, 54.2% for AGIs over 200k)
Taxable interest for individuals: $1,186 (reported on 34.5% of returns)
This zip code:
$1,186
Michigan:
$1,491
(% of AGI for various income ranges: 1.8% for AGIs below $25k, 0.8% for AGIs $25k-50k, 0.9% for AGIs $50k-75k, 0.8% for AGIs $75k-100k, 0.7% for AGIs $100k-200k, 0.6% for AGIs over 200k)
Ordinary dividends: $4,518 (reported on 21.4% of returns)
Here:
$4,518
State:
$6,225
(% of AGI for various income ranges: 2.9% for AGIs below $25k, 1.3% for AGIs $25k-50k, 1.5% for AGIs $50k-75k, 1.6% for AGIs $75k-100k, 2.0% for AGIs $100k-200k, 5.3% for AGIs over 200k)
Net capital gain/loss in AGI: +$1,950 (reported on 16.1% of returns)
Here:
+$1,950
State:
+$9,326
(% of AGI for various income ranges: 0.1% for AGIs $25k-50k, 0.3% for AGIs $50k-75k, 0.5% for AGIs $75k-100k, 1.0% for AGIs $100k-200k, 3.8% for AGIs over 200k)
Profit/loss from business: +$9,462 (reported on 12.9% of returns)
Here:
+$9,462
State:
+$11,523
(% of AGI for various income ranges: 8.2% for AGIs below $25k, 2.5% for AGIs $25k-50k, 1.6% for AGIs $50k-75k, 1.6% for AGIs $75k-100k, 1.8% for AGIs $100k-200k, 3.2% for AGIs over 200k)
Taxable individual retirement arrangement distribution: $12,479 (reported on 13.3% of returns)
48080:
$12,479
Michigan:
$15,298
(% of AGI for various income ranges: 4.4% for AGIs below $25k, 2.8% for AGIs $25k-50k, 3.0% for AGIs $50k-75k, 2.9% for AGIs $75k-100k, 4.5% for AGIs $100k-200k, 4.8% for AGIs over 200k)
Self-employment retirement plans: $14,300 (reported on 0.3% of returns)
48080:
$14,300
Michigan:
$20,834
Total itemized deductions: $16,841 (21% of AGI, reported on 29.5% of returns)
Here:
$16,841
State:
$21,628
Here:
20.9% of AGI
State:
18.4% of AGI
(% of AGI for various income ranges: 9.8% for AGIs below $25k, 9.5% for AGIs $25k-50k, 10.4% for AGIs $50k-75k, 10.5% for AGIs $75k-100k, 11.9% for AGIs $100k-200k, 13.4% for AGIs over 200k)
Charity contributions: $2,558 (reported on 25.0% of returns)
Here:
$2,558
State:
$4,225
(% of AGI for various income ranges: 0.8% for AGIs below $25k, 1.0% for AGIs $25k-50k, 1.5% for AGIs $50k-75k, 1.4% for AGIs $75k-100k, 1.8% for AGIs $100k-200k, 1.7% for AGIs over 200k)
Taxes paid: $6,040 (reported on 29.5% of returns)
48080:
$6,040
State:
$8,327
(% of AGI for various income ranges: 2.1% for AGIs below $25k, 2.7% for AGIs $25k-50k, 3.5% for AGIs $50k-75k, 3.9% for AGIs $75k-100k, 5.1% for AGIs $100k-200k, 6.1% for AGIs over 200k)
Earned income credit: $1,971 (reported on 14.1% of returns)
Here:
$1,971
State:
$2,306
(% of AGI for various income ranges: 4.6% for AGIs below $25k, 0.7% for AGIs $25k-50k)
Percentage of individuals using paid preparers for their 2012 taxes: 57.7%
Here:
58%
State:
57%
(% for various income ranges: 55.1% for AGIs below $25k, 57.3% for AGIs $25k-50k, 60.0% for AGIs $50k-75k, 59.2% for AGIs $75k-100k, 63.0% for AGIs $100k-200k, 78.6% for AGIs over 200k)
Averages for the 2004 tax year for zip code 48080, filed in 2005:
Average Adjusted Gross Income (AGI) in 2004: $43,767 (Individual Income Tax Returns)
Here:
$43,767
State:
$48,204
Salary/wage: $41,873 (reported on 77.0% of returns)
Here:
$41,873
State:
$42,791
(% of AGI for various income ranges: 74.7% for AGIs below $10k, 56.0% for AGIs $10k-25k, 75.3% for AGIs $25k-50k, 79.8% for AGIs $50k-75k, 82.5% for AGIs $75k-100k, 66.0% for AGIs over 100k)
Taxable interest for individuals: $2,341 (reported on 57.2% of returns)
This zip code:
$2,341
Michigan:
$1,725
(% of AGI for various income ranges: 10.9% for AGIs below $10k, 5.0% for AGIs $10k-25k, 2.4% for AGIs $25k-50k, 1.7% for AGIs $50k-75k, 1.3% for AGIs $75k-100k, 5.0% for AGIs over 100k)
Taxable dividends: $3,427 (reported on 31.3% of returns)
Here:
$3,427
State:
$3,420
(% of AGI for various income ranges: 6.7% for AGIs below $10k, 3.6% for AGIs $10k-25k, 1.9% for AGIs $25k-50k, 1.7% for AGIs $50k-75k, 1.4% for AGIs $75k-100k, 3.7% for AGIs over 100k)
Net capital gain/loss: +$4,107 (reported on 22.9% of returns)
Here:
+$4,107
State:
+$8,532
(% of AGI for various income ranges: -3.7% for AGIs below $10k, -0.0% for AGIs $10k-25k, 0.4% for AGIs $25k-50k, 0.7% for AGIs $50k-75k, 1.0% for AGIs $75k-100k, 6.9% for AGIs over 100k)
Profit/loss from business: +$9,444 (reported on 11.1% of returns)
Here:
+$9,444
State:
+$9,547
(% of AGI for various income ranges: 7.3% for AGIs below $10k, 4.9% for AGIs $10k-25k, 2.6% for AGIs $25k-50k, 1.6% for AGIs $50k-75k, 2.0% for AGIs $75k-100k, 2.2% for AGIs over 100k)
IRA payment deduction: $2,754 (reported on 2.6% of returns)
48080:
$2,754
Michigan:
$2,875
(% of AGI for various income ranges: 0.3% for AGIs below $10k, 0.3% for AGIs $10k-25k, 0.2% for AGIs $25k-50k, 0.2% for AGIs $50k-75k, 0.1% for AGIs $75k-100k, 0.1% for AGIs over 100k)
Self-employed pension: $9,719 (reported on 0.5% of returns)
Here:
$9,719
Michigan:
$13,826
(% of AGI for various income ranges: 0.1% for AGIs $10k-25k, 0.0% for AGIs $50k-75k, 0.1% for AGIs $75k-100k, 0.3% for AGIs over 100k)
Total itemized deductions: $15,766 (23% of AGI, reported on 42.0% of returns)
Here:
$15,766
State:
$18,509
Here:
22.9% of AGI
State:
20.7% of AGI
(% of AGI for various income ranges: 15.8% for AGIs below $10k, 13.9% for AGIs $10k-25k, 14.5% for AGIs $25k-50k, 16.1% for AGIs $50k-75k, 15.2% for AGIs $75k-100k, 15.1% for AGIs over 100k)
Charity contributions deductions: $2,147 (3% of AGI, reported on 38.1% of returns)
Here:
$2,147
State:
$3,365
Here:
3.0% of AGI
State:
3.6% of AGI
(% of AGI for various income ranges: 0.8% for AGIs below $10k, 1.3% for AGIs $10k-25k, 1.6% for AGIs $25k-50k, 1.9% for AGIs $50k-75k, 2.1% for AGIs $75k-100k, 2.0% for AGIs over 100k)
Total tax: $5,909 (reported on 79.5% of returns)
48080:
$5,909
State:
$7,691
(% of AGI for various income ranges: 2.6% for AGIs below $10k, 4.2% for AGIs $10k-25k, 7.7% for AGIs $25k-50k, 9.7% for AGIs $50k-75k, 10.9% for AGIs $75k-100k, 16.7% for AGIs over 100k)
Earned income credit: $1,425 (reported on 7.9% of returns)
Here:
$1,425
State:
$1,737
Percentage of individuals using paid preparers for their 2004 taxes: 60.9%
Here:
61%
State:
60%
(% for various income ranges: 57.1% for AGIs below $10k, 61.5% for AGIs $10k-25k, 60.3% for AGIs $25k-50k, 61.7% for AGIs $50k-75k, 61.9% for AGIs $75k-100k, 67.8% for AGIs over 100k)
Likely homosexual households (counted as self-reported same-sex unmarried-partner households)
Lesbian couples: 0.1% of all households
Gay men: 0.4% of all households
Household received Food Stamps/SNAP in the past 12 months: 892 Household did not receive Food Stamps/SNAP in the past 12 months: 10,268
Women who had a birth in the past 12 months: 238 (222 now married, 20 unmarried) Women who did not have a birth in the past 12 months: 4,459 (1,677 now married, 2,784 unmarried)
Housing units in zip code 48080 with a mortgage: 5,323 (355 second mortgage, 19 home equity loan, 292 both second mortgage and home equity loan) Houses without a mortgage: 232
Median monthly owner costs for units with a mortgage: $1,286 Median monthly owner costs for units without a mortgage: $509
Residents with income below the poverty level in 2022:
This zip code:
8.8%
Whole state:
13.4%
Residents with income below 50% of the poverty level in 2022:
This zip code:
3.9%
Whole state:
6.9%
Median number of rooms in houses and condos:
Here:
5.7
State:
6.5
Median number of rooms in apartments:
Here:
3.9
State:
4.3
Notable locations in this zip code not listed on our city pages
Notable locations in zip code 48080: Jefferson Beach Marina (A), Saint John Family Medical Center (B), Henry Ford Medical Center - Saint Clair Shores and East Jefferson (C), Bon Secours Rehabilitation Services (D), Saint Clair Shores Fire Department Station 3 South (E). Display/hide their locations on the map
Churches in zip code 48080 include: First Bethany United Church of Christ (A), Saint Clair Shores Assembly of God Church (B), Bethel Baptist Church (C), First United Methodist Church (D), Saint Spyridon Greek Orthodox Church (E), Assumption Greek Orthodox Church (F), Heritage Presbyterian Church (G), Saint Lucys Catholic Church (H), Saint Joan of Arc Parish Center (I). Display/hide their locations on the map
Parks in zip code 48080 include: Lakefront Park (1), Blossom Health Inn Historical Marker (2), Milk River Settlement Historical Marker (3), Shoreline Interurban Railway Historical Marker (4), Brys Park (5), Saint Clair Shores Park (6). Display/hide their locations on the map
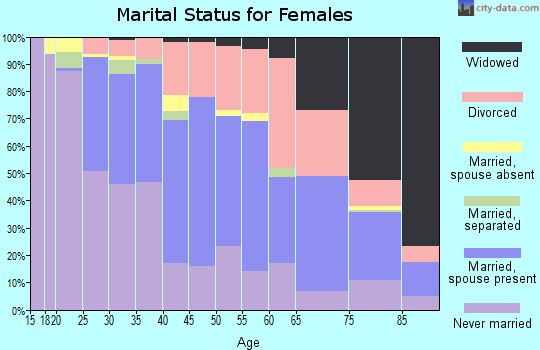
2,133 married couples with children.
910 single-parent households (294 men, 616 women).
92.9% of residents of 48080 zip code speak English at home.
1.2% of residents speak Spanish at home (81% very well, 16% well, 3% not well).
4.7% of residents speak other Indo-European language at home (82% very well, 14% well, 4% not well).
0.7% of residents speak Asian or Pacific Island language at home (82% very well, 18% not well).
0.5% of residents speak other language at home (68% very well, 21% well, 11% not well).
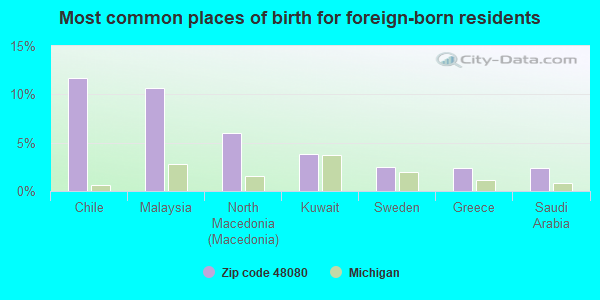
Foreign born population: 1,256 (5.7%) (73.7% of them are naturalized citizens)
This zip code:
5.7%
Whole state:
6.9%
12%Chile
11%Malaysia
6%North Macedonia (Macedonia)
4%Kuwait
2%Sweden
2%Greece
2%Saudi Arabia
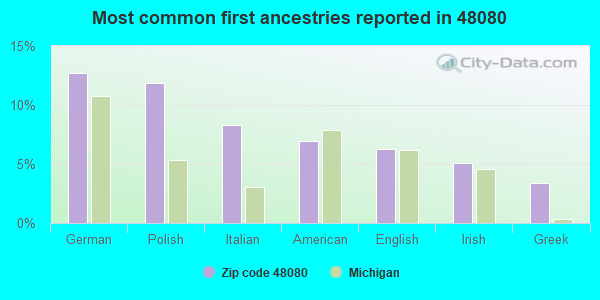
13%German
12%Polish
8%Italian
7%American
6%English
5%Irish
3%Greek
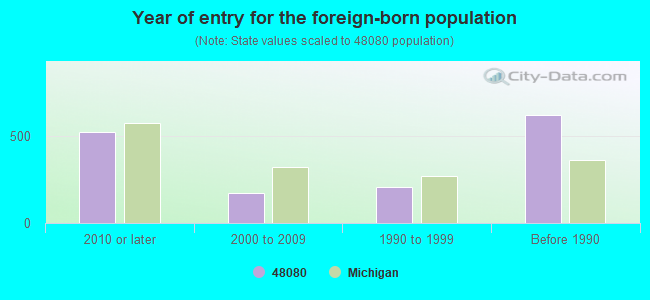
Year of entry for the foreign-born population
5252010 or later
1722000 to 2009
2091990 to 1999
622Before 1990
Major facilities with environmental interests located in this zip code:
GRINNELL SCREW PRD (22955 INDUSTRIAL DR in SAINT CLAIR SHORES, MI)
AIR MINOR (AIRS/AFS) (Resource Conservation and Recovery Act (tracking hazardous waste)) Business SIC classification: SCREW MACHINE PRODUCTS Organizations: GRINNELL SCREW PRODUCTS COMPANY INC (CONTACT/OPERATOR)
, ANDREW WISNIEWSKI (CONTACT/OPERATOR)
Alternative names: GRINNELL SCREW PRODUCTS CO INC
AVALON ELEMENTARY SCHOOL (20000 AVALON STREET in ST. CLAIR SHORES, MI)
(National Center for Education Statistics) - STATE ID-00155 Organizations: SOUTH LAKE SCHOOLS (SCHOOL DISTRICT)
ELMWOOD ELEMENTARY SCHOOL (22700 CALIFORNIA STREET in ST. CLAIR SHORES, MI)
(National Center for Education Statistics) - STATE ID-01127 Organizations: SOUTH LAKE SCHOOLS (SCHOOL DISTRICT)
CHAPATON RTB (23001 NINE MILE ROAD in SAINT CLAIR SHORES, MI)
National Pollutant Discharge Elimination System NON-MAJOR (Tracking pollutant discharge elimination systems) - permit (Resource Conservation and Recovery Act (tracking hazardous waste)) Business SIC classification: SEWERAGE SYSTEMS Organizations: 8 1/2 MILE DRAIN DRAINAGE DIST (CONTACT/OWNER)
Alternative names: MACOMB CNTY PW CHAPATON
ALL SEASONS PAINTING CO INC (21600 GRAND LAKE in SAINT CLAIR SHORES, MI)
AMOCO OIL CO 5407 COLONIAL (23800 E JEFFERSON in SAINT CLAIR SHORES, MI)
(Resource Conservation and Recovery Act (tracking hazardous waste)) Organizations: AMOCO OIL COMPANY (CONTACT/OWNER)
AUTO MARKETING INC (31080 HARPER in SAINT CLAIR SHORES, MI)
(Resource Conservation and Recovery Act (tracking hazardous waste))
BCP LLC (22500 EAST NINE MILE RD in SAINT CLAIR SHORES, MI)
(Resource Conservation and Recovery Act (tracking hazardous waste))
BOND CLEANERS (25009 LITTLE MACK in SAINT CLAIR SHORES, MI)
(Resource Conservation and Recovery Act (tracking hazardous waste)) Organizations: MINAUDO PETE (CONTACT/OWNER)
DEWITT TOOL & MFG (20315 E NINE MILE RD in SAINT CLAIR SHORES, MI)
(Resource Conservation and Recovery Act (tracking hazardous waste)) Organizations: JAMES ROBB (CONTACT/OWNER)
FINAL FINISH RESTORATION INC (22930 INDUSTRIAL DR EAST in SAINT CLAIR SHORES, MI)
(Resource Conservation and Recovery Act (tracking hazardous waste))
GREAT LAKES POWER PRODUCTS (2300 INDUSTRIAL DRIVE E in SAINT CLAIR SHORES, MI)
Conditionally Exempt Small Quantity Generators, less than 100 kg/month of hazardous waste (Resource Conservation and Recovery Act (tracking hazardous waste)) Business NAICS classification: INSTRUMENTS AND RELATED PRODUCTS MANUFACTURING FOR MEASURING, DISPLAYING, AND CONTROLLING INDUSTRIAL PROCESS VARIABLES. Organizations: BILL HARTZ (CONTACT/OWNER)
EASTLAND CLEANERS (21915 HARPER in SAINT CLAIR SHORES, MI)
(Resource Conservation and Recovery Act (tracking hazardous waste))
Housing units lacking complete plumbing facilities: 0.2% Housing units lacking complete kitchen facilities: 1.4%
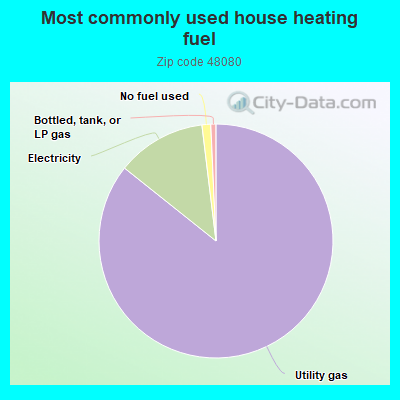
85.2%Utility gas
12.3%Electricity
1.2%No fuel used
0.7%Bottled, tank, or LP gas
Population in 1990: 25,179.
Place of birth for U.S.-born residents:
This state: 17,951
Northeast: 532
Midwest: 667
South: 665
West: 655
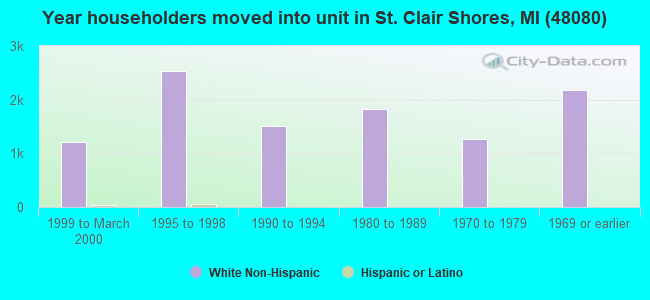
66% of the 48080 zip code residents lived in the same house 5 years ago. Out of people who lived in different houses, 51% lived in this county. Out of people who lived in different counties, 50% lived in Michigan.
91% of the 48080 zip code residents lived in the same house 1 year ago. Out of people who lived in different houses, 55% moved from this county. Out of people who lived in different houses, 29% moved from different county within same state. Out of people who lived in different houses, 15% moved from different state. Out of people who lived in different houses, 0% moved from abroad.
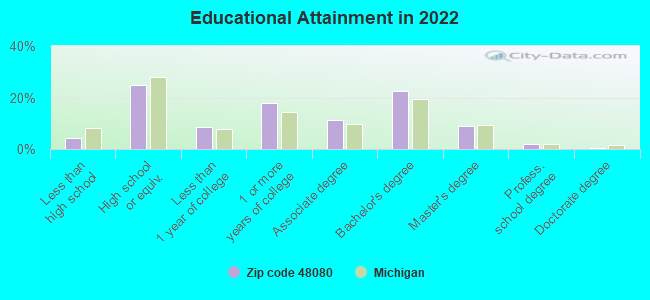
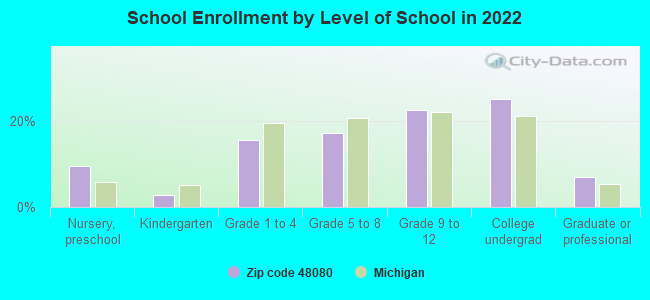
Private vs. public school enrollment:
Students in private schools in grades 1 to 8 (elementary and middle school): 146
Here:
12.6%
Michigan:
12.4%
Students in private schools in grades 9 to 12 (high school): 27
Here:
3.4%
Michigan:
9.8%
Students in private undergraduate colleges: 77
Here:
8.6%
Michigan:
14.9%
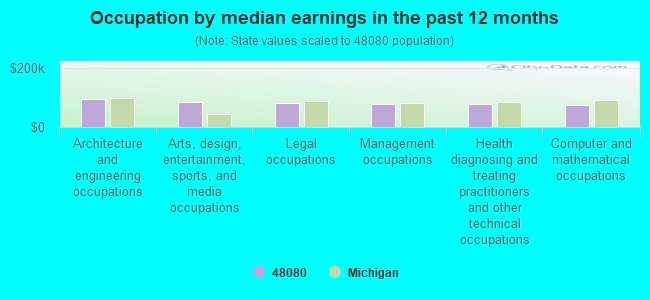
Occupation by median earnings in the past 12 months ($)
94,922Architecture and engineering occupations
84,604Arts, design, entertainment, sports, and media occupations
82,470Legal occupations
78,017Management occupations
76,903Health diagnosing and treating practitioners and other technical occupations
75,757Computer and mathematical occupations
Companies with federal contracts located in this zip code:
ALEXANDER & HORNUNG INC (20643 STEPHENS ST in SAINT CLAIR SH, MI; small business) : $69,098 in 7 contractsfrom 2004 to 2006
Contracts for Food Items For Resale, Non-Food Items For Resale by Defense Commissary Agency Signed by year:2000: $0; 2001: $0; 2002: $0; 2003: $0; 2004: $18,345; 2005: $34,677; 2006: $16,076.
Biggest contracts:
$18,345 with Defense Commissary Agency for Food Items For Resale. Signed on 2004-10-01. Completion date: 2005-02-28.
$17,631 with Defense Commissary Agency for Non-Food Items For Resale. Signed on 2005-10-01. Completion date: 2005-12-31.
$16,076, same as above.Signed on 2006-01-01. Completion date: 2006-03-31.
$7,032 with Defense Commissary Agency for Food Items For Resale. Signed on 2005-04-01. Completion date: 2005-07-31.
GRAPHITECH, INC (1711 SHORE CLUB DR in SAINT CLAIR SH, MI; small business)
$13,000 with Air Force for Education Services. Taking place in OH. Signed on 2004-07-08. Completion date: 2005-06-11.
HOMEOWNERS MODERNIZATION AND C (21921 MACK in ST CLAIR SHORE, MI; small business) : $0 in 2 contractsin 2000
$69,285 with Army for Construction of Structures and Facilities -- Other Administrative Facilities and Service Buildings. Signed on 2000-06-30. Completion date: 2000-09-12.
-$69,285, same as above.Signed on 2000-10-12. Completion date: 2000-10-11.
Top industries in this zip code by the number of employees in 2005:
2002 - 2018 National Fire Incident Reporting System (NFIRS) incidents
According to the data from the years 2002 - 2018 the average number of fire incidents per year is 44. The highest number of reported fires - 61 took place in 2018, and the least - 27 in 2012. The data has a rising trend.
When looking into fire subcategories, the most incidents belonged to: Structure Fires (44.8%), and Outside Fires (22.2%).
Fire incident types reported to NFIRS in Zip Code 48080


 Nearest zip codes: 48081, 48236, 48225, 48021, 48066, 48082.


 According to the data from the years 2002 - 2018 the average number of fire incidents per year is 44. The highest number of reported fires - 61 took place in 2018, and the least - 27 in 2012. The data has a rising trend.
 When looking into fire subcategories, the most incidents belonged to: Structure Fires (44.8%), and Outside Fires (22.2%).