Races in El Paso, Wisconsin (WI) Detailed Stats
Ancestries, Foreign-born residents, place of birth

Recent posts about races in El Paso, Wisconsin on our local forum with over 2,400,000 registered users:
 | Does Madison have a big latino Population? (19 replies) |
| Why the hatred of Chicagoans? (105 replies) |
| Racial Tensions in Milwaukee? (181 replies) |
| What do you think? (32 replies) |
0.3% of El Paso, WI residents are foreign-born , which is 1625.0% less than the foreign-born rate of 5.0% across the entire state of Wisconsin.
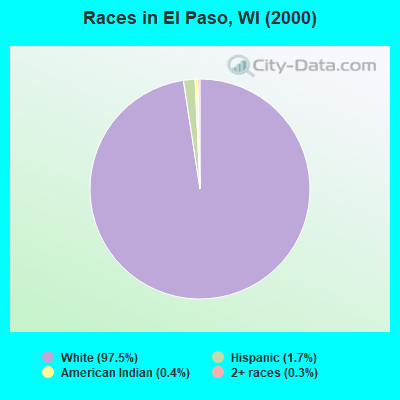
Race distribution in El Paso

- 67397.5%White alone
- 121.7%Hispanic
- 30.4%American Indian alone
- 20.3%Two or more races
2000
2022
-
- 4,681,63087.3%White alone
- 300,2455.6%Black alone
- 192,9213.6%Hispanic
- 87,9951.6%Asian alone
- 51,9211.0%Two or more races
- 43,9800.8%American Indian alone
- 3,6370.07%Other race alone
- 1,3460.03%Native Hawaiian and Other
Pacific Islander alone

-
- 4,654,03179.0%White alone
- 447,0227.6%Hispanic
- 345,6785.9%Black alone
- 217,5323.7%Two or more races
- 172,2422.9%Asian alone
- 33,7620.6%American Indian alone
- 19,6800.3%Other race alone
- 2,5920.04%Native Hawaiian and Other
Pacific Islander alone

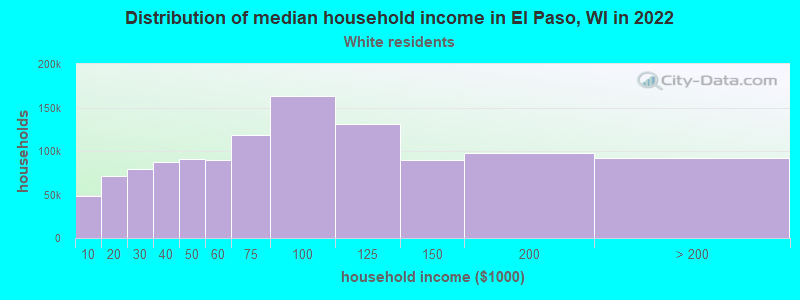
Income and house value in El Paso
- Median household income in 2022
- $83,905White non-Hispanic householders
- Median 2022 house value
- $289,675White Non-Hispanic householders
Household income for White non-Hispanic householders
Foreign-born residents in El Paso
2 residents are foreign born
| This city: | 0.3% |
| Wisconsin: | 3.6% |
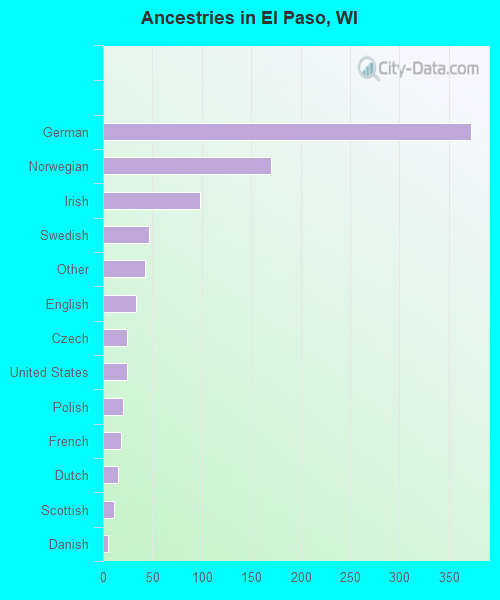
Ancestries in El Paso

- 37241.8%German
- 17019.1%Norwegian
- 9811.0%Irish
- 475.3%Swedish
- 434.8%Other
- 333.7%English
- 242.7%Czech
- 242.7%United States
- 202.2%Polish
- 182.0%French
- 151.7%Dutch
- 111.2%Scottish
- 50.6%Danish
- 30.3%Hungarian
- 20.2%French Canadian
- 20.2%Italian
- 20.2%Welsh
- 10.1%Scotch-Irish
Zip codes: 54011.