Races in Elfers, Florida (FL) Detailed Stats
Data:
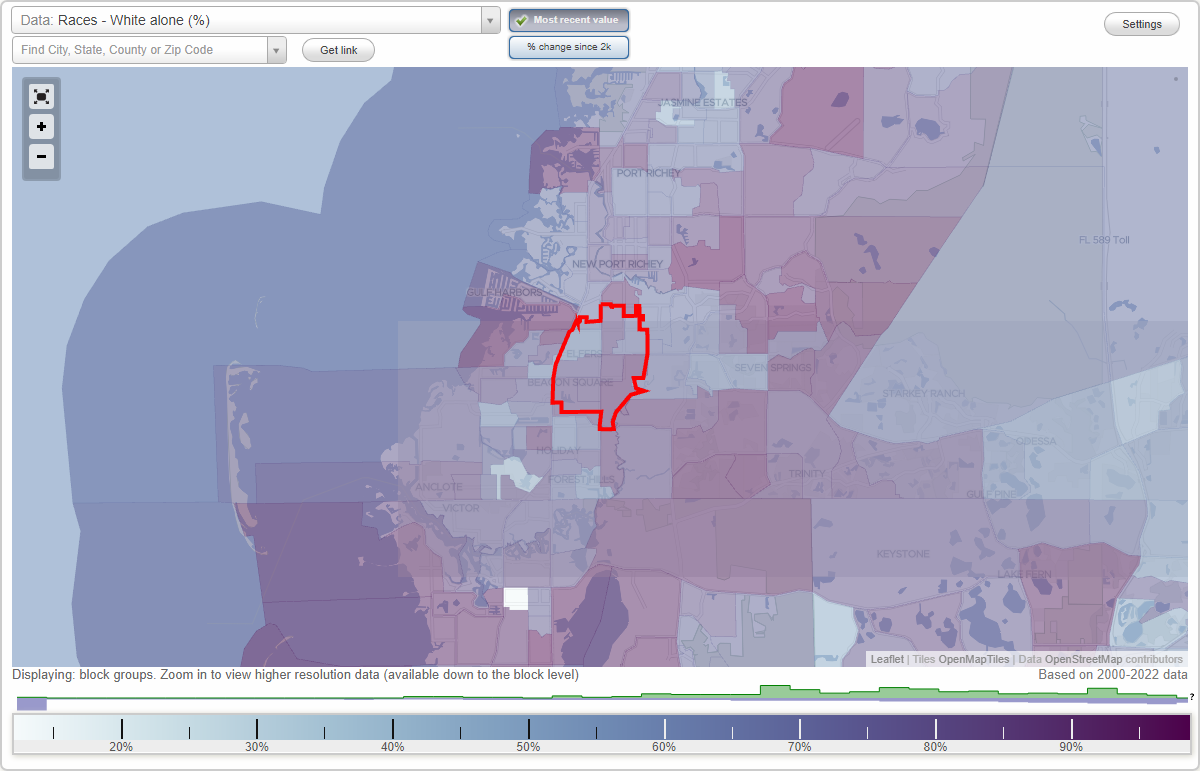
Races - White alone (%)
Races - White alone (% change since 2000)
Races - Black alone (%)
Races - Black alone (% change since 2000)
Races - American Indian alone (%)
Races - American Indian alone (% change since 2000)
Races - Asian alone (%)
Races - Asian alone (% change since 2000)
Races - Hispanic (%)
Races - Hispanic (% change since 2000)
Races - Native Hawaiian and Other Pacific Islander alone (%)
Races - Native Hawaiian and Other Pacific Islander alone (% change since 2000)
Races - Two or more races(%)
Races - Two or more races(% change since 2000)
Races - Other race alone (%)
Races - Other race alone (% change since 2000)
Racial diversity
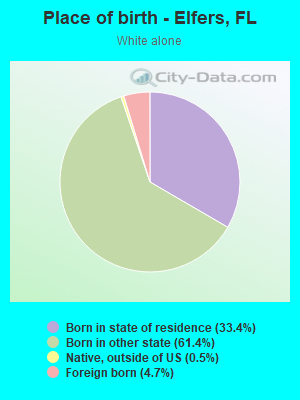
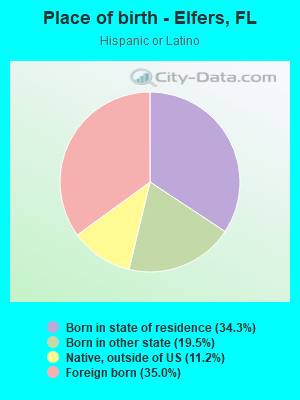
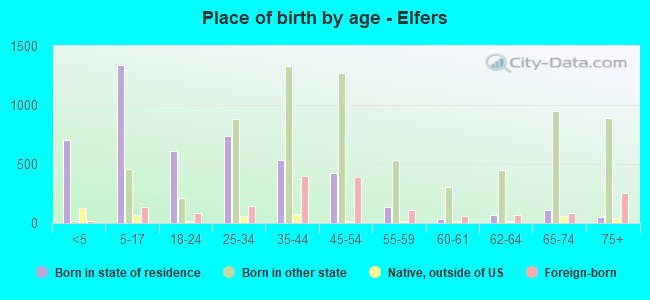
Place of birth - Born in state of residence (%)
Place of birth - Born in state of residence (%) - White
Place of birth - Born in state of residence (%) - Black or African American
Place of birth - Born in state of residence (%) - Asian
Place of birth - Born in state of residence (%) - Hispanic or Latino
Place of birth - Born in state of residence (%) - American Indian and Alaska Native
Place of birth - Born in state of residence (%) - Multirace
Place of birth - Born in state of residence (%) - Other Race
Place of birth - Born in other state (%)
Place of birth - Born in other state (%) - White
Place of birth - Born in other state (%) - Black or African American
Place of birth - Born in other state (%) - Asian
Place of birth - Born in other state (%) - Hispanic or Latino
Place of birth - Born in other state (%) - American Indian and Alaska Native
Place of birth - Born in other state (%) - Multirace
Place of birth - Born in other state (%) - Other Race
Place of birth - Native, outside of US (%)
Place of birth - Native, outside of US (%) - White
Place of birth - Native, outside of US (%) - Black or African American
Place of birth - Native, outside of US (%) - Asian
Place of birth - Native, outside of US (%) - Hispanic or Latino
Place of birth - Native, outside of US (%) - American Indian and Alaska Native
Place of birth - Native, outside of US (%) - Multirace
Place of birth - Native, outside of US (%) - Other Race
Place of birth - Foreign born (%)
Place of birth - Foreign born (%) - White
Place of birth - Foreign born (%) - Black or African American
Place of birth - Foreign born (%) - Asian
Place of birth - Foreign born (%) - Hispanic or Latino
Place of birth - Foreign born (%) - American Indian and Alaska Native
Place of birth - Foreign born (%) - Multirace
Place of birth - Foreign born (%) - Other Race
Residents speaking English at home (%)
Residents speaking English at home - Born in the United States (%)
Residents speaking English at home - Native, born elsewhere (%)
Residents speaking English at home - Foreign born (%)
Residents speaking Spanish at home (%)
Residents speaking Spanish at home - Born in the United States (%)
Residents speaking Spanish at home - Native, born elsewhere (%)
Residents speaking Spanish at home - Foreign born (%)
Residents speaking other language at home (%)
Residents speaking other language at home - Born in the United States (%)
Residents speaking other language at home - Native, born elsewhere (%)
Residents speaking other language at home - Foreign born (%)
Marital status - Never married (%)
Marital status - Now married (%)
Marital status - Separated (%)
Marital status - Widowed (%)
Marital status - Divorced (%)
Ancestries Reported - Arab (%)
Ancestries Reported - Czech (%)
Ancestries Reported - Danish (%)
Ancestries Reported - Dutch (%)
Ancestries Reported - English (%)
Ancestries Reported - French (%)
Ancestries Reported - French Canadian (%)
Ancestries Reported - German (%)
Ancestries Reported - Greek (%)
Ancestries Reported - Hungarian (%)
Ancestries Reported - Irish (%)
Ancestries Reported - Italian (%)
Ancestries Reported - Lithuanian (%)
Ancestries Reported - Norwegian (%)
Ancestries Reported - Polish (%)
Ancestries Reported - Portuguese (%)
Ancestries Reported - Russian (%)
Ancestries Reported - Scotch-Irish (%)
Ancestries Reported - Scottish (%)
Ancestries Reported - Slovak (%)
Ancestries Reported - Subsaharan African (%)
Ancestries Reported - Swedish (%)
Ancestries Reported - Swiss (%)
Ancestries Reported - Ukrainian (%)
Ancestries Reported - United States (%)
Ancestries Reported - Welsh (%)
Ancestries Reported - West Indian (%)
Ancestries Reported - Other (%)
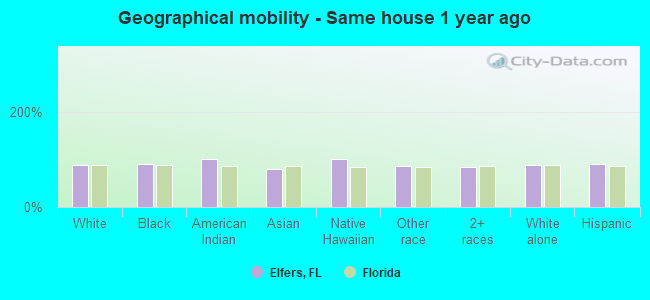
Geographical mobility - Same house 1 year ago (%)
Geographical mobility - Same house 1 year ago (%) - White
Geographical mobility - Same house 1 year ago (%) - Black or African American
Geographical mobility - Same house 1 year ago (%) - Asian
Geographical mobility - Same house 1 year ago (%) - Hispanic or Latino
Geographical mobility - Same house 1 year ago (%) - American Indian and Alaska Native
Geographical mobility - Same house 1 year ago (%) - Multirace
Geographical mobility - Same house 1 year ago (%) - Other Race
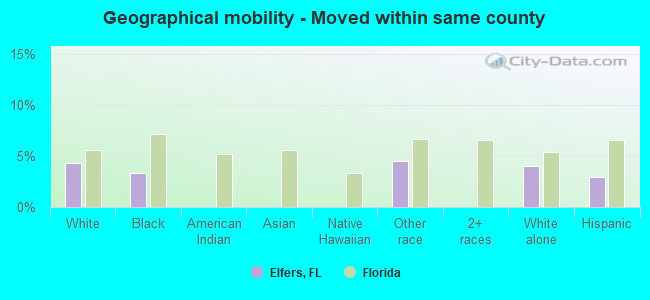
Geographical mobility - Moved within same county (%)
Geographical mobility - Moved within same county (%) - White
Geographical mobility - Moved within same county (%) - Black or African American
Geographical mobility - Moved within same county (%) - Asian
Geographical mobility - Moved within same county (%) - Hispanic or Latino
Geographical mobility - Moved within same county (%) - American Indian and Alaska Native
Geographical mobility - Moved within same county (%) - Multirace
Geographical mobility - Moved within same county (%) - Other Race
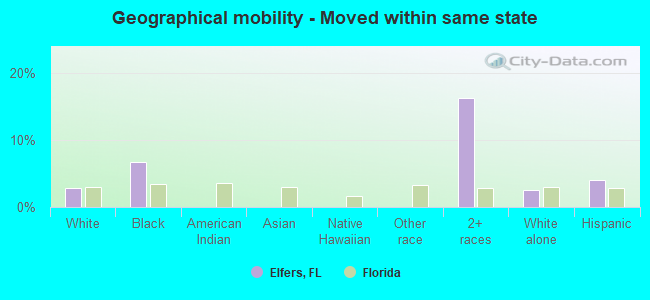
Geographical mobility - Moved from different county within same state (%)
Geographical mobility - Moved from different county within same state (%) - White
Geographical mobility - Moved from different county within same state (%) - Black or African American
Geographical mobility - Moved from different county within same state (%) - Asian
Geographical mobility - Moved from different county within same state (%) - Hispanic or Latino
Geographical mobility - Moved from different county within same state (%) - American Indian and Alaska Native
Geographical mobility - Moved from different county within same state (%) - Multirace
Geographical mobility - Moved from different county within same state (%) - Other Race
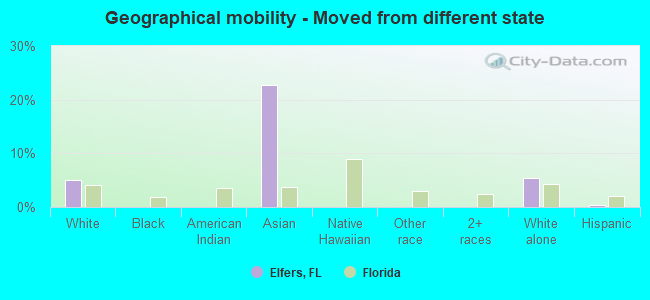
Geographical mobility - Moved from different state (%)
Geographical mobility - Moved from different state (%) - White
Geographical mobility - Moved from different state (%) - Black or African American
Geographical mobility - Moved from different state (%) - Asian
Geographical mobility - Moved from different state (%) - Hispanic or Latino
Geographical mobility - Moved from different state (%) - American Indian and Alaska Native
Geographical mobility - Moved from different state (%) - Multirace
Geographical mobility - Moved from different state (%) - Other Race
Geographical mobility - Moved from abroad (%)
Geographical mobility - Moved from abroad (%) - White
Geographical mobility - Moved from abroad (%) - Black or African American
Geographical mobility - Moved from abroad (%) - Asian
Geographical mobility - Moved from abroad (%) - Hispanic or Latino
Geographical mobility - Moved from abroad (%) - American Indian and Alaska Native
Geographical mobility - Moved from abroad (%) - Multirace
Geographical mobility - Moved from abroad (%) - Other Race
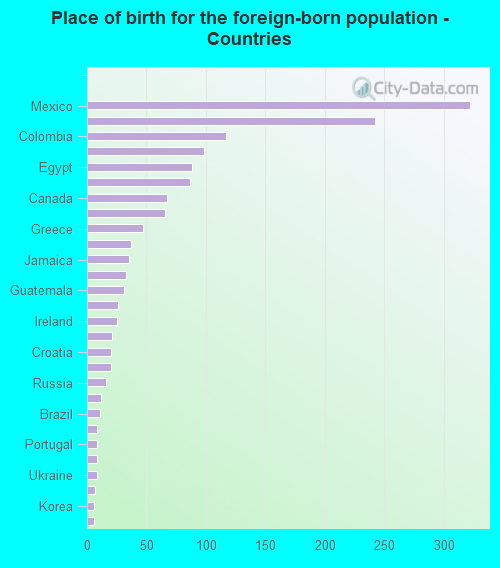
Place of birth for the foreign-born population - Ireland (%)
Place of birth for the foreign-born population - Denmark (%)
Place of birth for the foreign-born population - Norway (%)
Place of birth for the foreign-born population - Sweden (%)
Place of birth for the foreign-born population - United Kingdom (%)
Place of birth for the foreign-born population - England (%)
Place of birth for the foreign-born population - Scotland (%)
Place of birth for the foreign-born population - Other Northern Europe (%)
Place of birth for the foreign-born population - Austria (%)
Place of birth for the foreign-born population - Belgium (%)
Place of birth for the foreign-born population - France (%)
Place of birth for the foreign-born population - Germany (%)
Place of birth for the foreign-born population - Netherlands (%)
Place of birth for the foreign-born population - Switzerland (%)
Place of birth for the foreign-born population - Other Western Europe (%)
Place of birth for the foreign-born population - Greece (%)
Place of birth for the foreign-born population - Italy (%)
Place of birth for the foreign-born population - Portugal (%)
Place of birth for the foreign-born population - Spain (%)
Place of birth for the foreign-born population - Other Southern Europe (%)
Place of birth for the foreign-born population - Albania (%)
Place of birth for the foreign-born population - Belarus (%)
Place of birth for the foreign-born population - Bosnia and Herzegovina (%)
Place of birth for the foreign-born population - Bulgaria (%)
Place of birth for the foreign-born population - Croatia (%)
Place of birth for the foreign-born population - Czechoslovakia (%)
Place of birth for the foreign-born population - Hungary (%)
Place of birth for the foreign-born population - Latvia (%)
Place of birth for the foreign-born population - Lithuania (%)
Place of birth for the foreign-born population - North Macedonia (Macedonia) (%)
Place of birth for the foreign-born population - Moldova (%)
Place of birth for the foreign-born population - Poland (%)
Place of birth for the foreign-born population - Romania (%)
Place of birth for the foreign-born population - Russia (%)
Place of birth for the foreign-born population - Serbia (%)
Place of birth for the foreign-born population - Ukraine (%)
Place of birth for the foreign-born population - Other Eastern Europe (%)
Place of birth for the foreign-born population - China (%)
Place of birth for the foreign-born population - Hong Kong (%)
Place of birth for the foreign-born population - Taiwan (%)
Place of birth for the foreign-born population - Japan (%)
Place of birth for the foreign-born population - Korea (%)
Place of birth for the foreign-born population - Other Eastern Asia (%)
Place of birth for the foreign-born population - Afghanistan (%)
Place of birth for the foreign-born population - Bangladesh (%)
Place of birth for the foreign-born population - India (%)
Place of birth for the foreign-born population - Iran (%)
Place of birth for the foreign-born population - Kazakhstan (%)
Place of birth for the foreign-born population - Nepal (%)
Place of birth for the foreign-born population - Pakistan (%)
Place of birth for the foreign-born population - Sri Lanka (%)
Place of birth for the foreign-born population - Uzbekistan (%)
Place of birth for the foreign-born population - Other South Central Asia (%)
Place of birth for the foreign-born population - Burma (%)
Place of birth for the foreign-born population - Cambodia (%)
Place of birth for the foreign-born population - Indonesia (%)
Place of birth for the foreign-born population - Laos (%)
Place of birth for the foreign-born population - Malaysia (%)
Place of birth for the foreign-born population - Philippines (%)
Place of birth for the foreign-born population - Singapore (%)
Place of birth for the foreign-born population - Thailand (%)
Place of birth for the foreign-born population - Vietnam (%)
Place of birth for the foreign-born population - Other South Eastern Asia (%)
Place of birth for the foreign-born population - Armenia (%)
Place of birth for the foreign-born population - Iraq (%)
Place of birth for the foreign-born population - Israel (%)
Place of birth for the foreign-born population - Jordan (%)
Place of birth for the foreign-born population - Kuwait (%)
Place of birth for the foreign-born population - Lebanon (%)
Place of birth for the foreign-born population - Saudi Arabia (%)
Place of birth for the foreign-born population - Syria (%)
Place of birth for the foreign-born population - Turkey (%)
Place of birth for the foreign-born population - Yemen (%)
Place of birth for the foreign-born population - Other Western Asia (%)
Place of birth for the foreign-born population - Eritrea (%)
Place of birth for the foreign-born population - Ethiopia (%)
Place of birth for the foreign-born population - Kenya (%)
Place of birth for the foreign-born population - Somalia (%)
Place of birth for the foreign-born population - Uganda (%)
Place of birth for the foreign-born population - Zimbabwe (%)
Place of birth for the foreign-born population - Other Eastern Africa (%)
Place of birth for the foreign-born population - Cameroon (%)
Place of birth for the foreign-born population - Congo (%)
Place of birth for the foreign-born population - Democratic Republic of Congo (Zaire) (%)
Place of birth for the foreign-born population - Other Middle Africa (%)
Place of birth for the foreign-born population - Egypt (%)
Place of birth for the foreign-born population - Morocco (%)
Place of birth for the foreign-born population - Sudan (%)
Place of birth for the foreign-born population - Other Northern Africa (%)
Place of birth for the foreign-born population - South Africa (%)
Place of birth for the foreign-born population - Other Southern Africa (%)
Place of birth for the foreign-born population - Cabo Verde (%)
Place of birth for the foreign-born population - Ghana (%)
Place of birth for the foreign-born population - Liberia (%)
Place of birth for the foreign-born population - Nigeria (%)
Place of birth for the foreign-born population - Senegal (%)
Place of birth for the foreign-born population - Sierra Leone (%)
Place of birth for the foreign-born population - Other Western Africa (%)
Place of birth for the foreign-born population - Australia (%)
Place of birth for the foreign-born population - New Zealand (%)
Place of birth for the foreign-born population - Fiji (%)
Place of birth for the foreign-born population - Micronesia (%)
Place of birth for the foreign-born population - Bahamas (%)
Place of birth for the foreign-born population - Barbados (%)
Place of birth for the foreign-born population - Cuba (%)
Place of birth for the foreign-born population - Dominica (%)
Place of birth for the foreign-born population - Dominican Republic (%)
Place of birth for the foreign-born population - Grenada (%)
Place of birth for the foreign-born population - Haiti (%)
Place of birth for the foreign-born population - Jamaica (%)
Place of birth for the foreign-born population - St. Vincent and the Grenadines (%)
Place of birth for the foreign-born population - Trinidad and Tobago (%)
Place of birth for the foreign-born population - West Indies (%)
Place of birth for the foreign-born population - Other Caribbean (%)
Place of birth for the foreign-born population - Belize (%)
Place of birth for the foreign-born population - Costa Rica (%)
Place of birth for the foreign-born population - El Salvador (%)
Place of birth for the foreign-born population - Guatemala (%)
Place of birth for the foreign-born population - Honduras (%)
Place of birth for the foreign-born population - Mexico (%)
Place of birth for the foreign-born population - Nicaragua (%)
Place of birth for the foreign-born population - Panama (%)
Place of birth for the foreign-born population - Other Central America (%)
Place of birth for the foreign-born population - Argentina (%)
Place of birth for the foreign-born population - Bolivia (%)
Place of birth for the foreign-born population - Brazil (%)
Place of birth for the foreign-born population - Chile (%)
Place of birth for the foreign-born population - Colombia (%)
Place of birth for the foreign-born population - Ecuador (%)
Place of birth for the foreign-born population - Guyana (%)
Place of birth for the foreign-born population - Peru (%)
Place of birth for the foreign-born population - Uruguay (%)
Place of birth for the foreign-born population - Venezuela (%)
Place of birth for the foreign-born population - Other South America (%)
Place of birth for the foreign-born population - Canada (%)
Place of birth for the foreign-born population - Other Northern America (%)
Place of birth for the foreign-born population - Other (%)
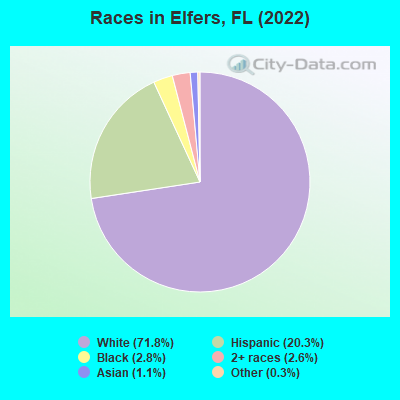
According to 2022 data, the most numerous races in Elfers, FL are White alone (10,217 residents), Hispanic (2,889 residents), and Black alone (394 residents). 81.1% of Elfers residents speak English at home. 10.6% of Elfers, FL residents are foreign-born (6.6% born in Latin America, 2.2% born in Europe), which is 97.4% less than the foreign-born rate of 21.0% across the entire state of Florida.
Race distribution in Elfers
2000 2022
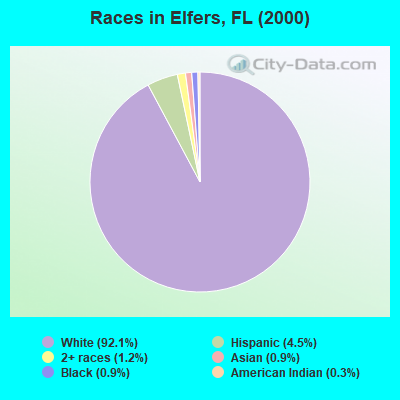
10,458,509 65.4% White alone 2,682,715 16.8% Hispanic 2,264,268 14.2% Black alone 261,693 1.6% Asian alone 236,954 1.5% Two or more races 42,358 0.3% American Indian alone 28,994 0.2% Other race alone 6,887 0.04% Native Hawaiian and Other
11,309,403 50.8% White alone 6,025,039 27.1% Hispanic 3,241,015 14.6% Black alone 861,630 3.9% Two or more races 623,692 2.8% Asian alone 152,054 0.7% Other race alone 22,504 0.1% American Indian alone 9,486 0.04% Native Hawaiian and Other
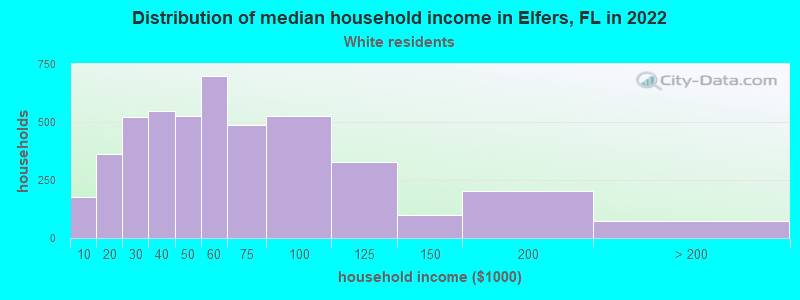
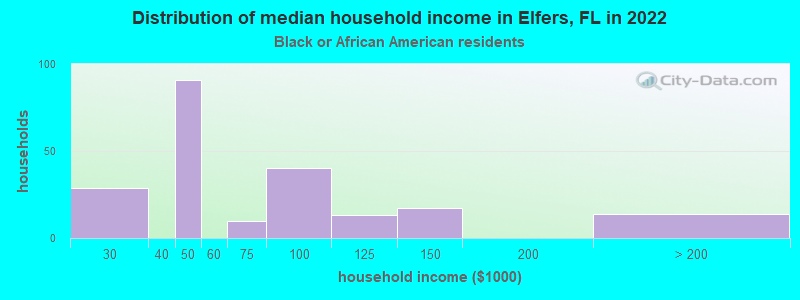
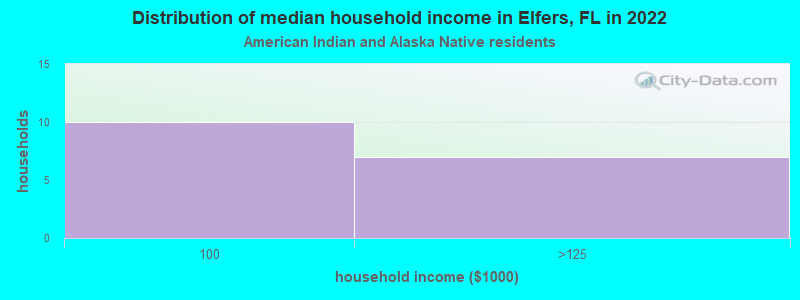
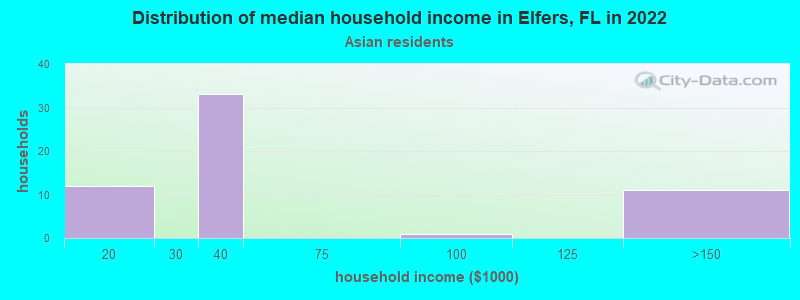
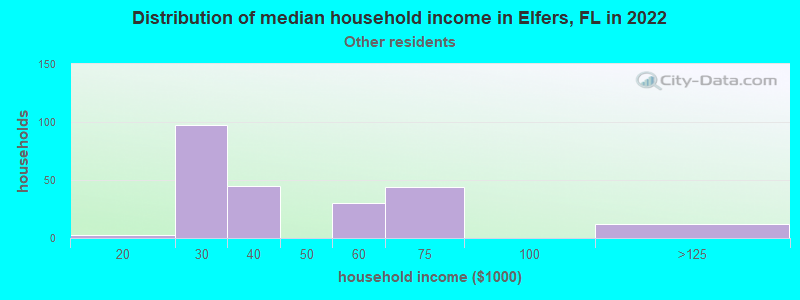
Income and house value in Elfers Median household income in 2022 $52,966 White non-Hispanic householders$76,057 Black householders$37,545 Some other race householders$59,168 Two or more races householders$52,083 Hispanic or Latino race householdersMedian 2022 house value $191,003 White Non-Hispanic householders$205,152 Black or African American householders $190,296 Asian householders$213,641 Some other race householders$257,147 Two or more races householders$207,981 Hispanic or Latino householders
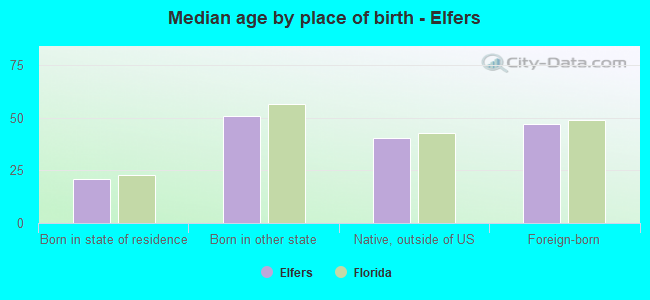
Median age by race in Elfers
42.5 Median age for White residents41.0 45.3 48.8 Median age for Black or African American residents47.7 49.6 48.9 Median age for American Indian / Alaska Native residents-769,874,476.2 -501,002,003.5 44.8 Median age for Asian residents-647,368,420.4 52.2 -835,555,554.7 Median age for Native Hawaiian / Pacific Islander residents-858,307,848.3 -444,051,825.2 40.7 Median age for Other race residents35.3 41.8 29.7 Median age for Two or more races residents26.4 31.0 45.3 Median age for White alone residents41.9 48.3 29.5 Median age for Hispanic or Latino residents32.7 28.9
Owner/renter occupied households by race in Elfers
House owners and renters - White residents 2,822 60.3% Owner occupied1,861 39.7% Renter occupiedHouse owners and renters - Black or African American residents 99 44.8% Owner occupied123 55.2% Renter occupiedHouse owners and renters - American Indian / Alaska Native residents 12 100.0% Owner occupiedHouse owners and renters - Asian residents 70 99.1% Owner occupied1 0.9% Renter occupiedHouse owners and renters - Other race residents 105 31.3% Owner occupied232 68.7% Renter occupiedHouse owners and renters - Two or more races residents 390 66.4% Owner occupied197 33.6% Renter occupiedHouse owners and renters - White alone residents 2,807 62.0% Owner occupied1,722 38.0% Renter occupiedHouse owners and renters - Hispanic or Latino residents 429 47.3% Owner occupied479 52.7% Renter occupied
Language usage in Elfers
English speakers - Total 81.1% of residents of Elfers speak English at home.
12.9% of residents speak Spanish at home 770 44.6% Speak English very well956 55.4% Speak English less than very well6.1% of residents speak other language at home 527 64.5% Speak English very well290 35.5% Speak English less than very well
English speakers - Born in the United States 94.0% of residents of Elfers speak English at home.
2.6% of residents speak Spanish at home 136 73.1% Speak English very well50 26.9% Speak English less than very well3.0% of residents speak other language at home 184 83.3% Speak English very well37 16.7% Speak English less than very well
English speakers - Native, born elsewhere 28.9% of residents of Elfers speak English at home.
64.3% of residents speak Spanish at home 61 29.2% Speak English very well148 70.8% Speak English less than very well
English speakers - Foreign-born 19.8% of residents of Elfers speak English at home.
49.2% of residents speak Spanish at home 182 21.5% Speak English very well665 78.5% Speak English less than very well29.4% of residents speak other language at home 257 50.9% Speak English very well248 49.1% Speak English less than very well
White (Caucasian) - Speak only English Native:
95.5% (9,376)Foreign-born:
20.0% (111)
White (Caucasian) - Speak another language Native:
4.5% (444)Foreign-born:
79.8% (441)
Black or African American - Speak only English Native:
99.0% (319)Foreign-born:
40.2% (60)
Asian - Speak only English Native:
100.0% (46)Foreign-born:
31.5% (40)
Asian - Speak another language Native:
1.7% (1)Foreign-born:
70.9% (90)
Other race - Speak only English Native:
54.0% (144)Foreign-born:
12.4% (59)
Other race - Speak another language Native:
43.7% (116)Foreign-born:
87.6% (418)
Two or more races - Speak only English Native:
51.3% (531)Foreign-born:
19.3% (84)
Two or more races - Speak another language Native:
51.4% (532)Foreign-born:
77.4% (338)
White alone - Speak only English Native:
96.2% (8,874)Foreign-born:
17.6% (84)
White alone - Speak another language Native:
3.8% (348)Foreign-born:
86.5% (413)
Hispanic or Latino - Speak only English Native:
50.3% (817)Foreign-born:
11.5% (116)
Hispanic or Latino - Speak another language Native:
49.6% (806)Foreign-born:
86.2% (873)
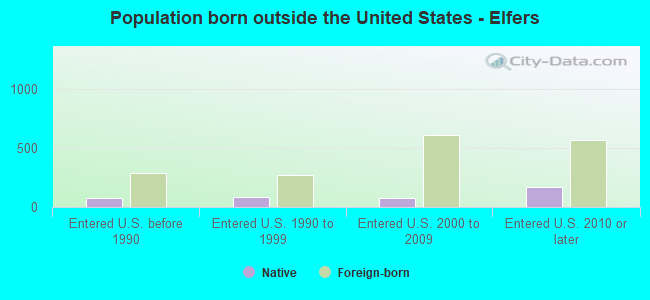
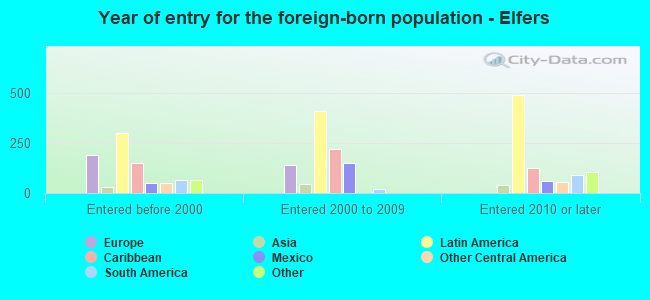
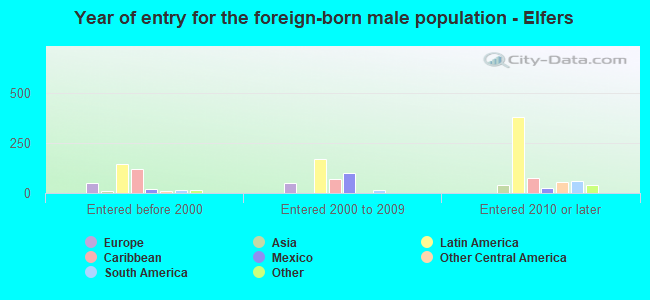
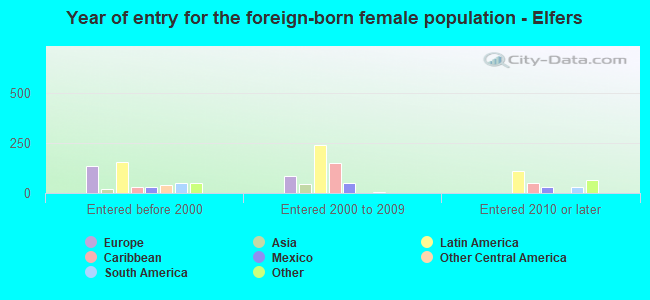
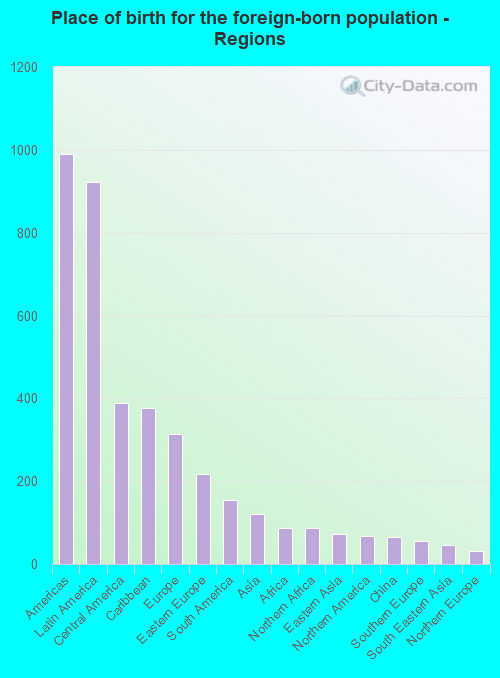
Foreign-born residents in Elfers 1,513 residents are foreign born (6.6% Latin America , 2.2% Europe ).
This city:
10.6%Florida:
21.1%
Marital status for residents in Elfers Marital status - White (Caucasian) population 15 years and over
Males 32.3% Never married44.5% Now married2.5% Separated4.1% Widowed16.7% DivorcedFemales 27.1% Never married37.8% Now married1.4% Separated15.2% Widowed18.5% DivorcedWomen who gave birth in the past 12 months Now married:
14.3% (7)Unmarried:
85.7% (40)
Women who did not give birth in the past 12 months Now married:
44.2% (1,059)Unmarried:
55.8% (1,337)
Marital status - Black or African American population 15 years and over
Males 41.5% Never married50.4% Now married0.0% Separated0.0% Widowed8.1% DivorcedFemales 0.0% Never married66.1% Now married0.0% Separated14.4% Widowed19.5% DivorcedWomen who did not give birth in the past 12 months Now married:
84.5% (67)Unmarried:
15.5% (12)
Marital status - American Indian / Alaska Native population 15 years and over
Males 0.0% Never married100.0% Now married0.0% Separated0.0% Widowed0.0% DivorcedFemales 100.0% Never married0.0% Now married0.0% Separated0.0% Widowed0.0% DivorcedWomen who gave birth in the past 12 months Now married:
0.0% (0)Unmarried:
100.0% (10)
Marital status - Asian population 15 years and over
Males 74.4% Never married25.6% Now married0.0% Separated0.0% Widowed0.0% DivorcedFemales 37.5% Never married27.7% Now married8.9% Separated25.9% Widowed0.0% DivorcedWomen who did not give birth in the past 12 months Now married:
25.0% (14)Unmarried:
75.0% (43)
Marital status - Other race population 15 years and over
Males 33.7% Never married50.5% Now married0.0% Separated4.1% Widowed11.7% DivorcedFemales 24.4% Never married34.0% Now married2.5% Separated23.4% Widowed15.7% DivorcedWomen who gave birth in the past 12 months Now married:
100.0% (44)Unmarried:
0.0% (0)
Women who did not give birth in the past 12 months Now married:
35.1% (46)Unmarried:
64.9% (85)
Marital status - Two or more races population 15 years and over
Males 42.7% Never married40.4% Now married0.0% Separated7.0% Widowed9.9% DivorcedFemales 47.8% Never married33.0% Now married0.0% Separated2.9% Widowed16.3% DivorcedWomen who did not give birth in the past 12 months Now married:
32.0% (188)Unmarried:
68.0% (399)
Marital status - White alone, not Hispanic / Latino population 15 years and over
Males 32.9% Never married43.2% Now married2.5% Separated4.0% Widowed17.5% DivorcedFemales 24.1% Never married38.3% Now married1.6% Separated16.0% Widowed20.0% DivorcedWomen who gave birth in the past 12 months Now married:
18.9% (7)Unmarried:
81.1% (30)
Women who did not give birth in the past 12 months Now married:
45.7% (976)Unmarried:
54.3% (1,158)
Marital status - Hispanic or Latino population 15 years and over
Males 35.5% Never married50.4% Now married0.9% Separated5.7% Widowed7.5% DivorcedFemales 43.4% Never married37.5% Now married0.5% Separated8.1% Widowed10.5% DivorcedWomen who gave birth in the past 12 months Now married:
67.6% (29)Unmarried:
32.4% (14)
Women who did not give birth in the past 12 months Now married:
38.7% (350)Unmarried:
61.3% (555)
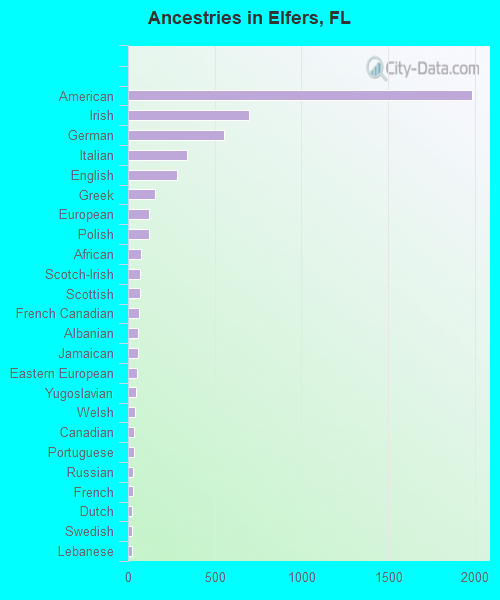
Ancestries in Elfers
1,983 27.9% American699 9.8% Irish551 7.7% German340 4.8% Italian283 4.0% English158 2.2% Greek124 1.7% European122 1.7% Polish77 1.1% African70 1.0% Scotch-Irish68 1.0% Scottish66 0.9% French Canadian59 0.8% Albanian56 0.8% Jamaican54 0.8% Eastern European47 0.7% Yugoslavian40 0.6% Welsh34 0.5% Canadian33 0.5% Portuguese30 0.4% Russian28 0.4% French25 0.4% Dutch25 0.4% Swedish24 0.3% Lebanese17 0.2% Norwegian11 0.2% Hungarian11 0.2% Macedonian10 0.1% Finnish9 0.1% British8 0.1% Romanian7 0.10% Croatian
Children Nativity (place of birth) in Elfers
Children under 6 years - Living with two parents Both parents native 292 100.0% NativeBoth parents foreign-born 57 100.0% NativeOne native, one foreign-born parent 38 100.0% NativeChildren under 6 years - Living with one parent Native parent 591 100.0% NativeChildren 6 to 17 years - Living with two parents Both parents native 603 100.0% NativeBoth parents foreign-born 78 40.0% Native117 60.0% Foreign-bornOne native, one foreign-born parent 76 59.4% Native52 40.6% Foreign-bornChildren 6 to 17 years - Living with one parent Native parent 718 100.0% NativeForeign-born parent 8 45.6% Native10 54.4% Foreign-born
Grandparents responsible for own grandchildren in Elfers
Grandparents (30 to 59 years) White / Caucasian 40 78.5% Responsible for grandchildren11 21.5% Not responsible for grandchildrenWhite alone, not Hispanic / Latino 29 86.1% Responsible for grandchildren5 13.9% Not responsible for grandchildrenHispanic or Latino 18 70.7% Responsible for grandchildren7 29.3% Not responsible for grandchildrenGrandparents (60 years and over) White / Caucasian 29 46.3% Responsible for grandchildren33 53.7% Not responsible for grandchildrenWhite alone, not Hispanic / Latino 30 45.5% Responsible for grandchildren36 54.5% Not responsible for grandchildren