Estimated zip code population in 2022: 36,315 Zip code population in 2010: 30,756 Zip code population in 2000: 30,941
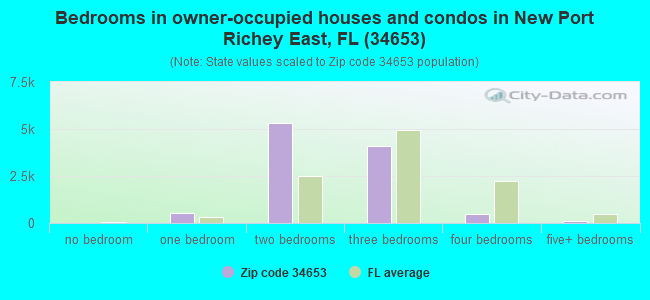
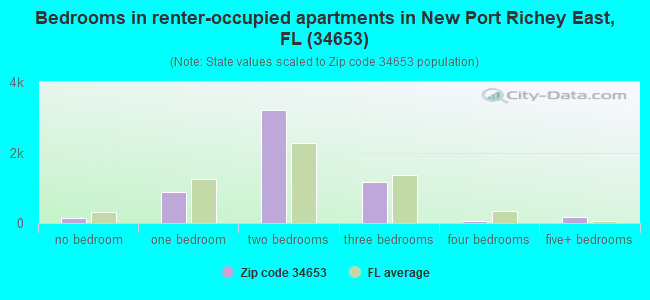
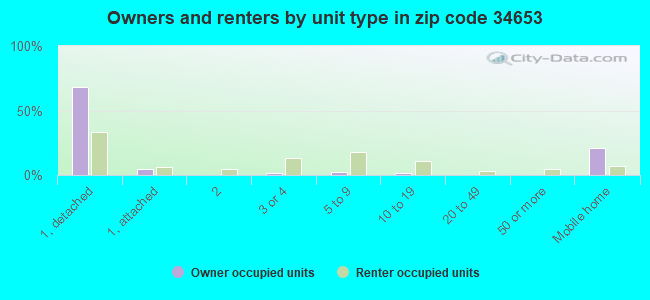
Houses and condos: 18,218 Renter-occupied apartments: 5,629
% of renters here:
35%
State:
33%
March 2022 cost of living index in zip code 34653: 97.1 (near average, U.S. average is 100)
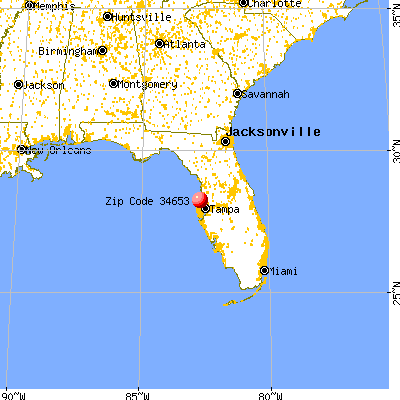
Land area: 10.8 sq. mi. Water area: 0.1 sq. mi.
Population density: 3,363 people per square mile
(average).
OSM Map
General Map
Google Map
MSN Map
OSM Map
General Map
Google Map
MSN Map
OSM Map
General Map
Google Map
MSN Map
OSM Map
General Map
Google Map
MSN Map
Please wait while loading the map...
Real estate property taxes paid for housing units in 2022:
This zip code:
0.6% ($1,204)
Florida:
0.7% ($2,529)
Median real estate property taxes paid for housing units with mortgages in 2022: $1,322 (0.6%) Median real estate property taxes paid for housing units with no mortgage in 2022: $1,087 (0.7%)
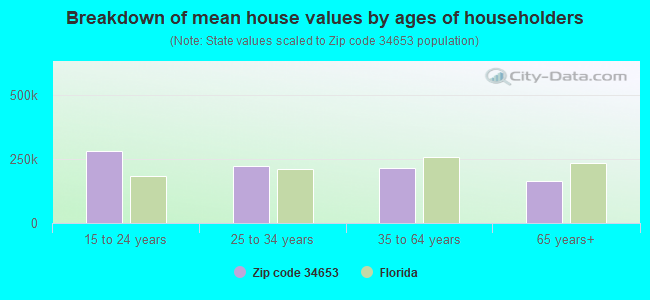
Estimated median house/condo value in 2022: $191,229
34653:
$191,229
Florida:
$354,100
According to our research of Florida and other state lists, there were 47 registered sex offenders living in 34653 zip code as of April 26, 2024. The ratio of all residents to sex offenders in zip code 34653 is 745 to 1. The ratio of registered sex offenders to all residents in this zip code is near the state average.
Median resident age:
This zip code:
51.4 years
Florida median age:
42.7 years
Average household size:
This zip code:
2.2 people
Florida:
2.5 people
Averages for the 2020 tax year for zip code 34653, filed in 2021:
Average Adjusted Gross Income (AGI) in 2020: $42,193 (Individual Income Tax Returns)
Here:
$42,193
State:
$82,200
Salary/wage: $39,047 (reported on 78.4% of returns)
Here:
$39,047
State:
$58,347
(% of AGI for various income ranges: 1111.1% for AGIs below $25k, 3492.6% for AGIs $25k-50k, 6532.9% for AGIs $50k-75k, 9598.5% for AGIs $75k-100k, 16530.0% for AGIs $100k-200k, 63836.7% for AGIs over 200k)
Taxable interest for individuals: $1,145 (reported on 18.0% of returns)
This zip code:
$1,145
Florida:
$4,272
(% of AGI for various income ranges: 13.2% for AGIs below $25k, 13.4% for AGIs $25k-50k, 23.7% for AGIs $50k-75k, 47.9% for AGIs $75k-100k, 189.8% for AGIs $100k-200k, 846.7% for AGIs over 200k)
Ordinary dividends: $2,698 (reported on 11.3% of returns)
Here:
$2,698
State:
$15,863
(% of AGI for various income ranges: 13.3% for AGIs below $25k, 23.9% for AGIs $25k-50k, 42.8% for AGIs $50k-75k, 90.5% for AGIs $75k-100k, 176.4% for AGIs $100k-200k, 2886.7% for AGIs over 200k)
Net capital gain/loss in AGI: +$8,919 (reported on 9.7% of returns)
Here:
+$8,919
State:
+$62,983
(% of AGI for various income ranges: 5.8% for AGIs below $25k, 27.6% for AGIs $25k-50k, 54.5% for AGIs $50k-75k, 163.7% for AGIs $75k-100k, 547.8% for AGIs $100k-200k, 23626.7% for AGIs over 200k)
Profit/loss from business: +$7,210 (reported on 15.1% of returns)
Here:
+$7,210
State:
+$9,719
(% of AGI for various income ranges: 143.0% for AGIs below $25k, 108.4% for AGIs $25k-50k, 170.2% for AGIs $50k-75k, 206.6% for AGIs $75k-100k, 276.9% for AGIs $100k-200k)
Taxable individual retirement arrangement distribution: $12,471 (reported on 8.1% of returns)
34653:
$12,471
Florida:
$24,823
(% of AGI for various income ranges: 56.8% for AGIs below $25k, 71.9% for AGIs $25k-50k, 163.7% for AGIs $50k-75k, 348.9% for AGIs $75k-100k, 896.6% for AGIs $100k-200k)
Total itemized deductions: $25,694 (reported on 2.0% of returns)
Here:
$25,694
State:
$45,393
(% of AGI for various income ranges: 15.1% for AGIs below $25k, 46.1% for AGIs $25k-50k, 102.7% for AGIs $50k-75k, 138.8% for AGIs $75k-100k, 346.7% for AGIs $100k-200k, 2266.7% for AGIs over 200k)
Charity contributions: $6,405 (reported on 1.4% of returns)
Here:
$6,405
State:
$20,178
(% of AGI for various income ranges: 0.8% for AGIs below $25k, 6.9% for AGIs $25k-50k, 16.4% for AGIs $50k-75k, 15.6% for AGIs $75k-100k, 122.9% for AGIs $100k-200k)
Taxes paid: $4,382 (reported on 1.8% of returns)
34653:
$4,382
State:
$6,967
(% of AGI for various income ranges: 1.8% for AGIs below $25k, 6.7% for AGIs $25k-50k, 15.6% for AGIs $50k-75k, 22.9% for AGIs $75k-100k, 52.8% for AGIs $100k-200k, 483.3% for AGIs over 200k)
Earned income credit: $2,166 (reported on 21.6% of returns)
Here:
$2,166
State:
$2,306
(% of AGI for various income ranges: 100.0% for AGIs below $25k, 63.3% for AGIs $25k-50k, 1.1% for AGIs $50k-75k)
Percentage of individuals using paid preparers for their 2020 taxes: 93.3%
Here:
93%
State:
92%
(% for various income ranges: 92.0% for AGIs below $25k, 94.7% for AGIs $25k-50k, 93.4% for AGIs $50k-75k, 93.6% for AGIs $75k-100k, 94.0% for AGIs $100k-200k, 90.9% for AGIs over 200k)
Averages for the 2012 tax year for zip code 34653, filed in 2013:
Average Adjusted Gross Income (AGI) in 2012: $34,475 (Individual Income Tax Returns)
Here:
$34,475
State:
$60,316
Salary/wage: $32,372 (reported on 78.2% of returns)
Here:
$32,372
State:
$45,277
(% of AGI for various income ranges: 68.2% for AGIs below $25k, 78.1% for AGIs $25k-50k, 74.3% for AGIs $50k-75k, 77.8% for AGIs $75k-100k, 72.7% for AGIs $100k-200k, 36.4% for AGIs over 200k)
Taxable interest for individuals: $1,151 (reported on 25.2% of returns)
This zip code:
$1,151
Florida:
$3,587
(% of AGI for various income ranges: 1.4% for AGIs below $25k, 0.7% for AGIs $25k-50k, 0.8% for AGIs $50k-75k, 0.8% for AGIs $75k-100k, 0.6% for AGIs $100k-200k, 0.5% for AGIs over 200k)
Ordinary dividends: $3,221 (reported on 13.9% of returns)
Here:
$3,221
State:
$12,831
(% of AGI for various income ranges: 1.8% for AGIs below $25k, 1.1% for AGIs $25k-50k, 1.2% for AGIs $50k-75k, 1.3% for AGIs $75k-100k, 1.3% for AGIs $100k-200k, 0.8% for AGIs over 200k)
Net capital gain/loss in AGI: +$1,861 (reported on 9.3% of returns)
Here:
+$1,861
State:
+$33,493
(% of AGI for various income ranges: 0.1% for AGIs $25k-50k, 0.3% for AGIs $50k-75k, 0.5% for AGIs $75k-100k, 1.1% for AGIs $100k-200k, 8.7% for AGIs over 200k)
Profit/loss from business: +$7,487 (reported on 11.6% of returns)
Here:
+$7,487
State:
+$10,012
(% of AGI for various income ranges: 7.5% for AGIs below $25k, 1.9% for AGIs $25k-50k, 1.0% for AGIs $50k-75k, 1.3% for AGIs $75k-100k, 1.4% for AGIs $100k-200k)
Taxable individual retirement arrangement distribution: $9,669 (reported on 10.5% of returns)
34653:
$9,669
Florida:
$21,544
(% of AGI for various income ranges: 3.7% for AGIs below $25k, 2.3% for AGIs $25k-50k, 2.8% for AGIs $50k-75k, 3.5% for AGIs $75k-100k, 3.9% for AGIs $100k-200k)
Total itemized deductions: $16,533 (27% of AGI, reported on 13.2% of returns)
Here:
$16,533
State:
$25,533
Here:
26.6% of AGI
State:
18.0% of AGI
(% of AGI for various income ranges: 4.6% for AGIs below $25k, 6.2% for AGIs $25k-50k, 6.7% for AGIs $50k-75k, 6.6% for AGIs $75k-100k, 7.3% for AGIs $100k-200k, 10.1% for AGIs over 200k)
Charity contributions: $2,566 (reported on 9.8% of returns)
Here:
$2,566
State:
$5,698
(% of AGI for various income ranges: 0.3% for AGIs below $25k, 0.6% for AGIs $25k-50k, 0.8% for AGIs $50k-75k, 1.0% for AGIs $75k-100k, 1.1% for AGIs $100k-200k, 1.0% for AGIs over 200k)
Taxes paid: $2,541 (reported on 12.7% of returns)
34653:
$2,541
State:
$6,203
(% of AGI for various income ranges: 0.5% for AGIs below $25k, 0.8% for AGIs $25k-50k, 1.0% for AGIs $50k-75k, 1.1% for AGIs $75k-100k, 1.4% for AGIs $100k-200k, 1.6% for AGIs over 200k)
Earned income credit: $2,180 (reported on 23.5% of returns)
Here:
$2,180
State:
$2,372
(% of AGI for various income ranges: 6.4% for AGIs below $25k, 1.0% for AGIs $25k-50k)
Percentage of individuals using paid preparers for their 2012 taxes: 42.8%
Here:
43%
State:
54%
(% for various income ranges: 40.5% for AGIs below $25k, 42.0% for AGIs $25k-50k, 48.8% for AGIs $50k-75k, 46.5% for AGIs $75k-100k, 51.1% for AGIs $100k-200k, 75.0% for AGIs over 200k)
Averages for the 2004 tax year for zip code 34653, filed in 2005:
Average Adjusted Gross Income (AGI) in 2004: $30,670 (Individual Income Tax Returns)
Here:
$30,670
State:
$50,523
Salary/wage: $29,170 (reported on 77.9% of returns)
Here:
$29,170
State:
$39,563
(% of AGI for various income ranges: 76.4% for AGIs below $10k, 67.1% for AGIs $10k-25k, 76.6% for AGIs $25k-50k, 78.7% for AGIs $50k-75k, 80.4% for AGIs $75k-100k, 60.4% for AGIs over 100k)
Taxable interest for individuals: $1,630 (reported on 40.5% of returns)
This zip code:
$1,630
Florida:
$3,211
(% of AGI for various income ranges: 6.3% for AGIs below $10k, 3.4% for AGIs $10k-25k, 1.8% for AGIs $25k-50k, 1.7% for AGIs $50k-75k, 1.6% for AGIs $75k-100k, 1.4% for AGIs over 100k)
Taxable dividends: $1,856 (reported on 18.7% of returns)
Here:
$1,856
State:
$6,129
(% of AGI for various income ranges: 3.5% for AGIs below $10k, 1.5% for AGIs $10k-25k, 1.0% for AGIs $25k-50k, 0.9% for AGIs $50k-75k, 0.8% for AGIs $75k-100k, 1.1% for AGIs over 100k)
Net capital gain/loss: +$4,100 (reported on 15.4% of returns)
Here:
+$4,100
State:
+$27,205
(% of AGI for various income ranges: -1.7% for AGIs below $10k, 0.1% for AGIs $10k-25k, 0.4% for AGIs $25k-50k, 1.0% for AGIs $50k-75k, 1.9% for AGIs $75k-100k, 14.4% for AGIs over 100k)
Profit/loss from business: +$6,325 (reported on 11.3% of returns)
Here:
+$6,325
State:
+$10,634
(% of AGI for various income ranges: 9.4% for AGIs below $10k, 4.5% for AGIs $10k-25k, 2.1% for AGIs $25k-50k, 1.6% for AGIs $50k-75k, 1.1% for AGIs $75k-100k, 0.2% for AGIs over 100k)
IRA payment deduction: $2,566 (reported on 2.2% of returns)
34653:
$2,566
Florida:
$3,082
(% of AGI for various income ranges: 0.3% for AGIs below $10k, 0.1% for AGIs $10k-25k, 0.2% for AGIs $25k-50k, 0.2% for AGIs $50k-75k, 0.1% for AGIs $75k-100k, 0.1% for AGIs over 100k)
Total itemized deductions: $14,129 (27% of AGI, reported on 19.0% of returns)
Here:
$14,129
State:
$20,370
Here:
27.0% of AGI
State:
20.7% of AGI
(% of AGI for various income ranges: 7.3% for AGIs below $10k, 7.5% for AGIs $10k-25k, 8.6% for AGIs $25k-50k, 9.4% for AGIs $50k-75k, 9.8% for AGIs $75k-100k, 9.3% for AGIs over 100k)
Charity contributions deductions: $2,164 (4% of AGI, reported on 15.6% of returns)
Here:
$2,164
State:
$4,064
Here:
4.0% of AGI
State:
3.8% of AGI
(% of AGI for various income ranges: 0.5% for AGIs below $10k, 0.5% for AGIs $10k-25k, 1.0% for AGIs $25k-50k, 1.1% for AGIs $50k-75k, 1.6% for AGIs $75k-100k, 1.8% for AGIs over 100k)
Total tax: $3,377 (reported on 72.6% of returns)
34653:
$3,377
State:
$9,431
(% of AGI for various income ranges: 2.5% for AGIs below $10k, 3.9% for AGIs $10k-25k, 6.7% for AGIs $25k-50k, 8.8% for AGIs $50k-75k, 10.8% for AGIs $75k-100k, 15.6% for AGIs over 100k)
Earned income credit: $1,624 (reported on 17.7% of returns)
Here:
$1,624
State:
$1,808
Percentage of individuals using paid preparers for their 2004 taxes: 54.9%
Here:
55%
State:
60%
(% for various income ranges: 49.4% for AGIs below $10k, 57.7% for AGIs $10k-25k, 54.5% for AGIs $25k-50k, 56.8% for AGIs $50k-75k, 51.8% for AGIs $75k-100k, 66.0% for AGIs over 100k)
Likely homosexual households (counted as self-reported same-sex unmarried-partner households)
Lesbian couples: 0.1% of all households
Gay men: 0.2% of all households
Household received Food Stamps/SNAP in the past 12 months: 2,761 Household did not receive Food Stamps/SNAP in the past 12 months: 13,468
Women who had a birth in the past 12 months: 283 (230 now married, 59 unmarried) Women who did not have a birth in the past 12 months: 5,773 (2,379 now married, 3,394 unmarried)
Housing units in zip code 34653 with a mortgage: 4,501 (398 second mortgage, 286 both second mortgage and home equity loan) Houses without a mortgage: 173
Median monthly owner costs for units with a mortgage: $1,231 Median monthly owner costs for units without a mortgage: $463
Residents with income below the poverty level in 2022:
This zip code:
12.2%
Whole state:
12.7%
Residents with income below 50% of the poverty level in 2022:
This zip code:
5.8%
Whole state:
6.6%
Median number of rooms in houses and condos:
Here:
5.2
State:
5.9
Median number of rooms in apartments:
Here:
4.4
State:
4.2
Notable locations in this zip code not listed on our city pages
Notable locations in zip code 34653: Pasco County Fire Rescue Station 29 / Magnolia Valley Volunteer Fire Department (A), New Port Richey Fire and Emergency Services Station 2 (B). Display/hide their locations on the map
Churches in zip code 34653 include: First Assembly of God Church (A), Bible Truth Chapel (B), Calvary Chapel of Pasco (C), New Life Family Church (D), Oasis Christian Fellowship Church (E). Display/hide their locations on the map
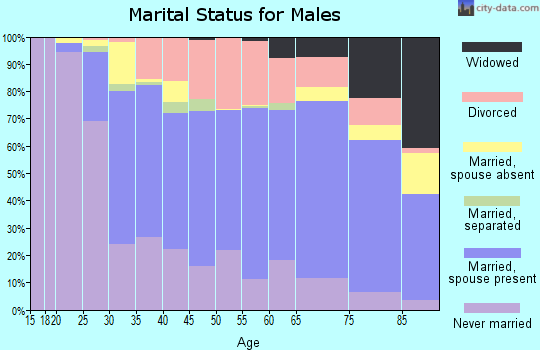
3,238 married couples with children.
1,782 single-parent households (399 men, 1,383 women).
84.5% of residents of 34653 zip code speak English at home.
9.9% of residents speak Spanish at home (66% very well, 13% well, 12% not well, 9% not at all).
3.9% of residents speak other Indo-European language at home (72% very well, 18% well, 7% not well, 3% not at all).
0.7% of residents speak Asian or Pacific Island language at home (40% very well, 49% well, 11% not well).
1.0% of residents speak other language at home (58% very well, 1% well, 42% not well).
Foreign born population: 3,810 (10.5%) (57.6% of them are naturalized citizens)
This zip code:
10.5%
Whole state:
21.7%
10%Chile
9%Honduras
7%Dominica
6%France
6%Algeria
5%Guyana
4%Barbados
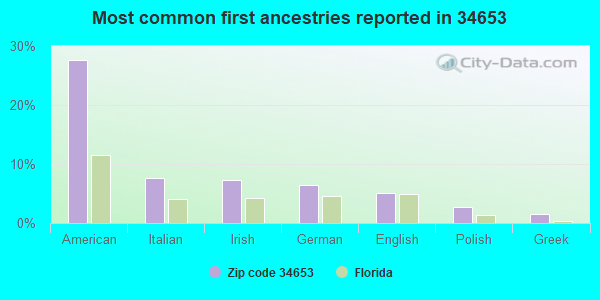
28%American
8%Italian
7%Irish
6%German
5%English
3%Polish
1%Greek
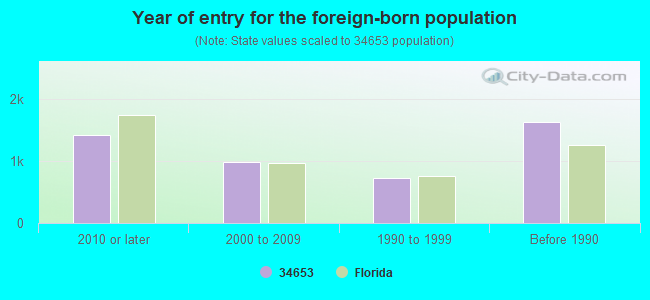
Year of entry for the foreign-born population
1,4182010 or later
9782000 to 2009
7211990 to 1999
1,631Before 1990
Major facilities with environmental interests located in this zip code:
NEW PORT RICHEY SURGERY CENTER (NW CORNER OF MASSACHUSETTES AV in NEW PORT RICHEY, FL)
National Pollutant Discharge Elimination System NON-MAJOR (Tracking pollutant discharge elimination systems) - permit National Pollutant Discharge Elimination System NON-MAJOR (Tracking pollutant discharge elimination systems) - permit Organizations: RONALD MORAHAN (CONTACT/OWNER)
RIDGEWOOD HIGH SCHOOL (7650 ORCHID LAKE ROAD in NEW PORT RICHEY, FL)
(Geographic Names Information System) (National Center for Education Statistics) - STATE ID-0931 Organizations: PASCO COUNTY SCHOOL DISTRICT (SCHOOL DISTRICT)
GULF MIDDLE SCHOOL (6419 LOUISIANA AVENUE in NEW PORT RICHEY, FL)
(National Center for Education Statistics) - STATE ID-0261 Organizations: PASCO COUNTY SCHOOL DISTRICT (SCHOOL DISTRICT)
MANDALA ADOLESCENT TREATMENT CENTER (8005 KING HELIE BLVD. in NEW PORT RICHEY, FL)
(National Center for Education Statistics) - STATE ID-6242 Organizations: PASCO COUNTY SCHOOL DISTRICT (SCHOOL DISTRICT)
COTEE RIVER ELEMENTARY SCHOOL (7515 PLATHE ROAD in NEW PORT RICHEY, FL)
(National Center for Education Statistics) - STATE ID-0311 Organizations: PASCO COUNTY SCHOOL DISTRICT (SCHOOL DISTRICT)
CITRUS PARK RETAIL (NW CORNER OF GUNN HIGHWAY &SHE in NEW PORT RICHEY, FL)
National Pollutant Discharge Elimination System NON-MAJOR (Tracking pollutant discharge elimination systems) - permit Organizations: MICHAEL SMITH (CONTACT/OWNER)
NEW PORT RICHEY RECREATION & A (6630 VAN BUREN ST in NEW PORT RICHEY, FL)
National Pollutant Discharge Elimination System NON-MAJOR (Tracking pollutant discharge elimination systems) - permit Organizations: ROD VOIT (CONTACT/OWNER)
PARKIT (8603 & 8605 OLD CR 54 in NEW PORT RICHEY, FL)
National Pollutant Discharge Elimination System NON-MAJOR (Tracking pollutant discharge elimination systems) - permit Organizations: DONALD NELSON (CONTACT/OWNER)
PASCO CO FACILITIES MGT DEPT (7220 OSTEEN RD in NEW PORT RICHEY, FL)
(Resource Conservation and Recovery Act (tracking hazardous waste)) Organizations: PASCO COUNTY (CONTACT/OWNER)
ROWAN PROFESSIONAL OFFICE PARK (5532 ROWAN ROAD in NEW PORT RICHEY, FL)
National Pollutant Discharge Elimination System NON-MAJOR (Tracking pollutant discharge elimination systems) - permit Organizations: ALEX DEEB (CONTACT/OWNER)
SAWGRASS CREEK (SW CORNER OF LITTLE RD AND OLD in NEW PORT RICHEY, FL)
National Pollutant Discharge Elimination System NON-MAJOR (Tracking pollutant discharge elimination systems) - permit Organizations: RICK JOUDREY (CONTACT/OWNER)
SHOPS OF 54 (AKA MTN SR 54 MIL (7605 SR 54 in HILLSBOROUGH, FL)
National Pollutant Discharge Elimination System NON-MAJOR (Tracking pollutant discharge elimination systems) - permit Organizations: MIKE NOVAK (CONTACT/OWNER)
Alternative names: BEACH WOODS TOWNHOMES
MIKE PATTERSON (6502 MASSACHUSETTS AVENUE in NEW PORT RICHEY, FL)
AIR MINOR (AIRS/AFS) Business SIC classification: DRYCLEANING PLANTS, EXCEPT RUG CLEANING
Housing units lacking complete plumbing facilities: 1.3% Housing units lacking complete kitchen facilities: 0.8%
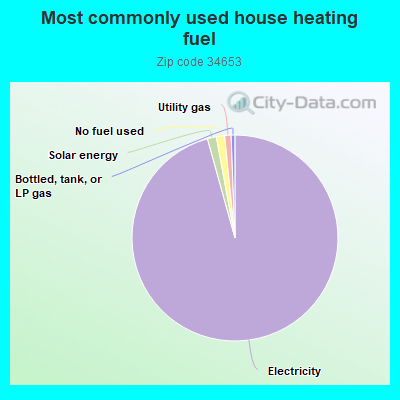
95.7%Electricity
1.4%Solar energy
1.3%No fuel used
1.0%Utility gas
0.6%Bottled, tank, or LP gas
Population in 1990: 26,729. Population change in the 1990s: +4,212 (+15.8%).
Place of birth for U.S.-born residents:
This state: 10,829
Northeast: 10,463
Midwest: 6,269
South: 3,098
West: 769
54% of the 34653 zip code residents lived in the same house 5 years ago. Out of people who lived in different houses, 49% lived in this county. Out of people who lived in different counties, 50% lived in Florida.
89% of the 34653 zip code residents lived in the same house 1 year ago. Out of people who lived in different houses, 42% moved from this county. Out of people who lived in different houses, 19% moved from different county within same state. Out of people who lived in different houses, 32% moved from different state. Out of people who lived in different houses, 7% moved from abroad.
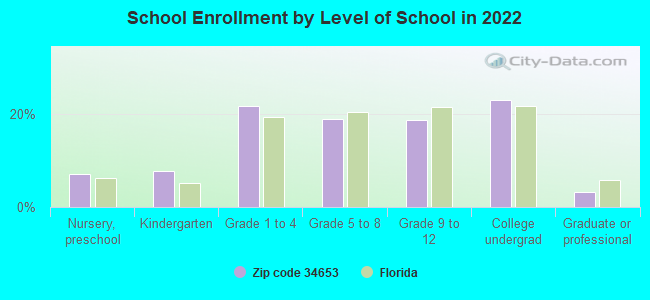
Private vs. public school enrollment:
Students in private schools in grades 1 to 8 (elementary and middle school): 238
Here:
10.1%
Florida:
15.8%
Students in private schools in grades 9 to 12 (high school): 137
Here:
12.6%
Florida:
12.9%
Students in private undergraduate colleges: 303
Here:
22.6%
Florida:
23.6%
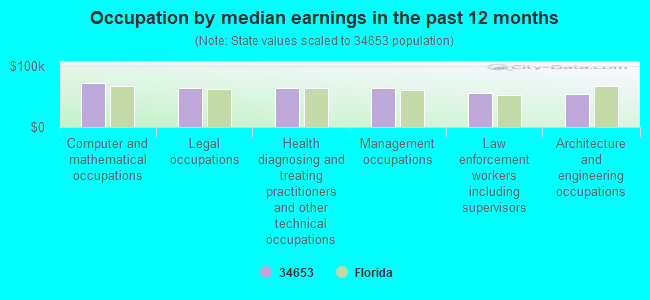
Occupation by median earnings in the past 12 months ($)
71,930Computer and mathematical occupations
64,562Legal occupations
63,671Health diagnosing and treating practitioners and other technical occupations
63,274Management occupations
55,690Law enforcement workers including supervisors
53,319Architecture and engineering occupations
Companies with federal contracts located in this zip code:
GALLION, DAVID A (6153 ARTHUR AVE in NEW PORT RICHE, FL; small business) : $11,250 in 2 contractsin 2005
$5,625 with Army for Recreation Site Maintenance Services (non-construction). Signed on 2005-04-07. Completion date: 2005-09-19.
$5,625 with U.S. Army Corps of Engineers - civil program financing only for Recreation Site Maintenance Services (non-construction). Signed on 2005-04-07. Completion date: 2005-09-19.
FLEEMAN ANDERSON & BIRD CORP (6644 ROWAN RD in NEW PORT RICHE, FL; small business)
$260 with Army for ADP Software. Signed on 2005-09-29. Completion date: 2005-10-28.
Top industries in this zip code by the number of employees in 2005:
Health Care and Social Assistance: Outpatient Mental Health and Substance Abuse Centers (500-999 employees: 1 establishment)
Health Care and Social Assistance: Nursing Care Facilities (100-249: 4, 50-99: 1)
2002 - 2018 National Fire Incident Reporting System (NFIRS) incidents
According to the data from the years 2002 - 2018 the average number of fire incidents per year is 68. The highest number of fire incidents - 105 took place in 2006, and the least - 39 in 2018. The data has a declining trend.
When looking into fire subcategories, the most reports belonged to: Outside Fires (42.4%), and Structure Fires (36.3%).
Fire incident types reported to NFIRS in Zip Code 34653


 Nearest zip codes: 34652, 34668, 34690, 34654, 34655, 34688.


 According to the data from the years 2002 - 2018 the average number of fire incidents per year is 68. The highest number of fire incidents - 105 took place in 2006, and the least - 39 in 2018. The data has a declining trend.
 When looking into fire subcategories, the most reports belonged to: Outside Fires (42.4%), and Structure Fires (36.3%).