Estimated zip code population in 2022: 24,396 Zip code population in 2010: 21,716 Zip code population in 2000: 16,410
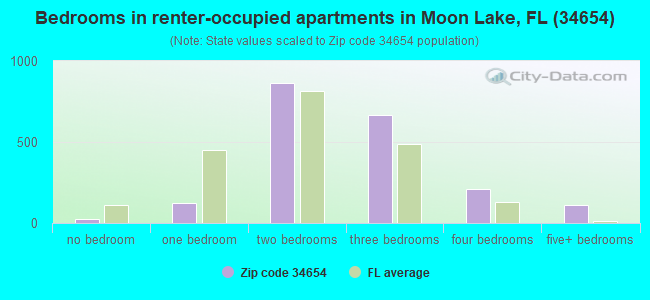
Houses and condos: 10,554 Renter-occupied apartments: 2,024
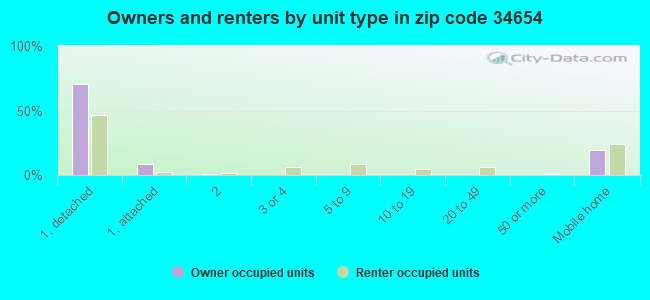
% of renters here:
21%
State:
33%
March 2022 cost of living index in zip code 34654: 98.0 (near average, U.S. average is 100)
Land area: 26.9 sq. mi. Water area: 0.8 sq. mi.
Population density: 905 people per square mile
(low).
OSM Map
General Map
Google Map
MSN Map
OSM Map
General Map
Google Map
MSN Map
OSM Map
General Map
Google Map
MSN Map
OSM Map
General Map
Google Map
MSN Map
Please wait while loading the map...
Real estate property taxes paid for housing units in 2022:
This zip code:
0.7% ($1,840)
Florida:
0.7% ($2,529)
Median real estate property taxes paid for housing units with mortgages in 2022: $2,184 (0.7%) Median real estate property taxes paid for housing units with no mortgage in 2022: $1,368 (0.7%)
Averages for the 2020 tax year for zip code 34654, filed in 2021:
Average Adjusted Gross Income (AGI) in 2020: $58,276 (Individual Income Tax Returns)
Here:
$58,276
State:
$82,200
Salary/wage: $50,246 (reported on 76.0% of returns)
Here:
$50,246
State:
$58,347
(% of AGI for various income ranges: 1109.2% for AGIs below $25k, 3437.1% for AGIs $25k-50k, 6325.2% for AGIs $50k-75k, 8954.3% for AGIs $75k-100k, 17081.2% for AGIs $100k-200k, 61250.0% for AGIs over 200k)
Taxable interest for individuals: $1,806 (reported on 25.9% of returns)
This zip code:
$1,806
Florida:
$4,272
(% of AGI for various income ranges: 19.9% for AGIs below $25k, 31.7% for AGIs $25k-50k, 62.5% for AGIs $50k-75k, 123.1% for AGIs $75k-100k, 139.7% for AGIs $100k-200k, 1478.9% for AGIs over 200k)
Ordinary dividends: $5,076 (reported on 16.7% of returns)
Here:
$5,076
State:
$15,863
(% of AGI for various income ranges: 27.2% for AGIs below $25k, 29.5% for AGIs $25k-50k, 82.5% for AGIs $50k-75k, 130.3% for AGIs $75k-100k, 362.8% for AGIs $100k-200k, 3718.9% for AGIs over 200k)
Net capital gain/loss in AGI: +$10,176 (reported on 15.5% of returns)
Here:
+$10,176
State:
+$62,983
(% of AGI for various income ranges: 15.5% for AGIs below $25k, 51.1% for AGIs $25k-50k, 105.3% for AGIs $50k-75k, 291.0% for AGIs $75k-100k, 704.4% for AGIs $100k-200k, 8150.0% for AGIs over 200k)
Profit/loss from business: +$8,853 (reported on 15.4% of returns)
Here:
+$8,853
State:
+$9,719
(% of AGI for various income ranges: 138.9% for AGIs below $25k, 124.0% for AGIs $25k-50k, 200.2% for AGIs $50k-75k, 272.9% for AGIs $75k-100k, 322.3% for AGIs $100k-200k, 2091.1% for AGIs over 200k)
Taxable individual retirement arrangement distribution: $17,320 (reported on 11.2% of returns)
34654:
$17,320
Florida:
$24,823
(% of AGI for various income ranges: 76.0% for AGIs below $25k, 132.7% for AGIs $25k-50k, 294.7% for AGIs $50k-75k, 524.4% for AGIs $75k-100k, 865.4% for AGIs $100k-200k, 3205.6% for AGIs over 200k)
Total itemized deductions: $32,788 (reported on 3.9% of returns)
Here:
$32,788
State:
$45,393
(% of AGI for various income ranges: 26.2% for AGIs below $25k, 71.6% for AGIs $25k-50k, 190.9% for AGIs $50k-75k, 255.9% for AGIs $75k-100k, 562.1% for AGIs $100k-200k, 3992.2% for AGIs over 200k)
Charity contributions: $10,974 (reported on 3.1% of returns)
Here:
$10,974
State:
$20,178
(% of AGI for various income ranges: 7.7% for AGIs $25k-50k, 27.5% for AGIs $50k-75k, 52.2% for AGIs $75k-100k, 157.6% for AGIs $100k-200k, 1866.7% for AGIs over 200k)
Taxes paid: $5,540 (reported on 3.9% of returns)
34654:
$5,540
State:
$6,967
(% of AGI for various income ranges: 2.5% for AGIs below $25k, 9.7% for AGIs $25k-50k, 32.0% for AGIs $50k-75k, 52.2% for AGIs $75k-100k, 116.7% for AGIs $100k-200k, 542.2% for AGIs over 200k)
Earned income credit: $2,149 (reported on 16.7% of returns)
Here:
$2,149
State:
$2,306
(% of AGI for various income ranges: 90.9% for AGIs below $25k, 61.6% for AGIs $25k-50k, 1.5% for AGIs $50k-75k)
Percentage of individuals using paid preparers for their 2020 taxes: 92.9%
Here:
93%
State:
92%
(% for various income ranges: 92.1% for AGIs below $25k, 94.1% for AGIs $25k-50k, 93.2% for AGIs $50k-75k, 93.3% for AGIs $75k-100k, 92.8% for AGIs $100k-200k, 89.7% for AGIs over 200k)
Averages for the 2012 tax year for zip code 34654, filed in 2013:
Average Adjusted Gross Income (AGI) in 2012: $47,374 (Individual Income Tax Returns)
Here:
$47,374
State:
$60,316
Salary/wage: $41,724 (reported on 77.9% of returns)
Here:
$41,724
State:
$45,277
(% of AGI for various income ranges: 67.9% for AGIs below $25k, 72.7% for AGIs $25k-50k, 70.6% for AGIs $50k-75k, 72.1% for AGIs $75k-100k, 72.3% for AGIs $100k-200k, 48.8% for AGIs over 200k)
Taxable interest for individuals: $1,643 (reported on 32.8% of returns)
This zip code:
$1,643
Florida:
$3,587
(% of AGI for various income ranges: 2.3% for AGIs below $25k, 1.1% for AGIs $25k-50k, 1.1% for AGIs $50k-75k, 0.8% for AGIs $75k-100k, 0.8% for AGIs $100k-200k, 1.3% for AGIs over 200k)
Ordinary dividends: $4,230 (reported on 19.2% of returns)
Here:
$4,230
State:
$12,831
(% of AGI for various income ranges: 2.0% for AGIs below $25k, 1.6% for AGIs $25k-50k, 1.5% for AGIs $50k-75k, 1.5% for AGIs $75k-100k, 1.5% for AGIs $100k-200k, 2.7% for AGIs over 200k)
Net capital gain/loss in AGI: +$5,838 (reported on 15.4% of returns)
Here:
+$5,838
State:
+$33,493
(% of AGI for various income ranges: 0.1% for AGIs $25k-50k, 0.7% for AGIs $50k-75k, 0.7% for AGIs $75k-100k, 1.0% for AGIs $100k-200k, 11.5% for AGIs over 200k)
Profit/loss from business: +$14,113 (reported on 14.1% of returns)
Here:
+$14,113
State:
+$10,012
(% of AGI for various income ranges: 8.9% for AGIs below $25k, 2.9% for AGIs $25k-50k, 1.9% for AGIs $50k-75k, 1.6% for AGIs $75k-100k, 2.3% for AGIs $100k-200k, 12.5% for AGIs over 200k)
Taxable individual retirement arrangement distribution: $13,879 (reported on 12.8% of returns)
34654:
$13,879
Florida:
$21,544
(% of AGI for various income ranges: 4.3% for AGIs below $25k, 3.4% for AGIs $25k-50k, 3.1% for AGIs $50k-75k, 3.4% for AGIs $75k-100k, 5.0% for AGIs $100k-200k, 2.8% for AGIs over 200k)
Self-employment retirement plans: $21,250 (reported on 0.2% of returns)
34654:
$21,250
Florida:
$20,611
Total itemized deductions: $19,996 (22% of AGI, reported on 22.9% of returns)
Here:
$19,996
State:
$25,533
Here:
22.4% of AGI
State:
18.0% of AGI
(% of AGI for various income ranges: 7.5% for AGIs below $25k, 8.5% for AGIs $25k-50k, 9.8% for AGIs $50k-75k, 10.1% for AGIs $75k-100k, 10.7% for AGIs $100k-200k, 10.4% for AGIs over 200k)
Charity contributions: $2,997 (reported on 17.6% of returns)
Here:
$2,997
State:
$5,698
(% of AGI for various income ranges: 0.4% for AGIs below $25k, 0.7% for AGIs $25k-50k, 1.1% for AGIs $50k-75k, 1.1% for AGIs $75k-100k, 1.4% for AGIs $100k-200k, 1.8% for AGIs over 200k)
Taxes paid: $3,958 (reported on 22.4% of returns)
34654:
$3,958
State:
$6,203
(% of AGI for various income ranges: 1.2% for AGIs below $25k, 1.4% for AGIs $25k-50k, 1.8% for AGIs $50k-75k, 2.1% for AGIs $75k-100k, 2.4% for AGIs $100k-200k, 1.9% for AGIs over 200k)
Earned income credit: $2,189 (reported on 19.6% of returns)
Here:
$2,189
State:
$2,372
(% of AGI for various income ranges: 6.6% for AGIs below $25k, 1.0% for AGIs $25k-50k)
Percentage of individuals using paid preparers for their 2012 taxes: 46.3%
Here:
46%
State:
54%
(% for various income ranges: 41.3% for AGIs below $25k, 45.0% for AGIs $25k-50k, 51.1% for AGIs $50k-75k, 52.5% for AGIs $75k-100k, 54.8% for AGIs $100k-200k, 80.0% for AGIs over 200k)
Averages for the 2004 tax year for zip code 34654, filed in 2005:
Average Adjusted Gross Income (AGI) in 2004: $39,934 (Individual Income Tax Returns)
Here:
$39,934
State:
$50,523
Salary/wage: $34,892 (reported on 78.3% of returns)
Here:
$34,892
State:
$39,563
(% of AGI for various income ranges: 144.2% for AGIs below $10k, 66.4% for AGIs $10k-25k, 72.5% for AGIs $25k-50k, 74.2% for AGIs $50k-75k, 75.9% for AGIs $75k-100k, 55.1% for AGIs over 100k)
Taxable interest for individuals: $2,000 (reported on 45.5% of returns)
This zip code:
$2,000
Florida:
$3,211
(% of AGI for various income ranges: 10.7% for AGIs below $10k, 3.8% for AGIs $10k-25k, 2.8% for AGIs $25k-50k, 1.8% for AGIs $50k-75k, 1.9% for AGIs $75k-100k, 1.4% for AGIs over 100k)
Taxable dividends: $2,487 (reported on 23.8% of returns)
Here:
$2,487
State:
$6,129
(% of AGI for various income ranges: 5.4% for AGIs below $10k, 2.0% for AGIs $10k-25k, 1.6% for AGIs $25k-50k, 1.0% for AGIs $50k-75k, 0.8% for AGIs $75k-100k, 1.6% for AGIs over 100k)
Net capital gain/loss: +$8,870 (reported on 19.5% of returns)
Here:
+$8,870
State:
+$27,205
(% of AGI for various income ranges: -6.2% for AGIs below $10k, -0.1% for AGIs $10k-25k, 0.7% for AGIs $25k-50k, 1.3% for AGIs $50k-75k, 3.4% for AGIs $75k-100k, 11.6% for AGIs over 100k)
Profit/loss from business: +$9,619 (reported on 14.4% of returns)
Here:
+$9,619
State:
+$10,634
(% of AGI for various income ranges: 6.7% for AGIs below $10k, 6.0% for AGIs $10k-25k, 2.8% for AGIs $25k-50k, 2.1% for AGIs $50k-75k, 2.5% for AGIs $75k-100k, 4.2% for AGIs over 100k)
IRA payment deduction: $3,149 (reported on 3.0% of returns)
34654:
$3,149
Florida:
$3,082
(% of AGI for various income ranges: 0.7% for AGIs below $10k, 0.2% for AGIs $10k-25k, 0.3% for AGIs $25k-50k, 0.3% for AGIs $50k-75k, 0.2% for AGIs $75k-100k, 0.2% for AGIs over 100k)
Self-employed pension: $16,440 (reported on 0.3% of returns)
Here:
$16,440
Florida:
$15,857
Total itemized deductions: $16,937 (24% of AGI, reported on 26.7% of returns)
Here:
$16,937
State:
$20,370
Here:
24.1% of AGI
State:
20.7% of AGI
(% of AGI for various income ranges: 16.2% for AGIs below $10k, 9.0% for AGIs $10k-25k, 11.8% for AGIs $25k-50k, 12.7% for AGIs $50k-75k, 13.7% for AGIs $75k-100k, 9.6% for AGIs over 100k)
Charity contributions deductions: $2,428 (3% of AGI, reported on 22.0% of returns)
Here:
$2,428
State:
$4,064
Here:
3.3% of AGI
State:
3.8% of AGI
(% of AGI for various income ranges: 0.7% for AGIs below $10k, 0.6% for AGIs $10k-25k, 1.1% for AGIs $25k-50k, 1.5% for AGIs $50k-75k, 1.5% for AGIs $75k-100k, 1.6% for AGIs over 100k)
Total tax: $5,944 (reported on 72.2% of returns)
34654:
$5,944
State:
$9,431
(% of AGI for various income ranges: 4.3% for AGIs below $10k, 3.9% for AGIs $10k-25k, 6.3% for AGIs $25k-50k, 8.5% for AGIs $50k-75k, 10.5% for AGIs $75k-100k, 18.6% for AGIs over 100k)
Earned income credit: $1,719 (reported on 17.2% of returns)
Here:
$1,719
State:
$1,808
Percentage of individuals using paid preparers for their 2004 taxes: 57.5%
Here:
57%
State:
60%
(% for various income ranges: 48.1% for AGIs below $10k, 59.9% for AGIs $10k-25k, 59.0% for AGIs $25k-50k, 58.2% for AGIs $50k-75k, 57.6% for AGIs $75k-100k, 70.5% for AGIs over 100k)
Likely homosexual households (counted as self-reported same-sex unmarried-partner households)
Lesbian couples: 0.5% of all households
Gay men: 0.2% of all households
Household received Food Stamps/SNAP in the past 12 months: 1,519 Household did not receive Food Stamps/SNAP in the past 12 months: 7,905
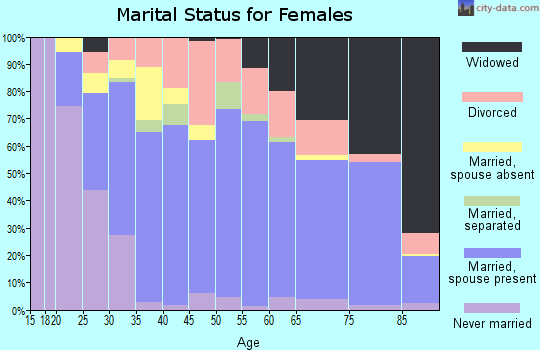
Women who had a birth in the past 12 months: 159 (75 now married, 80 unmarried) Women who did not have a birth in the past 12 months: 4,982 (1,881 now married, 3,099 unmarried)
Housing units in zip code 34654 with a mortgage: 3,664 (356 second mortgage, 332 both second mortgage and home equity loan) Houses without a mortgage: 80
Median monthly owner costs for units with a mortgage: $1,549 Median monthly owner costs for units without a mortgage: $406
Residents with income below the poverty level in 2022:
This zip code:
13.2%
Whole state:
12.7%
Residents with income below 50% of the poverty level in 2022:
This zip code:
6.9%
Whole state:
6.6%
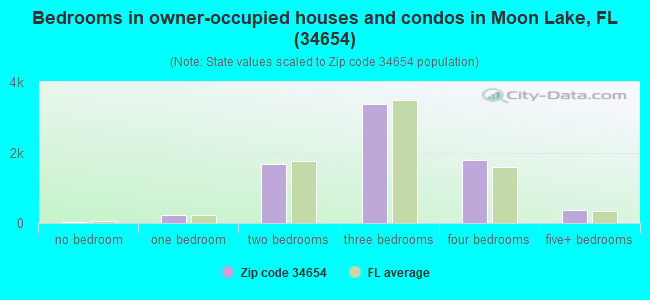
Median number of rooms in houses and condos:
Here:
5.9
State:
5.9
Median number of rooms in apartments:
Here:
5.1
State:
4.2
Notable locations in this zip code not listed on our city pages
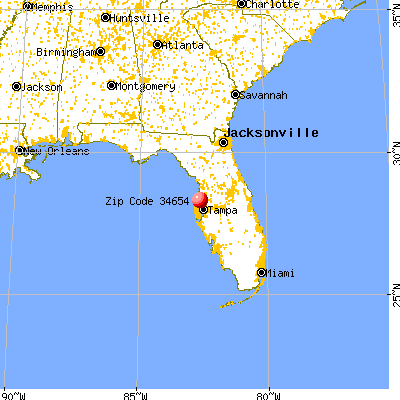
Notable locations in zip code 34654: West Pasco Judicial Center (A), Pasco County Sheriff's Office-Westside Office (B), Pasco County Detention Center-West Facility (C), Pasco County Fire Rescue Station 14 (D), Pasco County Criminal Court (E), Regency Park Branch Library Pasco Public Library (F). Display/hide their locations on the map
Lakes and swamps: Moon Lake (A), Hidden Lake (B), Hudson Lake (C), Dead Cypress Lake (D), Scout Lake (E), West Moon Lake (F), Garden Lake (G), Worley Lakes (H). Display/hide their locations on the map
2,206 married couples with children.
1,203 single-parent households (201 men, 1,002 women).
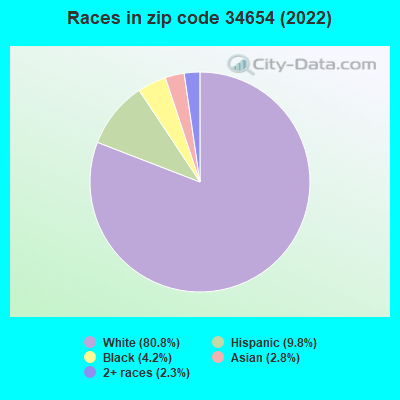
89.4% of residents of 34654 zip code speak English at home.
4.0% of residents speak Spanish at home (71% very well, 19% well, 4% not well, 6% not at all).
4.7% of residents speak other Indo-European language at home (78% very well, 14% well, 8% not well).
1.3% of residents speak Asian or Pacific Island language at home (54% very well, 38% well, 8% not well).
0.4% of residents speak other language at home (100% very well).
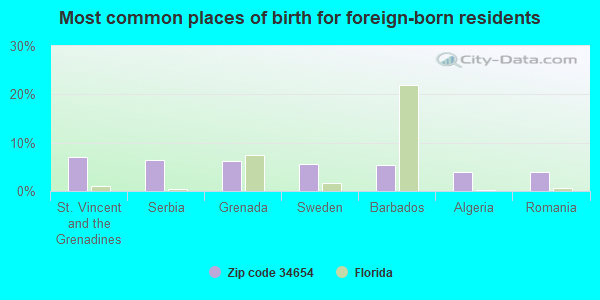
Foreign born population: 1,733 (7.1%) (72.9% of them are naturalized citizens)
Major facilities with environmental interests located in this zip code:
PALL AEROPOWER CORPORATION (10540 RIDGE ROAD in NEW PORT RICHEY, FL)
AIR MAJOR (AIRS/AFS) STATE MASTER (FDM) - CHAZ-FLD046855086, HAZARDOUS WASTE REGULATION PROGRAM ENFORCEMENT/COMPLIANCE ACTIVITY (Integrated Compliance Information System) - ICIS-04-2002-9015, FORMAL ENFORCEMENT ACTION (Integrated Compliance Information System) - ICIS-04-2002-9015, FORMAL ENFORCEMENT ACTION CRITERIA AND HAZARDOUS AIR POLLUTANT INVENTORY (Inventory of air pollution sources) HAZARDOUS WASTE BIENNIAL REPORTER (Resource Conservation and Recovery Act (tracking hazardous waste)) Large Quantity Generators, more that 1000 kg of hazardous waste/month (Resource Conservation and Recovery Act (tracking hazardous waste)) - notification TRANSPORTER (Resource Conservation and Recovery Act (tracking hazardous waste)) TSD (Resource Conservation and Recovery Act (tracking hazardous waste)) TRI REPORTER (Tracking of toxic chemicals releasing facilities) Business SIC classification: GENERAL INDUSTRIAL MACHINERY AND EQUIPMENT; AIRCRAFT PARTS AND AUXILIARY EQUIPMENT Organizations: PALL AEROPOWER CORP NPR, PALL LAND & MARINE (CONTACT/OPERATOR)
Alternative names: PALL AEROPOWER CORP.- NEW PORT RICHEY, PALL AEROPOWER CORP NPR, PALL LAND & MARINE CORP
CYPRESS ELEMENTARY SCHOOL WWTF (10055 SWEET BAY COURT in NEW PORT RICHEY, FL)
STATE MASTER (FDM) - WAFR-FLA012732, DOMESTIC WASTEWATER PROGRAM (Geographic Names Information System) (National Center for Education Statistics) - STATE ID-0701 National Pollutant Discharge Elimination System NON-MAJOR (Tracking pollutant discharge elimination systems) - permit Business SIC classification: SEWERAGE SYSTEMS Organizations: SUPERINTENDENT, PASCO COUNTY SCHOOL BOARD, PASCO COUNTY SCHOOLS (CONTACT/APPLICANT)
, DISTRICT SCHOOL BOARD OF PASCO COUNTY (CONTACT/APPLICANT)
, JOHN PETRASHEK (CONTACT/OWNER)
, PASCO COUNTY SCHOOLS (CONTACT/PERMIT)
, DISTRICT SCHOOL BOARD OF PASCO COUNTY (CONTACT/PERMIT)
, PASCO COUNTY SCHOOL DISTRICT (SCHOOL DISTRICT)
Alternative names: CYPRESS ELEMENTARY SCHOOL WWTP
DEER PARK WWTP (5000 LITTLE ROAD in NEW PORT RICHEY, FL)
STATE MASTER (FDM) - WAFR-FL0040746, DOMESTIC WASTEWATER PROGRAM, WAFR-FLA439223, National Pollutant Discharge Elimination System NON-MAJOR (Tracking pollutant discharge elimination systems) - permit Business SIC classification: SEWERAGE SYSTEMS Organizations: DIRECTOR, PASCO COUNTY UTILITIES SERVICES, PASCO COUNTY UTILITIES DEPARTMENT (CONTACT/APPLICANT)
, PASCO CO. UTILITIES DEPARTMENT (CONTACT/APPLICANT)
, DOUGLAS BRAMLETT (CONTACT/OWNER)
, PASCO COUNTY UTILITIES DEPARTMENT (CONTACT/PERMIT)
Alternative names: DEER PARK SUBREGIONAL WWTF, PASCO COUNTY UTILITIES
MOON LAKE ELEMENTARY SCHOOL (12019 TREE BREEZE DRIVE in NEW PORT RICHEY, FL)
(Geographic Names Information System) (National Center for Education Statistics) - STATE ID-0941 Organizations: PASCO COUNTY SCHOOL DISTRICT (SCHOOL DISTRICT)
SCHRADER ELEMENTARY SCHOOL (11041 LITTLE ROAD in NEW PORT RICHEY, FL)
(Geographic Names Information System) (National Center for Education Statistics) - STATE ID-0341 Organizations: PASCO COUNTY SCHOOL DISTRICT (SCHOOL DISTRICT)
RICHARD MILBURN ACADEMY (SCHEDULED T (7619 LITTLE ROAD in NEW PORT RICHEY, FL)
(National Center for Education Statistics) - STATE ID-4306 Organizations: PASCO COUNTY SCHOOL DISTRICT (SCHOOL DISTRICT)
RIVER RIDGE MIDDLE AND HIGH SCHOOL (11646 TOWN CENTER ROAD in NEW PORT RICHEY, FL)
(National Center for Education Statistics) - STATE ID-0471 Organizations: PASCO COUNTY SCHOOL DISTRICT (SCHOOL DISTRICT)
DEER PARK ELEMENTARY SCHOOL (8636 TROUBLE CREEK ROAD in NEW PORT RICHEY, FL)
(National Center for Education Statistics) - STATE ID-0421 Organizations: PASCO COUNTY SCHOOL DISTRICT (SCHOOL DISTRICT)
PASCO CENTER PHASE 2 (GOVT DR in NEW PORT RICHEY, FL)
National Pollutant Discharge Elimination System NON-MAJOR (Tracking pollutant discharge elimination systems) - permit Organizations: ARNEL SANTOS (CONTACT/OWNER)
Alternative names: LOWE'S OF VENICE FL
SIMPLE CENTERS USA (RIDGE RD/LITTLE RD in NEW PORT RICHEY, FL)
National Pollutant Discharge Elimination System NON-MAJOR (Tracking pollutant discharge elimination systems) - permit Organizations: MICHAEL SMITH (CONTACT/OWNER)
ALL BRIGHT LIGHTING (8638 BROAD ST in NEW PORT RICHEY, FL)
(Resource Conservation and Recovery Act (tracking hazardous waste)) Organizations: RON RENNER, LIGHTING TECH (CONTACT/OWNER)
HERNANDO OAKS GOLF AND COUNTRY (U.S. 41 BETWEEN WISCON ROAD AN in BROOKSVILLE, FL)
National Pollutant Discharge Elimination System NON-MAJOR (Tracking pollutant discharge elimination systems) - permit Organizations: CLIFFORD MANUEL (CONTACT/OWNER)
LEXINGTON COMMONS (APPROX 1480 FT N OF DECUBELLIS in NEW PORT RICHEY, FL)
National Pollutant Discharge Elimination System NON-MAJOR (Tracking pollutant discharge elimination systems) - permit Organizations: DAVID WILLIAMS (CONTACT/OWNER)
Housing units lacking complete plumbing facilities: 1.9% Housing units lacking complete kitchen facilities: 1.6%
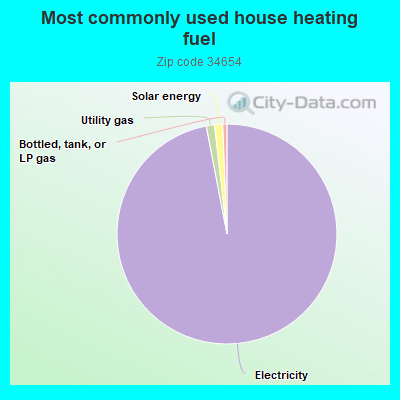
96.4%Electricity
1.2%Utility gas
1.2%Solar energy
0.6%Bottled, tank, or LP gas
Population in 1990: 13,750. Population change in the 1990s: +2,660 (+19.3%).
Place of birth for U.S.-born residents:
This state: 8,238
Northeast: 5,802
Midwest: 4,746
South: 2,212
West: 991
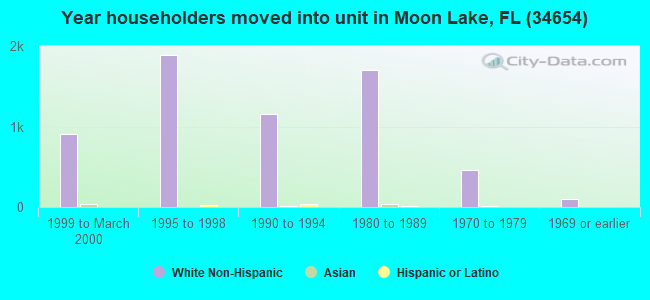
57% of the 34654 zip code residents lived in the same house 5 years ago. Out of people who lived in different houses, 46% lived in this county. Out of people who lived in different counties, 50% lived in Florida.
90% of the 34654 zip code residents lived in the same house 1 year ago. Out of people who lived in different houses, 56% moved from this county. Out of people who lived in different houses, 25% moved from different county within same state. Out of people who lived in different houses, 14% moved from different state. Out of people who lived in different houses, 1% moved from abroad.
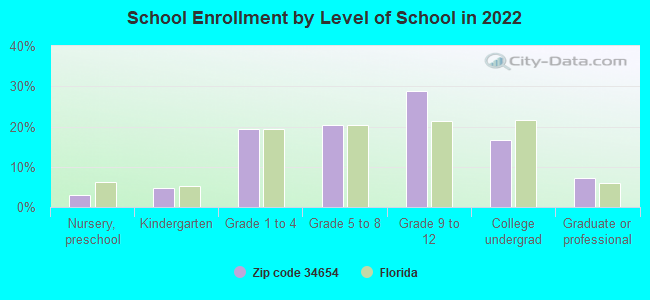
Private vs. public school enrollment:
Students in private schools in grades 1 to 8 (elementary and middle school): 161
Here:
9.3%
Florida:
15.8%
Students in private schools in grades 9 to 12 (high school): 159
Here:
12.6%
Florida:
12.9%
Students in private undergraduate colleges: 117
Here:
16.2%
Florida:
23.6%
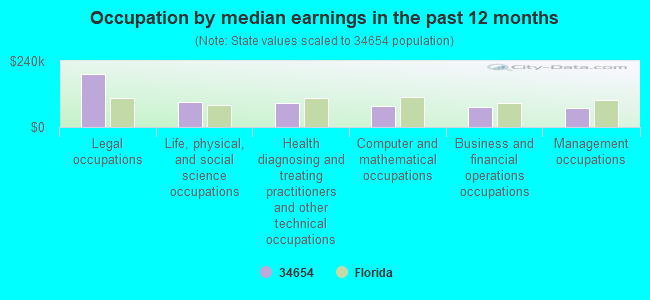
Occupation by median earnings in the past 12 months ($)
193,016Legal occupations
89,752Life, physical, and social science occupations
86,926Health diagnosing and treating practitioners and other technical occupations
76,367Computer and mathematical occupations
71,667Business and financial operations occupations
69,893Management occupations
Companies with federal contracts located in this zip code (NEW PORT RICHE, FL):
PALL AEROPOWER CORPORATION (10540 RIDGE RD; small business) : $89,852,704 in 2159 contractsfrom 1999 to 2006
Contracts for Engine Air and Oil Filters, Cleaners, Aircraft Prime Moving, Airframe Structural Components, Centrifugals, Separators, and Pressure and Vacuum Filters, Engine Fuel System Components, Aircraft and Missile Prime Movers, and moreby Army, Navy, Air Force, Defense Logistics Agency, and others Signed by year:2000: $10,167,917; 2001: $9,496,730; 2002: $10,938,207; 2003: $8,886,966; 2004: $12,558,656; 2005: $27,468,614; 2006: $8,230,822.
Biggest contracts:
$5,619,750 with Army for Engine Air and Oil Filters, Cleaners, Aircraft Prime Moving. Signed on 2005-02-23. Completion date: 2005-07-11.
$4,244,559, same as above.Signed on 2005-09-13. Completion date: 2005-07-11.
$1,766,866 with Army for Airframe Structural Components. Signed on 2003-02-12. Completion date: 2003-12-30.
$1,385,489 with Army for Engine Air and Oil Filters, Cleaners, Aircraft Prime Moving. Signed on 2005-07-14. Completion date: 2005-07-11.
PALL AEROPOWER CORPORATION (10540 RIDGE RD; small business)
$60,375 with Army for Fans, Air Circulators, and Blower Equipment. Signed on 2002-05-07. Completion date: 2003-11-15.
IMAQUE IMAGING INC (11255 PINE FOREST DRIVE; small business) : $34,073 in 6 contractsfrom 2003 to 2005
Contracts for Maintenance, Repair and Rebuilding of Equipment -- Instruments and Laboratory Equipment, Physical Properties Testing and Inspection, by Navy, National Oceanic and Atmospheric Administration/Under Secretary for Oceans and Atmosphere, National Institute of Standards and Technology Signed by year:2000: $0; 2001: $0; 2002: $0; 2003: $7,199; 2004: $17,727; 2005: $9,147; 2006: $0.
Biggest contracts:
$9,147 with Navy for Maintenance, Repair and Rebuilding of Equipment -- Instruments and Laboratory Equipment. Signed on 2005-09-22. Completion date: 2006-09-30.
$8,712, same as above.Signed on 2004-09-23. Completion date: 2004-09-30.
$7,199 with Navy for Physical Properties Testing and Inspection. Signed on 2003-02-27. Completion date: 2003-04-16.
$3,715, same as above.Signed on 2004-12-21. Completion date: 2005-01-21.
PACIFIC ARROW SUPPORT INC (10540 RIDGE RD; small business)
$29,136 with Air Force for Aircraft Maintenance and Repair Shop Specialized Equipment. Signed on 2000-09-18. Completion date: 2000-12-31.
Top industries in this zip code by the number of employees in 2005:
Professional, Scientific, and Technical Services: Marketing Research and Public Opinion Polling (250-499 employees: 1 establishment)
Administrative and Support and Waste Management and Remediation Services: Telemarketing Bureaus (250-499: 1)
2002 - 2018 National Fire Incident Reporting System (NFIRS) incidents
According to the data from the years 2002 - 2018 the average number of fire incidents per year is 72. The highest number of fire incidents - 122 took place in 2006, and the least - 41 in 2014. The data has a rising trend.
When looking into fire subcategories, the most reports belonged to: Outside Fires (45.4%), and Structure Fires (34.5%).
Fire incident types reported to NFIRS in Zip Code 34654


 Nearest zip codes: 34669, 34653, 34655, 34668, 34667, 34638.


 According to the data from the years 2002 - 2018 the average number of fire incidents per year is 72. The highest number of fire incidents - 122 took place in 2006, and the least - 41 in 2014. The data has a rising trend.
 When looking into fire subcategories, the most reports belonged to: Outside Fires (45.4%), and Structure Fires (34.5%).