Estimated zip code population in 2022: 46,320
Zip code population in 2010: 38,464
Zip code population in 2000: 24,369
Houses and condos: 20,951
Renter-occupied apartments: 4,182
% of renters here:
21%State:
33%
March 2022 cost of living index in zip code 34655: 99.2
(near average, U.S. average is 100)
Land area: 46.7
sq. mi.
Water area: 0.3
sq. mi.
Population density: 991 people per square mile (low).
OSM Map
General Map
Google Map
MSN Map
OSM Map
General Map
Google Map
MSN Map
OSM Map
General Map
Google Map
MSN Map
OSM Map
General Map
Google Map
MSN Map
Please wait while loading the map...
Real estate property taxes paid for housing units in 2022:
This zip code:
0.7% ($2,665)Florida:
0.7% ($2,529)
Median real estate property taxes paid for housing units with mortgages in 2022: $2,840 (0.7%)
Median real estate property taxes paid for housing units with no mortgage in 2022: $2,217 (0.7%)
Profiles of local businesses
Business Search - 14 Million verified businesses
Males: 22,555 Females: 23,765
For population 25 years and over in 34655:
High school or higher: 95.1%Bachelor's degree or higher: 38.8%Graduate or professional degree: 13.4%Unemployed: 3.0%Mean travel time to work (commute): 31.3 minutes
For population 15 years and over in 34655:
Never married: 24.4%Now married: 58.0%Separated: 1.0%Widowed: 6.9%Divorced: 9.7%
Zip code 34655 compared to state average:
Black race population percentage significantly below state average. Hispanic race population percentage significantly below state average. Foreign-born population percentage below state average. Renting percentage below state average. Length of stay since moving in above state average. House age below state average. 38,900 84.0% White 3,660 7.9% Hispanic or Latino 1,269 2.7% Asian 1,135 2.5% Black 1,049 2.3% Two or more races 127 0.3% American Indian 148 0.3% Some other race 29 0.06% Native Hawaiian and Other
Data:
Median household income ($)
Median household income (% change since 2000)
Household income diversity
Ratio of average income to average house value (%)
Ratio of average income to average rent
Median household income ($) - White
Median household income ($) - Black or African American
Median household income ($) - Asian
Median household income ($) - Hispanic or Latino
Median household income ($) - American Indian and Alaska Native
Median household income ($) - Multirace
Median household income ($) - Other Race
Median household income for houses/condos with a mortgage ($)
Median household income for apartments without a mortgage ($)
Races - White alone (%)
Races - White alone (% change since 2000)
Races - Black alone (%)
Races - Black alone (% change since 2000)
Races - American Indian alone (%)
Races - American Indian alone (% change since 2000)
Races - Asian alone (%)
Races - Asian alone (% change since 2000)
Races - Hispanic (%)
Races - Hispanic (% change since 2000)
Races - Native Hawaiian and Other Pacific Islander alone (%)
Races - Native Hawaiian and Other Pacific Islander alone (% change since 2000)
Races - Two or more races (%)
Races - Two or more races (% change since 2000)
Races - Other race alone (%)
Races - Other race alone (% change since 2000)
Racial diversity
Unemployment (%)
Unemployment (% change since 2000)
Unemployment (%) - White
Unemployment (%) - Black or African American
Unemployment (%) - Asian
Unemployment (%) - Hispanic or Latino
Unemployment (%) - American Indian and Alaska Native
Unemployment (%) - Multirace
Unemployment (%) - Other Race
Population density (people per square mile)
Population - Males (%)
Population - Females (%)
Population - Males (%) - White
Population - Males (%) - Black or African American
Population - Males (%) - Asian
Population - Males (%) - Hispanic or Latino
Population - Males (%) - American Indian and Alaska Native
Population - Males (%) - Multirace
Population - Males (%) - Other Race
Population - Females (%) - White
Population - Females (%) - Black or African American
Population - Females (%) - Asian
Population - Females (%) - Hispanic or Latino
Population - Females (%) - American Indian and Alaska Native
Population - Females (%) - Multirace
Population - Females (%) - Other Race
Coronavirus confirmed cases (Apr 27, 2024)
Deaths caused by coronavirus (Apr 27, 2024)
Coronavirus confirmed cases (per 100k population) (Apr 27, 2024)
Deaths caused by coronavirus (per 100k population) (Apr 27, 2024)
Daily increase in number of cases (Apr 27, 2024)
Weekly increase in number of cases (Apr 27, 2024)
Cases doubled (in days) (Apr 27, 2024)
Hospitalized patients (Apr 18, 2022)
Negative test results (Apr 18, 2022)
Total test results (Apr 18, 2022)
COVID Vaccine doses distributed (per 100k population) (Sep 19, 2023)
COVID Vaccine doses administered (per 100k population) (Sep 19, 2023)
COVID Vaccine doses distributed (Sep 19, 2023)
COVID Vaccine doses administered (Sep 19, 2023)
Likely homosexual households (%)
Likely homosexual households (% change since 2000)
Likely homosexual households - Lesbian couples (%)
Likely homosexual households - Lesbian couples (% change since 2000)
Likely homosexual households - Gay men (%)
Likely homosexual households - Gay men (% change since 2000)
Cost of living index
Median gross rent ($)
Median contract rent ($)
Median monthly housing costs ($)
Median house or condo value ($)
Median house or condo value ($ change since 2000)
Mean house or condo value by units in structure - 1, detached ($)
Mean house or condo value by units in structure - 1, attached ($)
Mean house or condo value by units in structure - 2 ($)
Mean house or condo value by units in structure by units in structure - 3 or 4 ($)
Mean house or condo value by units in structure - 5 or more ($)
Mean house or condo value by units in structure - Boat, RV, van, etc. ($)
Mean house or condo value by units in structure - Mobile home ($)
Median house or condo value ($) - White
Median house or condo value ($) - Black or African American
Median house or condo value ($) - Asian
Median house or condo value ($) - Hispanic or Latino
Median house or condo value ($) - American Indian and Alaska Native
Median house or condo value ($) - Multirace
Median house or condo value ($) - Other Race
Median resident age
Resident age diversity
Median resident age - Males
Median resident age - Females
Median resident age - White
Median resident age - Black or African American
Median resident age - Asian
Median resident age - Hispanic or Latino
Median resident age - American Indian and Alaska Native
Median resident age - Multirace
Median resident age - Other Race
Median resident age - Males - White
Median resident age - Males - Black or African American
Median resident age - Males - Asian
Median resident age - Males - Hispanic or Latino
Median resident age - Males - American Indian and Alaska Native
Median resident age - Males - Multirace
Median resident age - Males - Other Race
Median resident age - Females - White
Median resident age - Females - Black or African American
Median resident age - Females - Asian
Median resident age - Females - Hispanic or Latino
Median resident age - Females - American Indian and Alaska Native
Median resident age - Females - Multirace
Median resident age - Females - Other Race
Commute - mean travel time to work (minutes)
Travel time to work - Less than 5 minutes (%)
Travel time to work - Less than 5 minutes (% change since 2000)
Travel time to work - 5 to 9 minutes (%)
Travel time to work - 5 to 9 minutes (% change since 2000)
Travel time to work - 10 to 19 minutes (%)
Travel time to work - 10 to 19 minutes (% change since 2000)
Travel time to work - 20 to 29 minutes (%)
Travel time to work - 20 to 29 minutes (% change since 2000)
Travel time to work - 30 to 39 minutes (%)
Travel time to work - 30 to 39 minutes (% change since 2000)
Travel time to work - 40 to 59 minutes (%)
Travel time to work - 40 to 59 minutes (% change since 2000)
Travel time to work - 60 to 89 minutes (%)
Travel time to work - 60 to 89 minutes (% change since 2000)
Travel time to work - 90 or more minutes (%)
Travel time to work - 90 or more minutes (% change since 2000)
Marital status - Never married (%)
Marital status - Now married (%)
Marital status - Separated (%)
Marital status - Widowed (%)
Marital status - Divorced (%)
Median family income ($)
Median family income (% change since 2000)
Median non-family income ($)
Median non-family income (% change since 2000)
Median per capita income ($)
Median per capita income (% change since 2000)
Median family income ($) - White
Median family income ($) - Black or African American
Median family income ($) - Asian
Median family income ($) - Hispanic or Latino
Median family income ($) - American Indian and Alaska Native
Median family income ($) - Multirace
Median family income ($) - Other Race
Median year house/condo built
Median year apartment built
Year house built - Built 2005 or later (%)
Year house built - Built 2000 to 2004 (%)
Year house built - Built 1990 to 1999 (%)
Year house built - Built 1980 to 1989 (%)
Year house built - Built 1970 to 1979 (%)
Year house built - Built 1960 to 1969 (%)
Year house built - Built 1950 to 1959 (%)
Year house built - Built 1940 to 1949 (%)
Year house built - Built 1939 or earlier (%)
Average household size
Household density (households per square mile)
Average household size - White
Average household size - Black or African American
Average household size - Asian
Average household size - Hispanic or Latino
Average household size - American Indian and Alaska Native
Average household size - Multirace
Average household size - Other Race
Occupied housing units (%)
Vacant housing units (%)
Owner occupied housing units (%)
Renter occupied housing units (%)
Vacancy status - For rent (%)
Vacancy status - For sale only (%)
Vacancy status - Rented or sold, not occupied (%)
Vacancy status - For seasonal, recreational, or occasional use (%)
Vacancy status - For migrant workers (%)
Vacancy status - Other vacant (%)
Residents with income below the poverty level (%)
Residents with income below 50% of the poverty level (%)
Children below poverty level (%)
Poor families by family type - Married-couple family (%)
Poor families by family type - Male, no wife present (%)
Poor families by family type - Female, no husband present (%)
Poverty status for native-born residents (%)
Poverty status for foreign-born residents (%)
Poverty among high school graduates not in families (%)
Poverty among people who did not graduate high school not in families (%)
Residents with income below the poverty level (%) - White
Residents with income below the poverty level (%) - Black or African American
Residents with income below the poverty level (%) - Asian
Residents with income below the poverty level (%) - Hispanic or Latino
Residents with income below the poverty level (%) - American Indian and Alaska Native
Residents with income below the poverty level (%) - Multirace
Residents with income below the poverty level (%) - Other Race
Air pollution - Air Quality Index (AQI)
Air pollution - CO
Air pollution - NO2
Air pollution - SO2
Air pollution - Ozone
Air pollution - PM10
Air pollution - PM25
Air pollution - Pb
Crime - Murders per 100,000 population
Crime - Rapes per 100,000 population
Crime - Robberies per 100,000 population
Crime - Assaults per 100,000 population
Crime - Burglaries per 100,000 population
Crime - Thefts per 100,000 population
Crime - Auto thefts per 100,000 population
Crime - Arson per 100,000 population
Crime - City-data.com crime index
Crime - Violent crime index
Crime - Property crime index
Crime - Murders per 100,000 population (5 year average)
Crime - Rapes per 100,000 population (5 year average)
Crime - Robberies per 100,000 population (5 year average)
Crime - Assaults per 100,000 population (5 year average)
Crime - Burglaries per 100,000 population (5 year average)
Crime - Thefts per 100,000 population (5 year average)
Crime - Auto thefts per 100,000 population (5 year average)
Crime - Arson per 100,000 population (5 year average)
Crime - City-data.com crime index (5 year average)
Crime - Violent crime index (5 year average)
Crime - Property crime index (5 year average)
1996 Presidential Elections Results (%) - Democratic Party (Clinton)
1996 Presidential Elections Results (%) - Republican Party (Dole)
1996 Presidential Elections Results (%) - Other
2000 Presidential Elections Results (%) - Democratic Party (Gore)
2000 Presidential Elections Results (%) - Republican Party (Bush)
2000 Presidential Elections Results (%) - Other
2004 Presidential Elections Results (%) - Democratic Party (Kerry)
2004 Presidential Elections Results (%) - Republican Party (Bush)
2004 Presidential Elections Results (%) - Other
2008 Presidential Elections Results (%) - Democratic Party (Obama)
2008 Presidential Elections Results (%) - Republican Party (McCain)
2008 Presidential Elections Results (%) - Other
2012 Presidential Elections Results (%) - Democratic Party (Obama)
2012 Presidential Elections Results (%) - Republican Party (Romney)
2012 Presidential Elections Results (%) - Other
2016 Presidential Elections Results (%) - Democratic Party (Clinton)
2016 Presidential Elections Results (%) - Republican Party (Trump)
2016 Presidential Elections Results (%) - Other
2020 Presidential Elections Results (%) - Democratic Party (Biden)
2020 Presidential Elections Results (%) - Republican Party (Trump)
2020 Presidential Elections Results (%) - Other
Ancestries Reported - Arab (%)
Ancestries Reported - Czech (%)
Ancestries Reported - Danish (%)
Ancestries Reported - Dutch (%)
Ancestries Reported - English (%)
Ancestries Reported - French (%)
Ancestries Reported - French Canadian (%)
Ancestries Reported - German (%)
Ancestries Reported - Greek (%)
Ancestries Reported - Hungarian (%)
Ancestries Reported - Irish (%)
Ancestries Reported - Italian (%)
Ancestries Reported - Lithuanian (%)
Ancestries Reported - Norwegian (%)
Ancestries Reported - Polish (%)
Ancestries Reported - Portuguese (%)
Ancestries Reported - Russian (%)
Ancestries Reported - Scotch-Irish (%)
Ancestries Reported - Scottish (%)
Ancestries Reported - Slovak (%)
Ancestries Reported - Subsaharan African (%)
Ancestries Reported - Swedish (%)
Ancestries Reported - Swiss (%)
Ancestries Reported - Ukrainian (%)
Ancestries Reported - United States (%)
Ancestries Reported - Welsh (%)
Ancestries Reported - West Indian (%)
Ancestries Reported - Other (%)
Educational Attainment - No schooling completed (%)
Educational Attainment - Less than high school (%)
Educational Attainment - High school or equivalent (%)
Educational Attainment - Less than 1 year of college (%)
Educational Attainment - 1 or more years of college (%)
Educational Attainment - Associate degree (%)
Educational Attainment - Bachelor's degree (%)
Educational Attainment - Master's degree (%)
Educational Attainment - Professional school degree (%)
Educational Attainment - Doctorate degree (%)
School Enrollment - Nursery, preschool (%)
School Enrollment - Kindergarten (%)
School Enrollment - Grade 1 to 4 (%)
School Enrollment - Grade 5 to 8 (%)
School Enrollment - Grade 9 to 12 (%)
School Enrollment - College undergrad (%)
School Enrollment - Graduate or professional (%)
School Enrollment - Not enrolled in school (%)
School enrollment - Public schools (%)
School enrollment - Private schools (%)
School enrollment - Not enrolled (%)
Median number of rooms in houses and condos
Median number of rooms in apartments
Housing units lacking complete plumbing facilities (%)
Housing units lacking complete kitchen facilities (%)
Density of houses
Urban houses (%)
Rural houses (%)
Households with people 60 years and over (%)
Households with people 65 years and over (%)
Households with people 75 years and over (%)
Households with one or more nonrelatives (%)
Households with no nonrelatives (%)
Population in households (%)
Family households (%)
Nonfamily households (%)
Population in families (%)
Family households with own children (%)
Median number of bedrooms in owner occupied houses
Mean number of bedrooms in owner occupied houses
Median number of bedrooms in renter occupied houses
Mean number of bedrooms in renter occupied houses
Median number of vehichles in owner occupied houses
Mean number of vehichles in owner occupied houses
Median number of vehichles in renter occupied houses
Mean number of vehichles in renter occupied houses
Mortgage status - with mortgage (%)
Mortgage status - with second mortgage (%)
Mortgage status - with home equity loan (%)
Mortgage status - with both second mortgage and home equity loan (%)
Mortgage status - without a mortgage (%)
Average family size
Average family size - White
Average family size - Black or African American
Average family size - Asian
Average family size - Hispanic or Latino
Average family size - American Indian and Alaska Native
Average family size - Multirace
Average family size - Other Race
Geographical mobility - Same house 1 year ago (%)
Geographical mobility - Moved within same county (%)
Geographical mobility - Moved from different county within same state (%)
Geographical mobility - Moved from different state (%)
Geographical mobility - Moved from abroad (%)
Place of birth - Born in state of residence (%)
Place of birth - Born in other state (%)
Place of birth - Native, outside of US (%)
Place of birth - Foreign born (%)
Housing units in structures - 1, detached (%)
Housing units in structures - 1, attached (%)
Housing units in structures - 2 (%)
Housing units in structures - 3 or 4 (%)
Housing units in structures - 5 to 9 (%)
Housing units in structures - 10 to 19 (%)
Housing units in structures - 20 to 49 (%)
Housing units in structures - 50 or more (%)
Housing units in structures - Mobile home (%)
Housing units in structures - Boat, RV, van, etc. (%)
House/condo owner moved in on average (years ago)
Renter moved in on average (years ago)
Year householder moved into unit - Moved in 1999 to March 2000 (%)
Year householder moved into unit - Moved in 1995 to 1998 (%)
Year householder moved into unit - Moved in 1990 to 1994 (%)
Year householder moved into unit - Moved in 1980 to 1989 (%)
Year householder moved into unit - Moved in 1970 to 1979 (%)
Year householder moved into unit - Moved in 1969 or earlier (%)
Means of transportation to work - Drove car alone (%)
Means of transportation to work - Carpooled (%)
Means of transportation to work - Public transportation (%)
Means of transportation to work - Bus or trolley bus (%)
Means of transportation to work - Streetcar or trolley car (%)
Means of transportation to work - Subway or elevated (%)
Means of transportation to work - Railroad (%)
Means of transportation to work - Ferryboat (%)
Means of transportation to work - Taxicab (%)
Means of transportation to work - Motorcycle (%)
Means of transportation to work - Bicycle (%)
Means of transportation to work - Walked (%)
Means of transportation to work - Other means (%)
Working at home (%)
Industry diversity
Most Common Industries - Agriculture, forestry, fishing and hunting, and mining (%)
Most Common Industries - Agriculture, forestry, fishing and hunting (%)
Most Common Industries - Mining, quarrying, and oil and gas extraction (%)
Most Common Industries - Construction (%)
Most Common Industries - Manufacturing (%)
Most Common Industries - Wholesale trade (%)
Most Common Industries - Retail trade (%)
Most Common Industries - Transportation and warehousing, and utilities (%)
Most Common Industries - Transportation and warehousing (%)
Most Common Industries - Utilities (%)
Most Common Industries - Information (%)
Most Common Industries - Finance and insurance, and real estate and rental and leasing (%)
Most Common Industries - Finance and insurance (%)
Most Common Industries - Real estate and rental and leasing (%)
Most Common Industries - Professional, scientific, and management, and administrative and waste management services (%)
Most Common Industries - Professional, scientific, and technical services (%)
Most Common Industries - Management of companies and enterprises (%)
Most Common Industries - Administrative and support and waste management services (%)
Most Common Industries - Educational services, and health care and social assistance (%)
Most Common Industries - Educational services (%)
Most Common Industries - Health care and social assistance (%)
Most Common Industries - Arts, entertainment, and recreation, and accommodation and food services (%)
Most Common Industries - Arts, entertainment, and recreation (%)
Most Common Industries - Accommodation and food services (%)
Most Common Industries - Other services, except public administration (%)
Most Common Industries - Public administration (%)
Occupation diversity
Most Common Occupations - Management, business, science, and arts occupations (%)
Most Common Occupations - Management, business, and financial occupations (%)
Most Common Occupations - Management occupations (%)
Most Common Occupations - Business and financial operations occupations (%)
Most Common Occupations - Computer, engineering, and science occupations (%)
Most Common Occupations - Computer and mathematical occupations (%)
Most Common Occupations - Architecture and engineering occupations (%)
Most Common Occupations - Life, physical, and social science occupations (%)
Most Common Occupations - Education, legal, community service, arts, and media occupations (%)
Most Common Occupations - Community and social service occupations (%)
Most Common Occupations - Legal occupations (%)
Most Common Occupations - Education, training, and library occupations (%)
Most Common Occupations - Arts, design, entertainment, sports, and media occupations (%)
Most Common Occupations - Healthcare practitioners and technical occupations (%)
Most Common Occupations - Health diagnosing and treating practitioners and other technical occupations (%)
Most Common Occupations - Health technologists and technicians (%)
Most Common Occupations - Service occupations (%)
Most Common Occupations - Healthcare support occupations (%)
Most Common Occupations - Protective service occupations (%)
Most Common Occupations - Fire fighting and prevention, and other protective service workers including supervisors (%)
Most Common Occupations - Law enforcement workers including supervisors (%)
Most Common Occupations - Food preparation and serving related occupations (%)
Most Common Occupations - Building and grounds cleaning and maintenance occupations (%)
Most Common Occupations - Personal care and service occupations (%)
Most Common Occupations - Sales and office occupations (%)
Most Common Occupations - Sales and related occupations (%)
Most Common Occupations - Office and administrative support occupations (%)
Most Common Occupations - Natural resources, construction, and maintenance occupations (%)
Most Common Occupations - Farming, fishing, and forestry occupations (%)
Most Common Occupations - Construction and extraction occupations (%)
Most Common Occupations - Installation, maintenance, and repair occupations (%)
Most Common Occupations - Production, transportation, and material moving occupations (%)
Most Common Occupations - Production occupations (%)
Most Common Occupations - Transportation occupations (%)
Most Common Occupations - Material moving occupations (%)
People in Group quarters - Institutionalized population (%)
People in Group quarters - Correctional institutions (%)
People in Group quarters - Federal prisons and detention centers (%)
People in Group quarters - Halfway houses (%)
People in Group quarters - Local jails and other confinement facilities (including police lockups) (%)
People in Group quarters - Military disciplinary barracks (%)
People in Group quarters - State prisons (%)
People in Group quarters - Other types of correctional institutions (%)
People in Group quarters - Nursing homes (%)
People in Group quarters - Hospitals/wards, hospices, and schools for the handicapped (%)
People in Group quarters - Hospitals/wards and hospices for chronically ill (%)
People in Group quarters - Hospices or homes for chronically ill (%)
People in Group quarters - Military hospitals or wards for chronically ill (%)
People in Group quarters - Other hospitals or wards for chronically ill (%)
People in Group quarters - Hospitals or wards for drug/alcohol abuse (%)
People in Group quarters - Mental (Psychiatric) hospitals or wards (%)
People in Group quarters - Schools, hospitals, or wards for the mentally retarded (%)
People in Group quarters - Schools, hospitals, or wards for the physically handicapped (%)
People in Group quarters - Institutions for the deaf (%)
People in Group quarters - Institutions for the blind (%)
People in Group quarters - Orthopedic wards and institutions for the physically handicapped (%)
People in Group quarters - Wards in general hospitals for patients who have no usual home elsewhere (%)
People in Group quarters - Wards in military hospitals for patients who have no usual home elsewhere (%)
People in Group quarters - Juvenile institutions (%)
People in Group quarters - Long-term care (%)
People in Group quarters - Homes for abused, dependent, and neglected children (%)
People in Group quarters - Residential treatment centers for emotionally disturbed children (%)
People in Group quarters - Training schools for juvenile delinquents (%)
People in Group quarters - Short-term care, detention or diagnostic centers for delinquent children (%)
People in Group quarters - Type of juvenile institution unknown (%)
People in Group quarters - Noninstitutionalized population (%)
People in Group quarters - College dormitories (includes college quarters off campus) (%)
People in Group quarters - Military quarters (%)
People in Group quarters - On base (%)
People in Group quarters - Barracks, unaccompanied personnel housing (UPH), (Enlisted/Officer), ;and similar group living quarters for military personnel (%)
People in Group quarters - Transient quarters for temporary residents (%)
People in Group quarters - Military ships (%)
People in Group quarters - Group homes (%)
People in Group quarters - Homes or halfway houses for drug/alcohol abuse (%)
People in Group quarters - Homes for the mentally ill (%)
People in Group quarters - Homes for the mentally retarded (%)
People in Group quarters - Homes for the physically handicapped (%)
People in Group quarters - Other group homes (%)
People in Group quarters - Religious group quarters (%)
People in Group quarters - Dormitories (%)
People in Group quarters - Agriculture workers' dormitories on farms (%)
People in Group quarters - Job Corps and vocational training facilities (%)
People in Group quarters - Other workers' dormitories (%)
People in Group quarters - Crews of maritime vessels (%)
People in Group quarters - Other nonhousehold living situations (%)
People in Group quarters - Other noninstitutional group quarters (%)
Residents speaking English at home (%)
Residents speaking English at home - Born in the United States (%)
Residents speaking English at home - Native, born elsewhere (%)
Residents speaking English at home - Foreign born (%)
Residents speaking Spanish at home (%)
Residents speaking Spanish at home - Born in the United States (%)
Residents speaking Spanish at home - Native, born elsewhere (%)
Residents speaking Spanish at home - Foreign born (%)
Residents speaking other language at home (%)
Residents speaking other language at home - Born in the United States (%)
Residents speaking other language at home - Native, born elsewhere (%)
Residents speaking other language at home - Foreign born (%)
Class of Workers - Employee of private company (%)
Class of Workers - Self-employed in own incorporated business (%)
Class of Workers - Private not-for-profit wage and salary workers (%)
Class of Workers - Local government workers (%)
Class of Workers - State government workers (%)
Class of Workers - Federal government workers (%)
Class of Workers - Self-employed workers in own not incorporated business and Unpaid family workers (%)
House heating fuel used in houses and condos - Utility gas (%)
House heating fuel used in houses and condos - Bottled, tank, or LP gas (%)
House heating fuel used in houses and condos - Electricity (%)
House heating fuel used in houses and condos - Fuel oil, kerosene, etc. (%)
House heating fuel used in houses and condos - Coal or coke (%)
House heating fuel used in houses and condos - Wood (%)
House heating fuel used in houses and condos - Solar energy (%)
House heating fuel used in houses and condos - Other fuel (%)
House heating fuel used in houses and condos - No fuel used (%)
House heating fuel used in apartments - Utility gas (%)
House heating fuel used in apartments - Bottled, tank, or LP gas (%)
House heating fuel used in apartments - Electricity (%)
House heating fuel used in apartments - Fuel oil, kerosene, etc. (%)
House heating fuel used in apartments - Coal or coke (%)
House heating fuel used in apartments - Wood (%)
House heating fuel used in apartments - Solar energy (%)
House heating fuel used in apartments - Other fuel (%)
House heating fuel used in apartments - No fuel used (%)
Armed forces status - In Armed Forces (%)
Armed forces status - Civilian (%)
Armed forces status - Civilian - Veteran (%)
Armed forces status - Civilian - Nonveteran (%)
Fatal accidents locations in years 2005-2021
Fatal accidents locations in 2005
Fatal accidents locations in 2006
Fatal accidents locations in 2007
Fatal accidents locations in 2008
Fatal accidents locations in 2009
Fatal accidents locations in 2010
Fatal accidents locations in 2011
Fatal accidents locations in 2012
Fatal accidents locations in 2013
Fatal accidents locations in 2014
Fatal accidents locations in 2015
Fatal accidents locations in 2016
Fatal accidents locations in 2017
Fatal accidents locations in 2018
Fatal accidents locations in 2019
Fatal accidents locations in 2020
Fatal accidents locations in 2021
Alcohol use - People drinking some alcohol every month (%)
Alcohol use - People not drinking at all (%)
Alcohol use - Average days/month drinking alcohol
Alcohol use - Average drinks/week
Alcohol use - Average days/year people drink much
Audiometry - Average condition of hearing (%)
Audiometry - People that can hear a whisper from across a quiet room (%)
Audiometry - People that can hear normal voice from across a quiet room (%)
Audiometry - Ears ringing, roaring, buzzing (%)
Audiometry - Had a job exposure to loud noise (%)
Audiometry - Had off-work exposure to loud noise (%)
Blood Pressure & Cholesterol - Has high blood pressure (%)
Blood Pressure & Cholesterol - Checking blood pressure at home (%)
Blood Pressure & Cholesterol - Frequently checking blood cholesterol (%)
Blood Pressure & Cholesterol - Has high cholesterol level (%)
Consumer Behavior - Money monthly spent on food at supermarket/grocery store
Consumer Behavior - Money monthly spent on food at other stores
Consumer Behavior - Money monthly spent on eating out
Consumer Behavior - Money monthly spent on carryout/delivered foods
Consumer Behavior - Income spent on food at supermarket/grocery store (%)
Consumer Behavior - Income spent on food at other stores (%)
Consumer Behavior - Income spent on eating out (%)
Consumer Behavior - Income spent on carryout/delivered foods (%)
Current Health Status - General health condition (%)
Current Health Status - Blood donors (%)
Current Health Status - Has blood ever tested for HIV virus (%)
Current Health Status - Left-handed people (%)
Dermatology - People using sunscreen (%)
Diabetes - Diabetics (%)
Diabetes - Had a blood test for high blood sugar (%)
Diabetes - People taking insulin (%)
Diet Behavior & Nutrition - Diet health (%)
Diet Behavior & Nutrition - Milk product consumption (# of products/month)
Diet Behavior & Nutrition - Meals not home prepared (#/week)
Diet Behavior & Nutrition - Meals from fast food or pizza place (#/week)
Diet Behavior & Nutrition - Ready-to-eat foods (#/month)
Diet Behavior & Nutrition - Frozen meals/pizza (#/month)
Drug Use - People that ever used marijuana or hashish (%)
Drug Use - Ever used hard drugs (%)
Drug Use - Ever used any form of cocaine (%)
Drug Use - Ever used heroin (%)
Drug Use - Ever used methamphetamine (%)
Health Insurance - People covered by health insurance (%)
Kidney Conditions-Urology - Avg. # of times urinating at night
Medical Conditions - People with asthma (%)
Medical Conditions - People with anemia (%)
Medical Conditions - People with psoriasis (%)
Medical Conditions - People with overweight (%)
Medical Conditions - Elderly people having difficulties in thinking or remembering (%)
Medical Conditions - People who ever received blood transfusion (%)
Medical Conditions - People having trouble seeing even with glass/contacts (%)
Medical Conditions - People with arthritis (%)
Medical Conditions - People with gout (%)
Medical Conditions - People with congestive heart failure (%)
Medical Conditions - People with coronary heart disease (%)
Medical Conditions - People with angina pectoris (%)
Medical Conditions - People who ever had heart attack (%)
Medical Conditions - People who ever had stroke (%)
Medical Conditions - People with emphysema (%)
Medical Conditions - People with thyroid problem (%)
Medical Conditions - People with chronic bronchitis (%)
Medical Conditions - People with any liver condition (%)
Medical Conditions - People who ever had cancer or malignancy (%)
Mental Health - People who have little interest in doing things (%)
Mental Health - People feeling down, depressed, or hopeless (%)
Mental Health - People who have trouble sleeping or sleeping too much (%)
Mental Health - People feeling tired or having little energy (%)
Mental Health - People with poor appetite or overeating (%)
Mental Health - People feeling bad about themself (%)
Mental Health - People who have trouble concentrating on things (%)
Mental Health - People moving or speaking slowly or too fast (%)
Mental Health - People having thoughts they would be better off dead (%)
Oral Health - Average years since last visit a dentist
Oral Health - People embarrassed because of mouth (%)
Oral Health - People with gum disease (%)
Oral Health - General health of teeth and gums (%)
Oral Health - Average days a week using dental floss/device
Oral Health - Average days a week using mouthwash for dental problem
Oral Health - Average number of teeth
Pesticide Use - Households using pesticides to control insects (%)
Pesticide Use - Households using pesticides to kill weeds (%)
Physical Activity - People doing vigorous-intensity work activities (%)
Physical Activity - People doing moderate-intensity work activities (%)
Physical Activity - People walking or bicycling (%)
Physical Activity - People doing vigorous-intensity recreational activities (%)
Physical Activity - People doing moderate-intensity recreational activities (%)
Physical Activity - Average hours a day doing sedentary activities
Physical Activity - Average hours a day watching TV or videos
Physical Activity - Average hours a day using computer
Physical Functioning - People having limitations keeping them from working (%)
Physical Functioning - People limited in amount of work they can do (%)
Physical Functioning - People that need special equipment to walk (%)
Physical Functioning - People experiencing confusion/memory problems (%)
Physical Functioning - People requiring special healthcare equipment (%)
Prescription Medications - Average number of prescription medicines taking
Preventive Aspirin Use - Adults 40+ taking low-dose aspirin (%)
Reproductive Health - Vaginal deliveries (%)
Reproductive Health - Cesarean deliveries (%)
Reproductive Health - Deliveries resulted in a live birth (%)
Reproductive Health - Pregnancies resulted in a delivery (%)
Reproductive Health - Women breastfeeding newborns (%)
Reproductive Health - Women that had a hysterectomy (%)
Reproductive Health - Women that had both ovaries removed (%)
Reproductive Health - Women that have ever taken birth control pills (%)
Reproductive Health - Women taking birth control pills (%)
Reproductive Health - Women that have ever used Depo-Provera or injectables (%)
Reproductive Health - Women that have ever used female hormones (%)
Sexual Behavior - People 18+ that ever had sex (vaginal, anal, or oral) (%)
Sexual Behavior - Males 18+ that ever had vaginal sex with a woman (%)
Sexual Behavior - Males 18+ that ever performed oral sex on a woman (%)
Sexual Behavior - Males 18+ that ever had anal sex with a woman (%)
Sexual Behavior - Males 18+ that ever had any sex with a man (%)
Sexual Behavior - Females 18+ that ever had vaginal sex with a man (%)
Sexual Behavior - Females 18+ that ever performed oral sex on a man (%)
Sexual Behavior - Females 18+ that ever had anal sex with a man (%)
Sexual Behavior - Females 18+ that ever had any kind of sex with a woman (%)
Sexual Behavior - Average age people first had sex
Sexual Behavior - Average number of female sex partners in lifetime (males 18+)
Sexual Behavior - Average number of female vaginal sex partners in lifetime (males 18+)
Sexual Behavior - Average age people first performed oral sex on a woman (18+)
Sexual Behavior - Average number of woman performed oral sex on in lifetime (18+)
Sexual Behavior - Average number of male sex partners in lifetime (males 18+)
Sexual Behavior - Average number of male anal sex partners in lifetime (males 18+)
Sexual Behavior - Average age people first performed oral sex on a man (18+)
Sexual Behavior - Average number of male oral sex partners in lifetime (18+)
Sexual Behavior - People using protection when performing oral sex (%)
Sexual Behavior - Average number of times people have vaginal or anal sex a year
Sexual Behavior - People having sex without condom (%)
Sexual Behavior - Average number of male sex partners in lifetime (females 18+)
Sexual Behavior - Average number of male vaginal sex partners in lifetime (females 18+)
Sexual Behavior - Average number of female sex partners in lifetime (females 18+)
Sexual Behavior - Circumcised males 18+ (%)
Sleep Disorders - Average hours sleeping at night
Sleep Disorders - People that has trouble sleeping (%)
Smoking-Cigarette Use - People smoking cigarettes (%)
Taste & Smell - People 40+ having problems with smell (%)
Taste & Smell - People 40+ having problems with taste (%)
Taste & Smell - People 40+ that ever had wisdom teeth removed (%)
Taste & Smell - People 40+ that ever had tonsils teeth removed (%)
Taste & Smell - People 40+ that ever had a loss of consciousness because of a head injury (%)
Taste & Smell - People 40+ that ever had a broken nose or other serious injury to face or skull (%)
Taste & Smell - People 40+ that ever had two or more sinus infections (%)
Weight - Average height (inches)
Weight - Average weight (pounds)
Weight - Average BMI
Weight - People that are obese (%)
Weight - People that ever were obese (%)
Weight - People trying to lose weight (%)
Urban population: 45,054
Rural population: 1,265
Estimated median house/condo value in 2022: $389,849
34655:
$389,849Florida:
$354,100
According to our research of Florida and other state lists, there were 26 registered sex offenders living in 34655 zip code as of April 27, 2024 . The ratio of all residents to sex offenders in zip code 34655 is 1,515 to 1.The ratio of registered sex offenders to all residents in this zip code is much lower than the state average.
Median resident age: This zip code:
46.6 yearsFlorida median age:
42.7 years
Average household size: This zip code:
2.4 peopleFlorida:
2.5 people
Averages for the 2020 tax year for zip code 34655, filed in 2021:
Average Adjusted Gross Income (AGI) in 2020: $79,001 (Individual Income Tax Returns) Here:
$79,001State:
$82,200
Salary/wage: $64,785 (reported on 73.1% of returns )Here:
$64,785State:
$58,347
(% of AGI for various income ranges: 1053.6% for AGIs below $25k , 3336.2% for AGIs $25k-50k , 5718.8% for AGIs $50k-75k , 8299.9% for AGIs $75k-100k , 17174.8% for AGIs $100k-200k , 68900.5% for AGIs over 200k ) Taxable interest for individuals: $2,244 (reported on 33.4% of returns )This zip code:
$2,244Florida:
$4,272
(% of AGI for various income ranges: 32.4% for AGIs below $25k , 38.9% for AGIs $25k-50k , 82.9% for AGIs $50k-75k , 128.2% for AGIs $75k-100k , 190.8% for AGIs $100k-200k , 1590.8% for AGIs over 200k ) Ordinary dividends: $5,664 (reported on 25.1% of returns )(% of AGI for various income ranges: 46.5% for AGIs below $25k , 71.6% for AGIs $25k-50k , 159.6% for AGIs $50k-75k , 231.5% for AGIs $75k-100k , 416.5% for AGIs $100k-200k , 2943.2% for AGIs over 200k ) Net capital gain/loss in AGI: +$14,033 (reported on 22.8% of returns )Here:
+$14,033State:
+$62,983
(% of AGI for various income ranges: 13.7% for AGIs below $25k , 48.9% for AGIs $25k-50k , 121.1% for AGIs $50k-75k , 246.9% for AGIs $75k-100k , 645.8% for AGIs $100k-200k , 13340.5% for AGIs over 200k ) Profit/loss from business: +$11,474 (reported on 15.9% of returns )Here:
+$11,474State:
+$9,719
(% of AGI for various income ranges: 135.3% for AGIs below $25k , 120.0% for AGIs $25k-50k , 198.7% for AGIs $50k-75k , 237.6% for AGIs $75k-100k , 561.2% for AGIs $100k-200k , 2645.7% for AGIs over 200k ) Taxable individual retirement arrangement distribution: $19,687 (reported on 15.3% of returns )34655:
$19,687Florida:
$24,823
(% of AGI for various income ranges: 116.4% for AGIs below $25k , 211.0% for AGIs $25k-50k , 408.2% for AGIs $50k-75k , 674.9% for AGIs $75k-100k , 953.8% for AGIs $100k-200k , 3662.4% for AGIs over 200k ) Self-employed (Keogh) retirement plans: $18,220 (reported on 0.2% of returns )34655:
$18,220Florida:
$29,694
(% of AGI for various income ranges: 246.2% for AGIs over 200k ) Total itemized deductions: $34,373 (reported on 6.7% of returns )Here:
$34,373State:
$45,393
(% of AGI for various income ranges: 60.1% for AGIs below $25k , 135.9% for AGIs $25k-50k , 253.7% for AGIs $50k-75k , 372.5% for AGIs $75k-100k , 697.0% for AGIs $100k-200k , 4620.8% for AGIs over 200k ) Charity contributions: $8,262 (reported on 5.3% of returns )(% of AGI for various income ranges: 3.4% for AGIs below $25k , 16.2% for AGIs $25k-50k , 36.8% for AGIs $50k-75k , 43.0% for AGIs $75k-100k , 173.8% for AGIs $100k-200k , 1018.4% for AGIs over 200k ) Taxes paid: $6,011 (reported on 6.6% of returns )(% of AGI for various income ranges: 7.8% for AGIs below $25k , 18.7% for AGIs $25k-50k , 44.0% for AGIs $50k-75k , 67.8% for AGIs $75k-100k , 139.0% for AGIs $100k-200k , 749.5% for AGIs over 200k ) Earned income credit: $2,078 (reported on 10.9% of returns )(% of AGI for various income ranges: 66.5% for AGIs below $25k , 53.1% for AGIs $25k-50k , 0.9% for AGIs $50k-75k ) Percentage of individuals using paid preparers for their 2020 taxes: 92.7%(% for various income ranges: 91.5% for AGIs below $25k , 93.3% for AGIs $25k-50k , 93.4% for AGIs $50k-75k , 92.3% for AGIs $75k-100k , 93.1% for AGIs $100k-200k , 93.3% for AGIs over 200k )
Averages for the 2012 tax year for zip code 34655, filed in 2013:
Average Adjusted Gross Income (AGI) in 2012: $60,647 (Individual Income Tax Returns) Here:
$60,647State:
$60,316
Salary/wage: $53,455 (reported on 73.2% of returns )Here:
$53,455State:
$45,277
(% of AGI for various income ranges: 61.2% for AGIs below $25k , 66.1% for AGIs $25k-50k , 63.1% for AGIs $50k-75k , 65.2% for AGIs $75k-100k , 71.5% for AGIs $100k-200k , 53.4% for AGIs over 200k ) Taxable interest for individuals: $2,088 (reported on 40.7% of returns )This zip code:
$2,088Florida:
$3,587
(% of AGI for various income ranges: 3.0% for AGIs below $25k , 1.5% for AGIs $25k-50k , 1.3% for AGIs $50k-75k , 1.1% for AGIs $75k-100k , 1.0% for AGIs $100k-200k , 1.7% for AGIs over 200k ) Ordinary dividends: $5,357 (reported on 27.2% of returns )(% of AGI for various income ranges: 3.8% for AGIs below $25k , 1.9% for AGIs $25k-50k , 2.0% for AGIs $50k-75k , 1.8% for AGIs $75k-100k , 1.8% for AGIs $100k-200k , 4.1% for AGIs over 200k ) Net capital gain/loss in AGI: +$7,310 (reported on 22.2% of returns )Here:
+$7,310State:
+$33,493
(% of AGI for various income ranges: 0.4% for AGIs $50k-75k , 0.9% for AGIs $75k-100k , 1.3% for AGIs $100k-200k , 12.2% for AGIs over 200k ) Profit/loss from business: +$10,707 (reported on 13.9% of returns )Here:
+$10,707State:
+$10,012
(% of AGI for various income ranges: 7.4% for AGIs below $25k , 2.7% for AGIs $25k-50k , 1.8% for AGIs $50k-75k , 2.0% for AGIs $75k-100k , 2.0% for AGIs $100k-200k , 2.2% for AGIs over 200k ) Taxable individual retirement arrangement distribution: $16,061 (reported on 18.7% of returns )34655:
$16,061Florida:
$21,544
(% of AGI for various income ranges: 6.7% for AGIs below $25k , 5.6% for AGIs $25k-50k , 4.9% for AGIs $50k-75k , 5.6% for AGIs $75k-100k , 4.9% for AGIs $100k-200k , 3.4% for AGIs over 200k ) Self-employment retirement plans: $18,220 (reported on 0.3% of returns )34655:
$18,220Florida:
$20,611
Total itemized deductions: $20,595 (20% of AGI, reported on 31.2% of returns )Here:
$20,595State:
$25,533
Here:
20.2% of AGIState:
18.0% of AGI
(% of AGI for various income ranges: 12.2% for AGIs below $25k , 10.5% for AGIs $25k-50k , 10.8% for AGIs $50k-75k , 10.9% for AGIs $75k-100k , 11.1% for AGIs $100k-200k , 8.8% for AGIs over 200k ) Charity contributions: $3,100 (reported on 26.0% of returns )(% of AGI for various income ranges: 0.9% for AGIs below $25k , 1.1% for AGIs $25k-50k , 1.3% for AGIs $50k-75k , 1.3% for AGIs $75k-100k , 1.6% for AGIs $100k-200k , 1.3% for AGIs over 200k ) Taxes paid: $4,711 (reported on 30.8% of returns )(% of AGI for various income ranges: 2.8% for AGIs below $25k , 2.1% for AGIs $25k-50k , 2.1% for AGIs $50k-75k , 2.4% for AGIs $75k-100k , 2.6% for AGIs $100k-200k , 2.3% for AGIs over 200k ) Earned income credit: $1,979 (reported on 11.5% of returns )(% of AGI for various income ranges: 3.9% for AGIs below $25k , 0.8% for AGIs $25k-50k ) Percentage of individuals using paid preparers for their 2012 taxes: 48.7%(% for various income ranges: 43.5% for AGIs below $25k , 45.9% for AGIs $25k-50k , 51.9% for AGIs $50k-75k , 52.0% for AGIs $75k-100k , 55.1% for AGIs $100k-200k , 73.1% for AGIs over 200k )
Averages for the 2004 tax year for zip code 34655, filed in 2005:
Average Adjusted Gross Income (AGI) in 2004: $52,666 (Individual Income Tax Returns) Here:
$52,666State:
$50,523
Salary/wage: $45,755 (reported on 72.8% of returns )Here:
$45,755State:
$39,563
(% of AGI for various income ranges: 134.9% for AGIs below $10k , 54.6% for AGIs $10k-25k , 61.8% for AGIs $25k-50k , 64.9% for AGIs $50k-75k , 70.4% for AGIs $75k-100k , 60.0% for AGIs over 100k ) Taxable interest for individuals: $2,374 (reported on 58.3% of returns )This zip code:
$2,374Florida:
$3,211
(% of AGI for various income ranges: 13.8% for AGIs below $10k , 5.9% for AGIs $10k-25k , 3.6% for AGIs $25k-50k , 2.3% for AGIs $50k-75k , 1.9% for AGIs $75k-100k , 1.8% for AGIs over 100k ) Taxable dividends: $3,206 (reported on 35.2% of returns )(% of AGI for various income ranges: 9.5% for AGIs below $10k , 3.7% for AGIs $10k-25k , 2.5% for AGIs $25k-50k , 1.8% for AGIs $50k-75k , 1.6% for AGIs $75k-100k , 2.0% for AGIs over 100k ) Net capital gain/loss: +$10,524 (reported on 30.6% of returns )Here:
+$10,524State:
+$27,205
(% of AGI for various income ranges: -5.7% for AGIs below $10k , -0.0% for AGIs $10k-25k , 0.6% for AGIs $25k-50k , 1.2% for AGIs $50k-75k , 1.8% for AGIs $75k-100k , 14.2% for AGIs over 100k ) Profit/loss from business: +$11,671 (reported on 13.3% of returns )Here:
+$11,671State:
+$10,634
(% of AGI for various income ranges: 8.2% for AGIs below $10k , 5.0% for AGIs $10k-25k , 2.6% for AGIs $25k-50k , 2.1% for AGIs $50k-75k , 1.8% for AGIs $75k-100k , 3.6% for AGIs over 100k ) IRA payment deduction: $3,431 (reported on 3.2% of returns )34655:
$3,431Florida:
$3,082
(% of AGI for various income ranges: 0.4% for AGIs below $10k , 0.2% for AGIs $10k-25k , 0.3% for AGIs $25k-50k , 0.3% for AGIs $50k-75k , 0.1% for AGIs $75k-100k , 0.1% for AGIs over 100k ) Self-employed pension: $12,046 (reported on 0.5% of returns )Here:
$12,046Florida:
$15,857
(% of AGI for various income ranges: 0.1% for AGIs $25k-50k , 0.1% for AGIs $50k-75k , 0.1% for AGIs $75k-100k , 0.2% for AGIs over 100k ) Total itemized deductions: $17,627 (22% of AGI, reported on 39.7% of returns )Here:
$17,627State:
$20,370
Here:
21.6% of AGIState:
20.7% of AGI
(% of AGI for various income ranges: 30.0% for AGIs below $10k , 14.5% for AGIs $10k-25k , 14.5% for AGIs $25k-50k , 15.0% for AGIs $50k-75k , 15.0% for AGIs $75k-100k , 10.5% for AGIs over 100k ) Charity contributions deductions: $2,813 (3% of AGI, reported on 35.1% of returns )Here:
3.3% of AGIState:
3.8% of AGI
(% of AGI for various income ranges: 1.3% for AGIs below $10k , 1.2% for AGIs $10k-25k , 1.4% for AGIs $25k-50k , 1.9% for AGIs $50k-75k , 2.0% for AGIs $75k-100k , 2.2% for AGIs over 100k ) Total tax: $7,643 (reported on 80.0% of returns )(% of AGI for various income ranges: 4.2% for AGIs below $10k , 3.7% for AGIs $10k-25k , 6.5% for AGIs $25k-50k , 8.6% for AGIs $50k-75k , 10.1% for AGIs $75k-100k , 17.5% for AGIs over 100k ) Earned income credit: $1,543 (reported on 8.5% of returns )Percentage of individuals using paid preparers for their 2004 taxes: 56.6%(% for various income ranges: 50.1% for AGIs below $10k , 56.5% for AGIs $10k-25k , 56.9% for AGIs $25k-50k , 57.0% for AGIs $50k-75k , 55.8% for AGIs $75k-100k , 65.2% for AGIs over 100k )
Estimated median household income in 2022: This zip code:
$77,602Florida:
$69,303
Nearest zip codes: 33556 ,
34653 ,
34654 ,
34688 ,
34690 ,
33558 .
Percentage of family households: This zip code:
41.5%Florida:
41.2%
Percentage of households with unmarried partners: This zip code:
3.2%Florida:
46.7%
Likely homosexual households (counted as self-reported same-sex unmarried-partner households)
Lesbian couples: 0.1% of all households Gay men: 0.1% of all households
Household received Food Stamps/SNAP in the past 12 months: 1,227Household did not receive Food Stamps/SNAP in the past 12 months: 18,404
Women who had a birth in the past 12 months: 658 (381 now married , 270 unmarried) Women who did not have a birth in the past 12 months: 8,649 (4,355 now married , 4,297 unmarried)
Housing units in zip code 34655 with a mortgage: 9,462 (832
second mortgage , 745
both second mortgage and home equity loan )
Houses without a mortgage: 301
Median monthly owner costs for units with a mortgage: $1,873
Median monthly owner costs for units without a mortgage: $606
Residents with income below the poverty level in 2022:
This zip code:
9.4%Whole state:
12.7%
Residents with income below 50% of the poverty level in 2022:
This zip code:
6.3%Whole state:
6.6%
Median number of rooms in houses and condos: Median number of rooms in apartments:
Year house built (houses)
87 2020 or later3,263 2010 to 20196,453 2000 to 20094,268 1990 to 19994,115 1980 to 19892,149 1970 to 1979350 1960 to 196979 1950 to 19590 1940 to 194938 1939 or earlier
Zip code 34655 household income distribution in 2022 609 Less than $10,000541 $10,000 to $14,999819 $15,000 to $19,999555 $20,000 to $24,999453 $25,000 to $29,999726 $30,000 to $34,999584 $35,000 to $39,999773 $40,000 to $44,999971 $45,000 to $49,9991,502 $50,000 to $59,9991,844 $60,000 to $74,9992,198 $75,000 to $99,9992,215 $100,000 to $124,9991,397 $125,000 to $149,9992,336 $150,000 to $199,9992,042 $200,000 or moreEstimate of home value of owner-occupied houses/condos in 2022 in zip code 34655 47 Less than $10,00023 $15,000 to $19,99924 $20,000 to $24,99915 $25,000 to $29,99919 $30,000 to $34,9998 $35,000 to $39,999238 $40,000 to $49,99997 $50,000 to $59,999144 $60,000 to $69,999114 $70,000 to $79,99956 $80,000 to $89,99955 $90,000 to $99,999232 $100,000 to $124,999259 $125,000 to $149,999658 $150,000 to $174,999506 $175,000 to $199,9991,050 $200,000 to $249,9991,516 $250,000 to $299,9994,851 $300,000 to $399,9993,092 $400,000 to $499,9991,842 $500,000 to $749,999411 $750,000 to $999,999274 $1,000,000 to $1,499,99916 $2,000,000 or moreRent paid by renters in 2022 in zip code 34655 15 Less than $10038 $200 to $2497 $450 to $49959 $500 to $5499 $550 to $59923 $600 to $64931 $650 to $69944 $700 to $74996 $750 to $799150 $800 to $899240 $900 to $999925 $1,000 to $1,249490 $1,250 to $1,4991,006 $1,500 to $1,999730 $2,000 to $2,499230 $2,500 to $2,99915 $3,000 to $3,499140 No cash rent
Median gross rent in 2022: $1,609.
Median price asked for vacant for-sale houses and condos in 2022: $293,979.
Estimated median house (or condo) value in 2022 for: White Non-Hispanic householders: $413,922Black or African American householders: $390,927Asian householders: $350,325Some other race householders: $68,268Two or more races householders: $291,758Hispanic or Latino householders: $359,308Estimated median house or condo value in 2022: $389,849
34655:
$389,849Florida:
$354,100
Lower value quartile - upper value quartile: $261,349 - $494,572
Mean price in 2022: Detached houses: $263,494Here:
$263,494State:
$500,941
Townhouses or other attached units: $100,439Here:
$100,439State:
$370,869
Housing units in structures:
One, detached: 14,808One, attached: 2,278Two: 953 or 4: 3625 to 9: 73710 to 19: 75620 to 49: 56150 or more: 641Mobile homes: 682Unemployment : 3.0%
Means of transportation to work in zip code 34655 68.8% 14,681 Drove a car alone6.5% 1,394 Carpooled0.2% 34 Bus or trolley bus0.1% 11 Taxi0.5% 107 Motorcycle0.2% 49 Bicycle0.8% 169 Walked0.4% 93 Other means24.9% 5,308 Worked at homeTravel time to work (commute) in zip code 34655 311 Less than 5 minutes1,270 5 to 9 minutes1,586 10 to 14 minutes1,855 15 to 19 minutes2,044 20 to 24 minutes890 25 to 29 minutes2,122 30 to 34 minutes840 35 to 39 minutes821 40 to 44 minutes2,904 45 to 59 minutes1,568 60 to 89 minutes375 90 or more minutes
Neighborhoods in zip code 34655: Percentage of zip code residents living and working in this county: 57.2%
Household type by relationship:
Households: 46,320
Male householders: 10,631 (2,108 living alone ), Female householders: 8,901 (3,039 living alone )10,713 spouses (10,650 opposite-sex spouses ), 932 unmarried partners , (887 opposite-sex unmarried partners ), 12,065 children (11,552 natural , 275 adopted , 255 stepchildren ), 562 grandchildren , 195 brothers or sisters , 797 parents , 20 foster children , 409 other relatives , 1,128 non-relatives In group quarters: 130 (-1 institutionalized population )
Size of family households: 6,413 2-persons , 2,927 3-persons , 2,207 4-persons , 1,064 5-persons , 186 6-persons , 184 7-or-more-persons
Size of nonfamily households: 5,149 1-person , 984 2-persons , 385 3-persons , 3 4-persons
6,401 married couples with children. single-parent households (371 men , 1,529 women ).
86.5% of residents of 34655 zip code speak English at home. of residents speak Spanish at home (70% very well, 19% well, 5% not well, 5% not at all ).of residents speak other Indo-European language at home (81% very well, 13% well, 4% not well, 2% not at all ).of residents speak Asian or Pacific Island language at home (72% very well, 14% well, 14% not well ).of residents speak other language at home (63% very well, 26% well, 11% not well ).
Foreign born population: 5,492 (11.9%)
(79.2%
of them are naturalized citizens )
This zip code:
11.9%Whole state:
21.7%
24% Algeria 6% Bhutan 5% Barbados 5% Serbia 4% Saudi Arabia 4% Thailand 4% Malaysia 27% American 9% Italian 8% Irish 8% English 8% German 3% Polish 3% Egyptian
Year of entry for the foreign-born population
1,766 2010 or later 1,154 2000 to 2009 1,306 1990 to 1999 1,916 Before 1990
Major facilities with environmental interests located in this zip code:
MAGNOLIA ESTATES (SW CORNER PERRINE RANCH RD in NEW PORT RICHEY, FL)
National Pollutant Discharge Elimination System NON-MAJOR (Tracking pollutant discharge elimination systems) - permit National Pollutant Discharge Elimination System NON-MAJOR (Tracking pollutant discharge elimination systems) - permit Organizations: ALEX DEEB (CONTACT/OWNER)
, BENJAMIN WILSON (CONTACT/OWNER)
ROSS POOL SVC INC DBA POOLSIDE (2340 SEVEN SPRINGS BLVD in NEW PORT RICHEY, FL)
(Integrated Compliance Information System) - ICIS-04-1997-0179, FORMAL ENFORCEMENT ACTION COMPLIANCE ACTIVITY (Tracking inspections of insecticide, fungicide, and rodenticide, and toxic substances) Business SIC classification: MISCELLANEOUS RETAIL STORESAlternative names: ROSS POOL SERVICE, INC, ROSS POOL SERVICE, INC. D/B/A POOLSIDE
JAMES W. MITCHELL HIGH SCHOOL (2323 LITTLE ROAD in NEW PORT RICHEY, FL)
(National Center for Education Statistics) - STATE ID-0073 Organizations: PASCO COUNTY SCHOOL DISTRICT (SCHOOL DISTRICT)
SEVEN SPRINGS ELEMENTARY SCHOOL (8025 MITCHELL RANCH ROAD in NEW PORT RICHEY, FL)
(National Center for Education Statistics) - STATE ID-0411 Organizations: PASCO COUNTY SCHOOL DISTRICT (SCHOOL DISTRICT)
SEVEN SPRINGS MIDDLE SCHOOL (2441 LITTLE ROAD in NEW PORT RICHEY, FL)
(National Center for Education Statistics) - STATE ID-0057 Organizations: PASCO COUNTY SCHOOL DISTRICT (SCHOOL DISTRICT)
AMSOUTH BANK, MITCHELL RANCH (MITCHELL RANCH ROAD (SR 54) AN in SEVEN SPRINGS, FL)
National Pollutant Discharge Elimination System NON-MAJOR (Tracking pollutant discharge elimination systems) - permit Organizations: GREG HARRIS (CONTACT/OWNER)
HERITAGE SPRINGS VILLAGE 23, 2 (ROBERT TRENT JONES PKWY & FALL in NEW PORT RICHEY, FL)
National Pollutant Discharge Elimination System NON-MAJOR (Tracking pollutant discharge elimination systems) - permit Organizations: FRANCINE MILLER (CONTACT/OWNER)
Alternative names: BROCK SOUTHERN CONST DEER RUN
RIVER CROSSING REDEVELOPMENT (FALL RIVER DR N OF RIVER CROSS in NEW PORT RICHEY, FL)
National Pollutant Discharge Elimination System NON-MAJOR (Tracking pollutant discharge elimination systems) - permit Organizations: ALEX DEEB (CONTACT/OWNER)
7-ELEVEN STORE #23662 (2411 SEVEN SPRINGS BLVD in NEW PORT RICHEY, FL)
National Pollutant Discharge Elimination System NON-MAJOR (Tracking pollutant discharge elimination systems) - permit Organizations: WILO SMITH (CONTACT/OWNER)
AUTO FASHIONS AUTO BODY & PAINT (4538 TROUBLE CREEK RD in NEW PORT RICHEY, FL)
(Resource Conservation and Recovery Act (tracking hazardous waste)) Organizations: BRODERICK DOBARGANES, OWNER (CONTACT/OWNER)
JENKINS STREET POND EXPANSION (B/W LAKE ST, CSX RR, ALLEN ST, in PLANT CITY, FL)
National Pollutant Discharge Elimination System NON-MAJOR (Tracking pollutant discharge elimination systems) - permit Organizations: KATHERINE BURKE (CONTACT/OWNER)
LONGLEAF NEIGHBORHOOD 3, PHASE (STARKEY BLVD/TOWN AVE in NEW PORT RICHEY, FL)
National Pollutant Discharge Elimination System NON-MAJOR (Tracking pollutant discharge elimination systems) - permit Organizations: RICH LEATHAM (CONTACT/OWNER)
Housing units lacking complete plumbing facilities: 0.4%
Housing units lacking complete kitchen facilities: 0.2%
91.3% Electricity 6.9% Utility gas 1.1% No fuel used
Population in 1990: 13,849. Population change in the 1990s: +10,520 (+76.0%).
Place of birth for U.S.-born residents:
This state: 14,297Northeast: 12,278Midwest: 7,274South: 4,649West: 1,503
50% of the 34655 zip code residents lived in the same house 5 years ago.
Out of people who lived in different houses, 30% lived in this county.
Out of people who lived in different counties, 50% lived in Florida.
88% of the 34655 zip code residents lived in the same house 1 year ago.
Out of people who lived in different houses, 32% moved from this county.
Out of people who lived in different houses, 40% moved from different county within same state.
Out of people who lived in different houses, 27% moved from different state.
Out of people who lived in different houses, 3% moved from abroad.
Private vs. public school enrollment:
Students in private schools in grades 1 to 8 (elementary and middle school): 441
Students in private schools in grades 9 to 12 (high school): 293
Students in private undergraduate colleges: 444
Occupation by median earnings in the past 12 months ($)
118,672 Architecture and engineering occupations 91,631 Health diagnosing and treating practitioners and other technical occupations 82,173 Computer and mathematical occupations 78,743 Business and financial operations occupations 76,266 Legal occupations 66,908 Law enforcement workers including supervisors
Top industries in this zip code by the number of employees in 2005:
Accommodation and Food Services: Full-Service Restaurants (100-249 employees: 1 establishment, 20-49 employees: 4 establishments, 10-19 employees: 2 establishments, 5-9 employees: 2 establishments, 1-4 employees: 6 establishments)Health Care and Social Assistance: Offices of Physicians (except Mental Health Specialists) (50-99: 1, 20-49: 1, 10-19: 3, 5-9: 9, 1-4: 8)Accommodation and Food Services: Limited-Service Restaurants (20-49: 4, 10-19: 4, 1-4: 5)Other Services (except Public Administration): Civic and Social Organizations (100-249: 1, 1-4: 1)Finance and Insurance: Commercial Banking (10-19: 6, 5-9: 4, 1-4: 2)
People in group quarters in 2010:
55 people in nursing facilities/skilled-nursing facilities
37 people in college/university student housing
People in group quarters in 2000:
24 people in college dormitories (includes college quarters off campus)
12 people in homes for the mentally retarded
5 people in other group homes
Fatal accident statistics in 2014:
Fatal accident count: 3Vehicles involved in fatal accidents: 5Fatal accidents caused by drunken drivers: 1Fatalities: 3Persons involved in fatal accidents: 9Pedestrians involved in fatal accidents: 1
Fatal accident statistics in 2013:
Fatal accident count: 3Vehicles involved in fatal accidents: 5Fatal accidents caused by drunken drivers: 1Fatalities: 3Persons involved in fatal accidents: 10Pedestrians involved in fatal accidents: 1
Home Mortgage Disclosure Act Aggregated Statistics For Year 2009(Based on 5 full and 8 partial tracts) A) FHA, FSA/RHS & VA B) Conventional C) Refinancings D) Home Improvement Loans F) Non-occupant Loans on G) Loans On Manufactured Number Average Value Number Average Value Number Average Value Number Average Value Number Average Value Number Average Value
LOANS ORIGINATED 286 $171,003 334 $153,183 687 $158,780 25 $63,884 111 $119,353 2 $23,720 APPLICATIONS APPROVED, NOT ACCEPTED 8 $148,178 25 $198,716 77 $178,618 12 $30,099 11 $229,471 0 $0 APPLICATIONS DENIED 58 $166,687 70 $175,466 448 $190,670 41 $67,470 41 $155,503 3 $21,593 APPLICATIONS WITHDRAWN 39 $183,733 54 $143,701 214 $178,273 12 $85,610 22 $97,693 1 $30,320 FILES CLOSED FOR INCOMPLETENESS 13 $156,599 8 $146,332 66 $198,259 2 $261,210 1 $164,000 0 $0
Aggregated Statistics For Year 2008(Based on 5 full and 8 partial tracts) A) FHA, FSA/RHS & VA B) Conventional C) Refinancings D) Home Improvement Loans F) Non-occupant Loans on G) Loans On Manufactured Number Average Value Number Average Value Number Average Value Number Average Value Number Average Value Number Average Value
LOANS ORIGINATED 192 $172,894 423 $187,114 598 $164,822 61 $68,132 98 $147,543 8 $80,008 APPLICATIONS APPROVED, NOT ACCEPTED 14 $176,736 70 $172,238 148 $186,330 33 $37,917 16 $148,094 6 $75,318 APPLICATIONS DENIED 25 $175,170 57 $190,680 565 $191,278 79 $51,975 36 $139,936 9 $93,642 APPLICATIONS WITHDRAWN 17 $170,556 48 $196,451 185 $196,155 13 $100,039 11 $124,947 2 $99,215 FILES CLOSED FOR INCOMPLETENESS 6 $194,120 17 $126,182 54 $219,825 0 $0 9 $133,622 0 $0
Aggregated Statistics For Year 2007(Based on 5 full and 8 partial tracts) A) FHA, FSA/RHS & VA B) Conventional C) Refinancings D) Home Improvement Loans F) Non-occupant Loans on G) Loans On Manufactured Number Average Value Number Average Value Number Average Value Number Average Value Number Average Value Number Average Value
LOANS ORIGINATED 37 $171,784 908 $182,348 1,345 $173,079 180 $81,409 213 $146,254 7 $77,079 APPLICATIONS APPROVED, NOT ACCEPTED 2 $120,730 141 $175,894 317 $180,514 43 $83,501 39 $188,600 7 $60,081 APPLICATIONS DENIED 13 $149,463 221 $195,703 1,018 $194,559 137 $75,745 90 $181,544 9 $65,316 APPLICATIONS WITHDRAWN 6 $138,808 77 $189,545 466 $187,822 42 $67,809 46 $127,477 1 $48,410 FILES CLOSED FOR INCOMPLETENESS 0 $0 49 $238,243 179 $204,257 7 $124,180 24 $173,884 0 $0
Aggregated Statistics For Year 2006(Based on 5 full and 8 partial tracts) A) FHA, FSA/RHS & VA B) Conventional C) Refinancings D) Home Improvement Loans E) Loans on Dwellings For 5+ Families F) Non-occupant Loans on G) Loans On Manufactured Number Average Value Number Average Value Number Average Value Number Average Value Number Average Value Number Average Value Number Average Value
LOANS ORIGINATED 39 $199,769 1,951 $178,658 1,941 $175,638 285 $89,676 2 $3,934,920 522 $174,139 9 $91,603 APPLICATIONS APPROVED, NOT ACCEPTED 4 $217,050 288 $195,106 324 $170,594 61 $69,597 0 $0 99 $196,824 4 $58,688 APPLICATIONS DENIED 4 $219,515 408 $186,035 883 $176,968 183 $81,738 0 $0 150 $183,826 11 $49,600 APPLICATIONS WITHDRAWN 2 $226,570 346 $173,229 698 $174,009 64 $101,689 0 $0 132 $191,588 5 $76,614 FILES CLOSED FOR INCOMPLETENESS 1 $82,000 46 $149,830 222 $166,918 14 $139,322 0 $0 13 $163,215 0 $0
Aggregated Statistics For Year 2005(Based on 5 full and 8 partial tracts) A) FHA, FSA/RHS & VA B) Conventional C) Refinancings D) Home Improvement Loans F) Non-occupant Loans on G) Loans On Manufactured Number Average Value Number Average Value Number Average Value Number Average Value Number Average Value Number Average Value
LOANS ORIGINATED 52 $153,873 2,991 $174,602 2,243 $161,110 289 $85,810 686 $154,368 12 $92,779 APPLICATIONS APPROVED, NOT ACCEPTED 2 $174,035 264 $168,535 301 $131,974 58 $73,002 60 $133,611 5 $48,584 APPLICATIONS DENIED 13 $123,656 315 $169,534 938 $158,919 197 $60,205 78 $173,901 17 $63,220 APPLICATIONS WITHDRAWN 8 $144,568 307 $193,543 656 $170,884 104 $106,473 66 $176,563 3 $78,753 FILES CLOSED FOR INCOMPLETENESS 2 $266,015 91 $194,284 379 $167,951 13 $75,366 15 $173,624 2 $107,315
Aggregated Statistics For Year 2004(Based on 5 full and 8 partial tracts) A) FHA, FSA/RHS & VA B) Conventional C) Refinancings D) Home Improvement Loans F) Non-occupant Loans on G) Loans On Manufactured Number Average Value Number Average Value Number Average Value Number Average Value Number Average Value Number Average Value
LOANS ORIGINATED 135 $135,688 2,478 $152,588 1,628 $126,917 221 $77,850 434 $136,186 3 $45,863 APPLICATIONS APPROVED, NOT ACCEPTED 8 $137,645 228 $159,243 287 $121,428 54 $44,947 40 $196,557 6 $72,497 APPLICATIONS DENIED 15 $132,819 305 $161,879 830 $122,842 189 $53,266 92 $162,292 17 $64,059 APPLICATIONS WITHDRAWN 10 $150,134 246 $160,975 466 $131,078 45 $61,585 38 $150,632 2 $59,805 FILES CLOSED FOR INCOMPLETENESS 4 $125,912 67 $160,528 372 $138,034 38 $35,472 10 $150,428 16 $95,566
Aggregated Statistics For Year 2003(Based on 5 full and 8 partial tracts) A) FHA, FSA/RHS & VA B) Conventional C) Refinancings D) Home Improvement Loans F) Non-occupant Loans on Number Average Value Number Average Value Number Average Value Number Average Value Number Average Value
LOANS ORIGINATED 240 $122,971 1,906 $139,308 3,302 $116,815 109 $41,670 383 $139,414 APPLICATIONS APPROVED, NOT ACCEPTED 7 $94,196 125 $129,728 455 $105,642 46 $30,678 39 $110,543 APPLICATIONS DENIED 15 $114,849 195 $140,427 1,111 $110,144 121 $31,891 61 $172,173 APPLICATIONS WITHDRAWN 15 $120,908 144 $136,991 482 $119,537 16 $45,993 32 $128,298 FILES CLOSED FOR INCOMPLETENESS 2 $32,195 45 $119,328 118 $124,123 9 $45,149 7 $75,920
Aggregated Statistics For Year 2002(Based on 4 partial tracts) A) FHA, FSA/RHS & VA B) Conventional C) Refinancings D) Home Improvement Loans F) Non-occupant Loans on Number Average Value Number Average Value Number Average Value Number Average Value Number Average Value
LOANS ORIGINATED 118 $120,253 909 $119,364 1,038 $102,955 99 $30,950 148 $92,996 APPLICATIONS APPROVED, NOT ACCEPTED 4 $126,638 78 $115,705 161 $99,120 25 $24,007 19 $96,206 APPLICATIONS DENIED 13 $116,446 90 $110,189 343 $91,799 75 $25,616 12 $67,277 APPLICATIONS WITHDRAWN 13 $101,569 46 $125,622 180 $82,614 20 $32,850 17 $102,069 FILES CLOSED FOR INCOMPLETENESS 0 $0 18 $117,689 84 $101,902 0 $0 6 $41,907
Aggregated Statistics For Year 2001(Based on 4 partial tracts) A) FHA, FSA/RHS & VA B) Conventional C) Refinancings D) Home Improvement Loans F) Non-occupant Loans on Number Average Value Number Average Value Number Average Value Number Average Value Number Average Value
LOANS ORIGINATED 131 $104,995 828 $105,878 907 $91,273 90 $28,113 89 $102,630 APPLICATIONS APPROVED, NOT ACCEPTED 1 $43,830 64 $82,034 138 $81,109 28 $18,097 9 $91,011 APPLICATIONS DENIED 3 $75,763 103 $79,931 365 $86,037 53 $25,418 20 $73,578 APPLICATIONS WITHDRAWN 1 $81,030 50 $92,227 176 $94,551 3 $29,557 11 $61,325 FILES CLOSED FOR INCOMPLETENESS 0 $0 24 $81,009 38 $90,886 2 $56,695 0 $0
Aggregated Statistics For Year 2000(Based on 4 partial tracts) A) FHA, FSA/RHS & VA B) Conventional C) Refinancings D) Home Improvement Loans F) Non-occupant Loans on Number Average Value Number Average Value Number Average Value Number Average Value Number Average Value
LOANS ORIGINATED 118 $97,546 757 $87,199 244 $61,996 78 $21,574 86 $71,811 APPLICATIONS APPROVED, NOT ACCEPTED 6 $68,730 85 $82,780 60 $47,198 39 $22,744 8 $95,042 APPLICATIONS DENIED 11 $72,833 134 $76,400 146 $47,024 44 $19,688 10 $57,882 APPLICATIONS WITHDRAWN 3 $99,373 72 $89,498 97 $52,866 9 $34,913 2 $116,015 FILES CLOSED FOR INCOMPLETENESS 1 $23,700 14 $94,929 22 $82,747 0 $0 1 $17,580
Aggregated Statistics For Year 1999(Based on 3 partial tracts) A) FHA, FSA/RHS & VA B) Conventional C) Refinancings D) Home Improvement Loans F) Non-occupant Loans on Number Average Value Number Average Value Number Average Value Number Average Value Number Average Value
LOANS ORIGINATED 176 $132,793 802 $96,276 485 $71,762 106 $21,158 106 $81,855 APPLICATIONS APPROVED, NOT ACCEPTED 3 $62,843 62 $81,059 134 $72,718 32 $20,855 9 $61,179 APPLICATIONS DENIED 12 $84,336 95 $71,690 250 $59,624 94 $17,268 15 $65,445 APPLICATIONS WITHDRAWN 12 $85,183 65 $103,171 179 $71,121 14 $47,783 4 $42,208 FILES CLOSED FOR INCOMPLETENESS 2 $72,950 19 $97,973 41 $73,239 4 $19,212 3 $108,807
Private Mortgage Insurance Companies Aggregated Statistics For Year 2009(Based on 5 full and 8 partial tracts) A) Conventional B) Refinancings C) Non-occupant Loans on Number Average Value Number Average Value Number Average Value
LOANS ORIGINATED 31 $193,667 4 $244,828 0 $0 APPLICATIONS APPROVED, NOT ACCEPTED 17 $227,194 6 $276,262 0 $0 APPLICATIONS DENIED 8 $122,754 0 $0 4 $42,032 APPLICATIONS WITHDRAWN 2 $233,885 2 $215,890 0 $0 FILES CLOSED FOR INCOMPLETENESS 2 $366,680 4 $211,142 0 $0
Aggregated Statistics For Year 2008(Based on 5 full and 8 partial tracts) A) Conventional B) Refinancings C) Non-occupant Loans on Number Average Value Number Average Value Number Average Value
LOANS ORIGINATED 131 $223,724 39 $237,777 10 $145,285 APPLICATIONS APPROVED, NOT ACCEPTED 41 $240,376 51 $236,020 9 $210,818 APPLICATIONS DENIED 11 $266,316 3 $236,947 2 $327,485 APPLICATIONS WITHDRAWN 3 $249,647 6 $253,710 0 $0 FILES CLOSED FOR INCOMPLETENESS 4 $260,430 2 $277,860 0 $0
Aggregated Statistics For Year 2007(Based on 5 full and 8 partial tracts) A) Conventional B) Refinancings C) Non-occupant Loans on Number Average Value Number Average Value Number Average Value
LOANS ORIGINATED 250 $205,795 118 $234,738 30 $213,513 APPLICATIONS APPROVED, NOT ACCEPTED 55 $256,987 24 $253,877 15 $263,233 APPLICATIONS DENIED 0 $0 5 $259,286 0 $0 APPLICATIONS WITHDRAWN 22 $170,965 7 $238,361 3 $213,523 FILES CLOSED FOR INCOMPLETENESS 0 $0 0 $0 0 $0
Aggregated Statistics For Year 2006(Based on 5 full and 8 partial tracts) A) Conventional B) Refinancings C) Non-occupant Loans on Number Average Value Number Average Value Number Average Value
LOANS ORIGINATED 308 $234,339 74 $240,915 79 $236,413 APPLICATIONS APPROVED, NOT ACCEPTED 58 $256,354 20 $207,090 13 $172,526 APPLICATIONS DENIED 0 $0 0 $0 0 $0 APPLICATIONS WITHDRAWN 13 $225,329 6 $227,068 4 $221,778 FILES CLOSED FOR INCOMPLETENESS 2 $84,065 0 $0 2 $84,065
Aggregated Statistics For Year 2005(Based on 5 full and 8 partial tracts) A) Conventional B) Refinancings C) Non-occupant Loans on Number Average Value Number Average Value Number Average Value
LOANS ORIGINATED 439 $207,734 94 $182,891 99 $187,184 APPLICATIONS APPROVED, NOT ACCEPTED 83 $222,047 35 $190,385 21 $219,850 APPLICATIONS DENIED 0 $0 8 $160,292 0 $0 APPLICATIONS WITHDRAWN 42 $217,226 9 $162,008 12 $206,181 FILES CLOSED FOR INCOMPLETENESS 7 $192,191 0 $0 4 $240,565
Aggregated Statistics For Year 2004(Based on 5 full and 8 partial tracts) A) Conventional B) Refinancings C) Non-occupant Loans on Number Average Value Number Average Value Number Average Value
LOANS ORIGINATED 596 $174,429 93 $155,740 93 $137,466 APPLICATIONS APPROVED, NOT ACCEPTED 166 $194,630 46 $158,155 31 $144,970 APPLICATIONS DENIED 6 $160,627 0 $0 2 $112,205 APPLICATIONS WITHDRAWN 38 $193,569 6 $165,108 8 $203,519 FILES CLOSED FOR INCOMPLETENESS 2 $220,890 0 $0 0 $0
Aggregated Statistics For Year 2003(Based on 5 full and 8 partial tracts) A) Conventional B) Refinancings C) Non-occupant Loans on Number Average Value Number Average Value Number Average Value
LOANS ORIGINATED 543 $149,243 243 $147,946 109 $108,837 APPLICATIONS APPROVED, NOT ACCEPTED 81 $160,522 54 $136,028 17 $138,005 APPLICATIONS DENIED 5 $128,780 0 $0 0 $0 APPLICATIONS WITHDRAWN 16 $162,737 5 $123,086 4 $162,782 FILES CLOSED FOR INCOMPLETENESS 0 $0 0 $0 0 $0
Aggregated Statistics For Year 2002(Based on 4 partial tracts) A) Conventional B) Refinancings C) Non-occupant Loans on Number Average Value Number Average Value Number Average Value
LOANS ORIGINATED 235 $133,627 111 $128,526 21 $74,418 APPLICATIONS APPROVED, NOT ACCEPTED 21 $167,155 21 $105,917 0 $0 APPLICATIONS DENIED 2 $54,120 1 $51,210 2 $60,490 APPLICATIONS WITHDRAWN 8 $108,178 3 $129,253 2 $44,950 FILES CLOSED FOR INCOMPLETENESS 0 $0 0 $0 0 $0
Aggregated Statistics For Year 2001(Based on 4 partial tracts) A) Conventional B) Refinancings C) Non-occupant Loans on Number Average Value Number Average Value Number Average Value
LOANS ORIGINATED 233 $122,868 98 $131,251 15 $104,171 APPLICATIONS APPROVED, NOT ACCEPTED 18 $187,741 23 $147,871 2 $120,165 APPLICATIONS DENIED 4 $128,880 4 $117,415 0 $0 APPLICATIONS WITHDRAWN 4 $178,872 2 $308,185 0 $0 FILES CLOSED FOR INCOMPLETENESS 0 $0 2 $151,355 0 $0
Aggregated Statistics For Year 2000(Based on 4 partial tracts) A) Conventional B) Refinancings C) Non-occupant Loans on Number Average Value Number Average Value Number Average Value
LOANS ORIGINATED 249 $117,976 19 $120,102 25 $98,386 APPLICATIONS APPROVED, NOT ACCEPTED 27 $138,950 4 $179,180 0 $0 APPLICATIONS DENIED 8 $149,615 0 $0 1 $28,280 APPLICATIONS WITHDRAWN 0 $0 0 $0 0 $0 FILES CLOSED FOR INCOMPLETENESS 4 $107,325 0 $0 0 $0
Aggregated Statistics For Year 1999(Based on 3 partial tracts) A) Conventional B) Refinancings C) Non-occupant Loans on Number Average Value Number Average Value Number Average Value
LOANS ORIGINATED 229 $115,327 54 $100,886 19 $91,648 APPLICATIONS APPROVED, NOT ACCEPTED 19 $119,860 4 $85,780 2 $108,860 APPLICATIONS DENIED 4 $144,822 3 $113,000 0 $0 APPLICATIONS WITHDRAWN 10 $100,793 1 $180,990 2 $64,495 FILES CLOSED FOR INCOMPLETENESS 3 $106,273 1 $113,340 0 $0
2002 - 2018 National Fire Incident Reporting System (NFIRS) incidents See full 2006 National Fire Incident Reporting System statistics for zip code 34655, Florida
Most common first names in zip code 34655 among deceased individuals Name Count Lived (average)
John 199 76.2 years Robert 152 75.3 years William 140 77.7 years Mary 131 82.2 years Joseph 121 77.9 years James 118 77.0 years George 87 77.6 years Edward 84 80.3 years Charles 78 76.7 years Helen 73 83.1 years
Most common last names in zip code 34655 among deceased individuals Last name Count Lived (average)
Smith 26 77.4 years Jones 26 82.1 years Johnson 24 78.9 years Brown 23 78.2 years Moore 17 74.9 years Miller 15 76.1 years Taylor 15 82.3 years Wright 15 79.0 years Davis 14 76.3 years Kelly 14 75.9 years
Businesses in zip code 34655
Name Count Name Count
7-Eleven 4 Outback Steakhouse 1 AT&T 1 Panera Bread 1 Advance Auto Parts 1 Payless 1 Buffalo Wild Wings 1 Penske 1 CVS 2 PetSmart 1 Chick-Fil-A 1 Pier 1 Imports 1 Cold Stone Creamery 1 Publix Super Markets 3 Curves 1 Quiznos 1 Domino's Pizza 1 SONIC Drive-In 1 Dunkin Donuts 1 Starbucks 3 FedEx 3 Steak 'n Shake 1 GameStop 1 Subway 4 H&R Block 1 Target 1 IHOP 1 U-Haul 1 Jones New York 1 UPS 9 Little Caesars Pizza 1 Walgreens 2 Marshalls 1 Walmart 1 McDonald's 1 YMCA 1 Outback 1

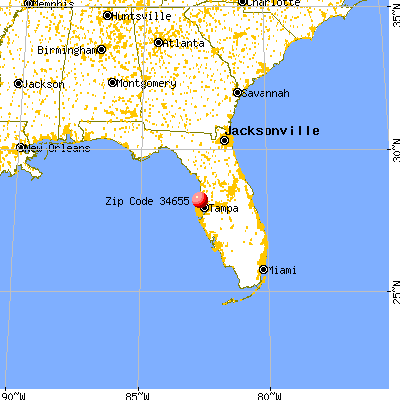


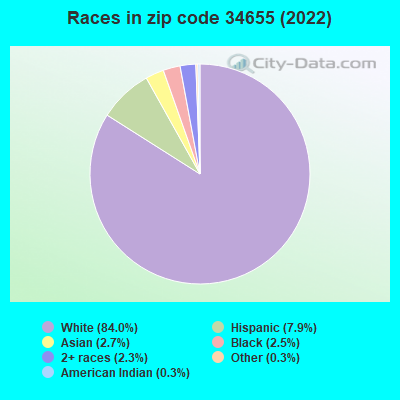


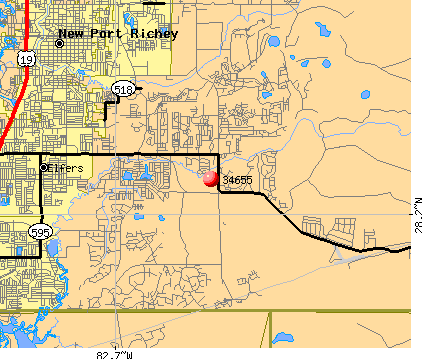 Nearest zip codes: 33556, 34653, 34654, 34688, 34690, 33558.
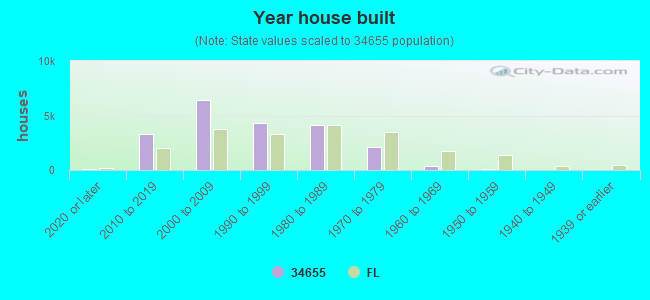

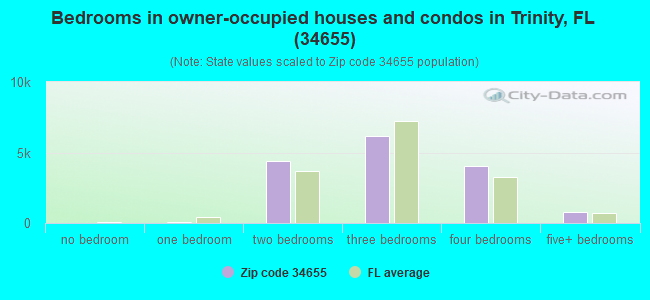
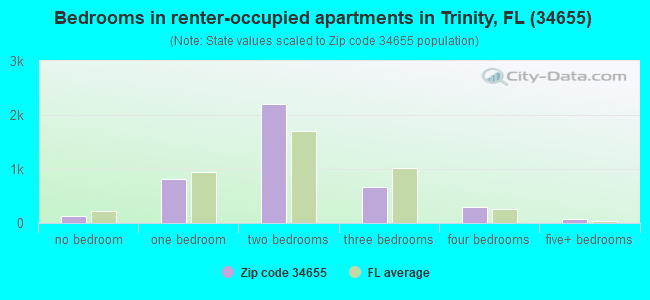
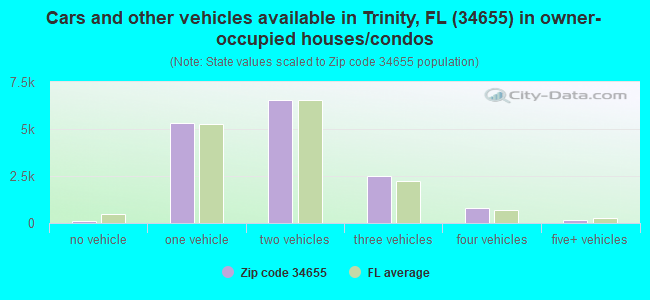
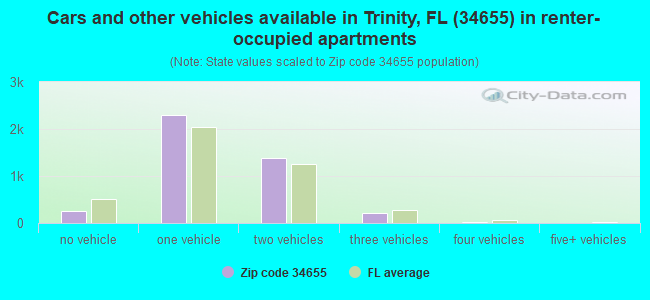


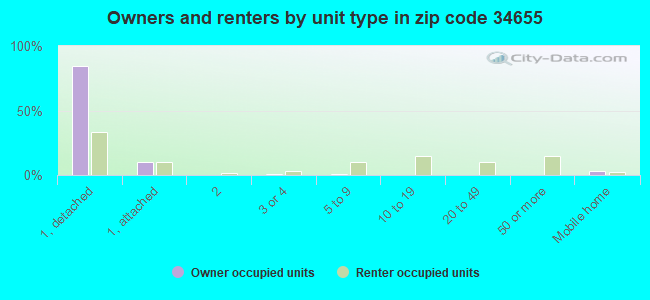


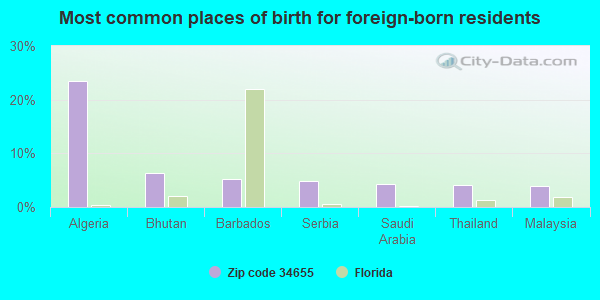
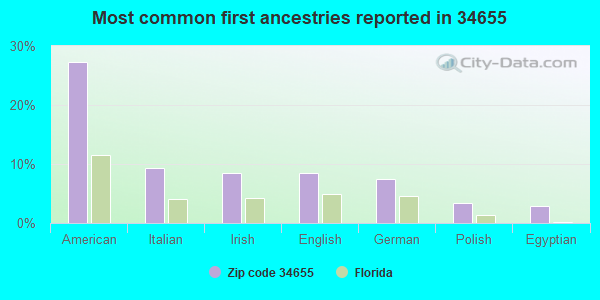
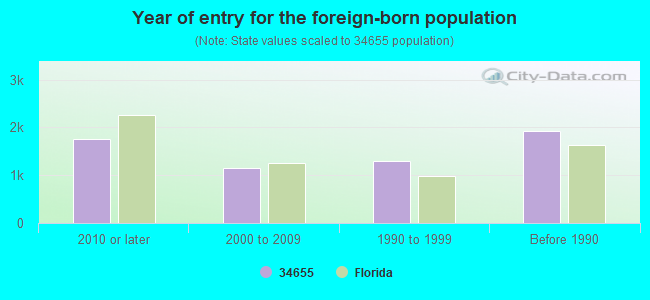

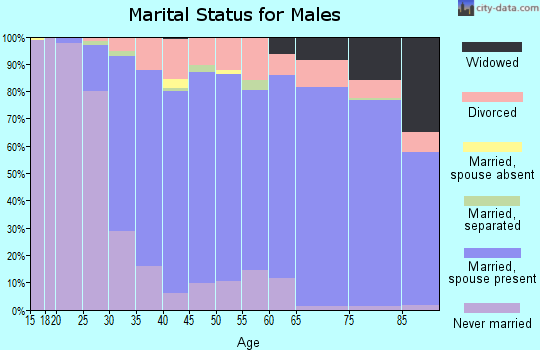
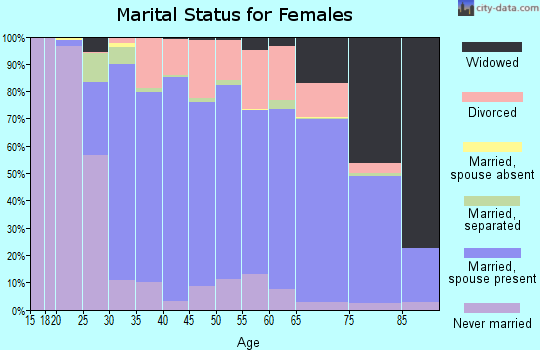
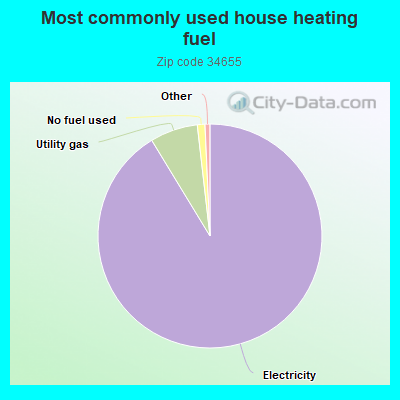
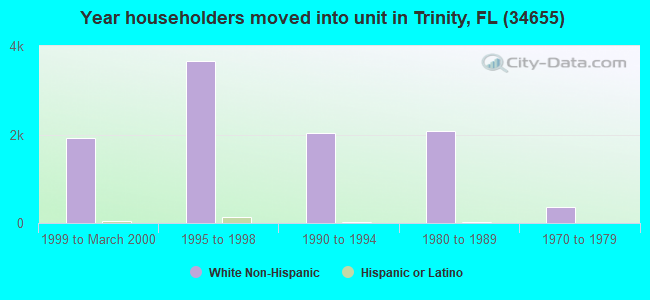
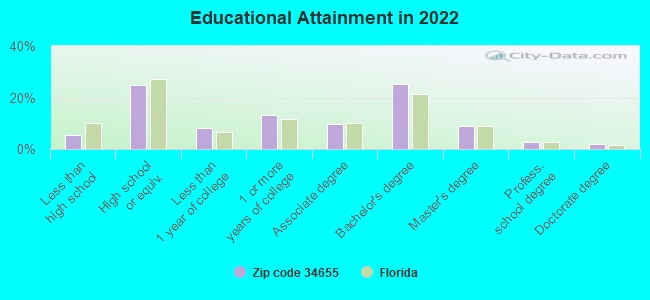
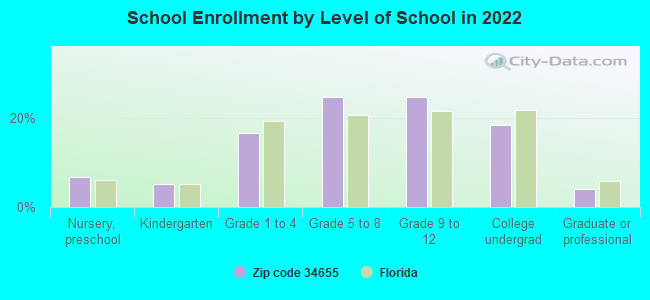
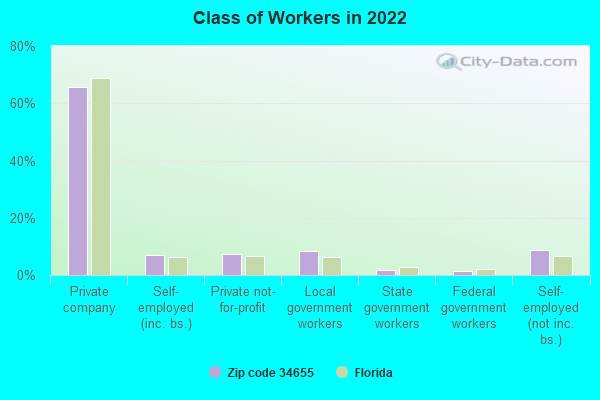
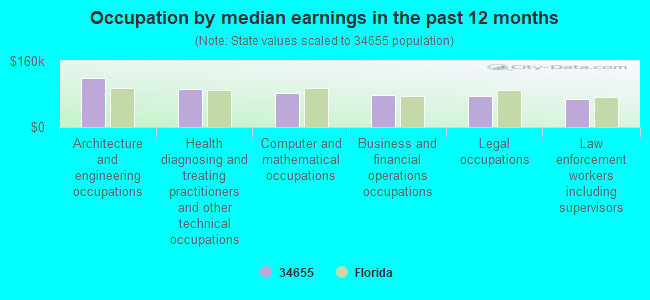
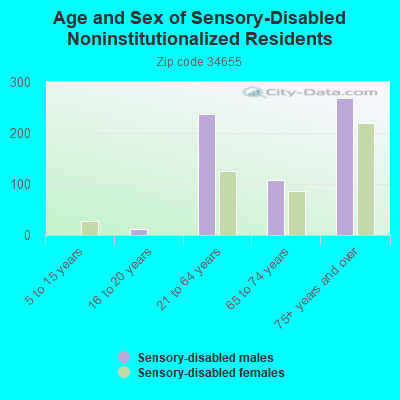
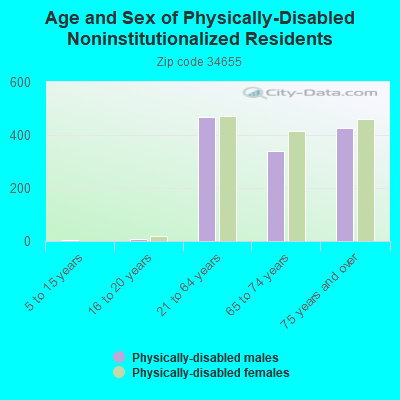
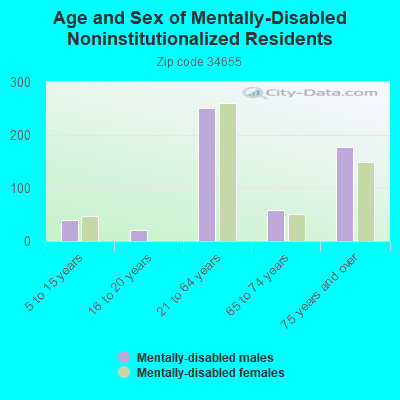
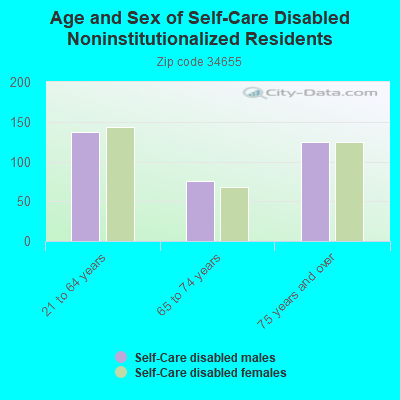
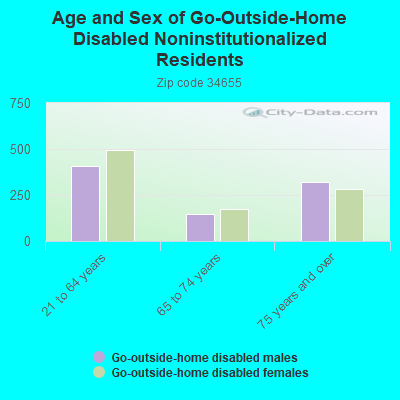
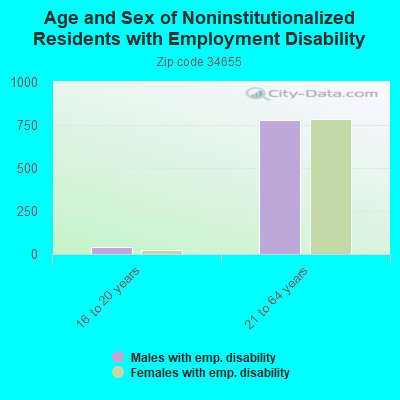
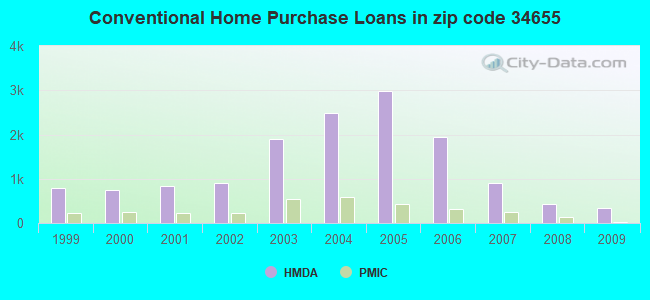
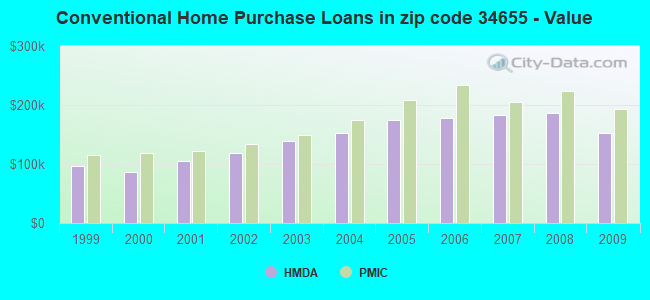
 According to the data from the years 2002 - 2018 the average number of fire incidents per year is 54. The highest number of fire incidents - 66 took place in 2007, and the least - 37 in 2002. The data has a rising trend.
 When looking into fire subcategories, the most reports belonged to: Outside Fires (46.9%), and Structure Fires (30.8%).