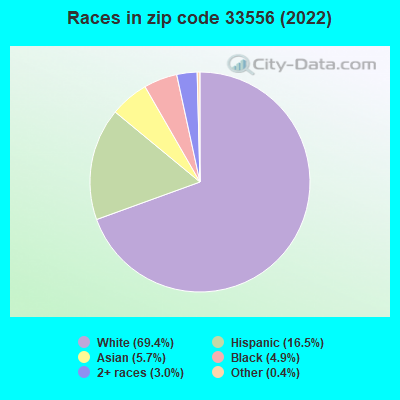
Estimated zip code population in 2022: 31,243 Zip code population in 2010: 22,015 Zip code population in 2000: 13,995
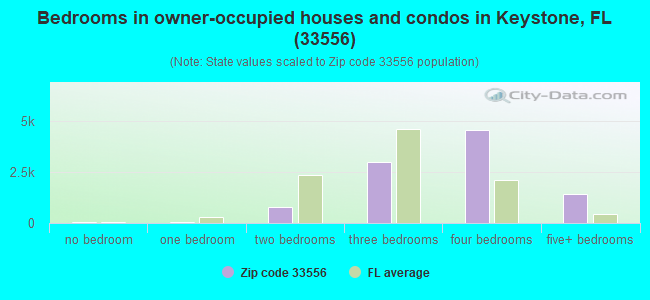
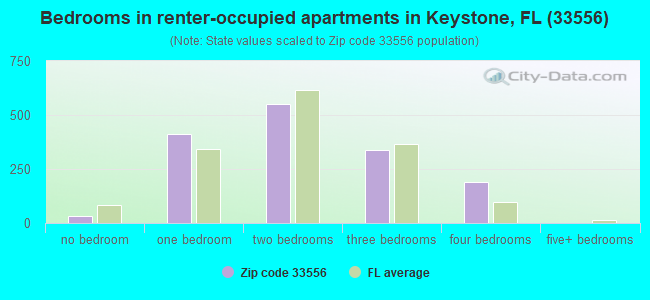
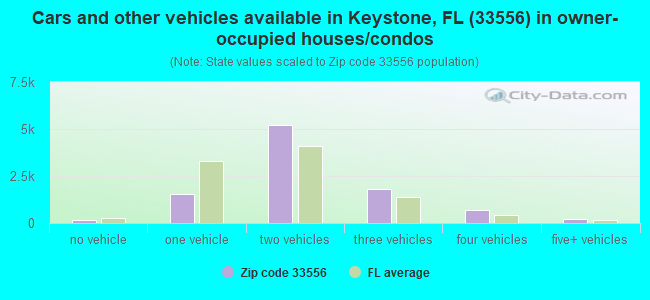
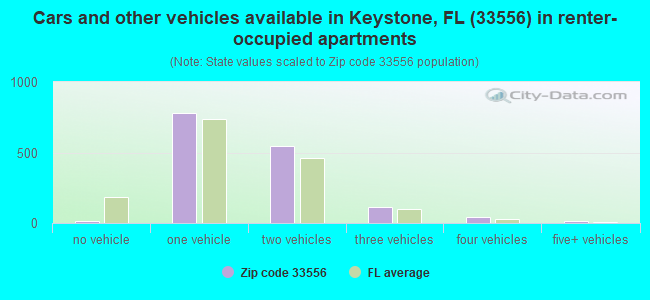
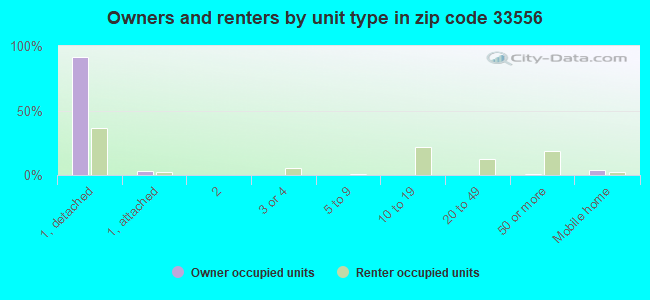
Houses and condos: 11,617 Renter-occupied apartments: 1,519
% of renters here:
14%
State:
33%
March 2022 cost of living index in zip code 33556: 98.5 (near average, U.S. average is 100)
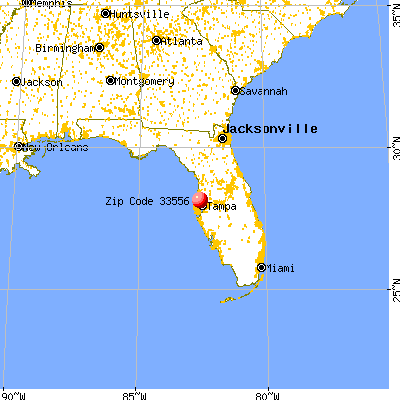
Land area: 36.6 sq. mi. Water area: 4.3 sq. mi.
Population density: 853 people per square mile
(low).
OSM Map
General Map
Google Map
MSN Map
OSM Map
General Map
Google Map
MSN Map
OSM Map
General Map
Google Map
MSN Map
OSM Map
General Map
Google Map
MSN Map
Please wait while loading the map...
Real estate property taxes paid for housing units in 2022:
This zip code:
0.8% ($5,334)
Florida:
0.7% ($2,529)
Median real estate property taxes paid for housing units with mortgages in 2022: $5,530 (0.9%) Median real estate property taxes paid for housing units with no mortgage in 2022: $4,640 (0.8%)
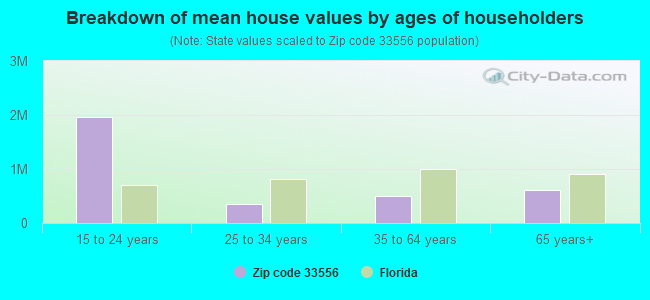
Estimated median house/condo value in 2022: $644,215
33556:
$644,215
Florida:
$354,100
According to our research of Florida and other state lists, there were 19 registered sex offenders living in 33556 zip code as of April 27, 2024. The ratio of all residents to sex offenders in zip code 33556 is 1,171 to 1. The ratio of registered sex offenders to all residents in this zip code is lower than the state average.
Median resident age:
This zip code:
42.2 years
Florida median age:
42.7 years
Average household size:
This zip code:
2.8 people
Florida:
2.5 people
Averages for the 2020 tax year for zip code 33556, filed in 2021:
Average Adjusted Gross Income (AGI) in 2020: $152,736 (Individual Income Tax Returns)
Here:
$152,736
State:
$82,200
Salary/wage: $113,388 (reported on 82.4% of returns)
Here:
$113,388
State:
$58,347
(% of AGI for various income ranges: 1194.5% for AGIs below $25k, 3763.1% for AGIs $25k-50k, 6633.3% for AGIs $50k-75k, 9560.7% for AGIs $75k-100k, 19367.1% for AGIs $100k-200k, 88543.0% for AGIs over 200k)
Taxable interest for individuals: $3,120 (reported on 38.4% of returns)
This zip code:
$3,120
Florida:
$4,272
(% of AGI for various income ranges: 27.1% for AGIs below $25k, 37.3% for AGIs $25k-50k, 57.7% for AGIs $50k-75k, 110.3% for AGIs $75k-100k, 157.3% for AGIs $100k-200k, 1412.0% for AGIs over 200k)
Ordinary dividends: $13,103 (reported on 31.4% of returns)
Here:
$13,103
State:
$15,863
(% of AGI for various income ranges: 48.8% for AGIs below $25k, 71.9% for AGIs $25k-50k, 160.2% for AGIs $50k-75k, 200.6% for AGIs $75k-100k, 373.7% for AGIs $100k-200k, 5750.8% for AGIs over 200k)
Net capital gain/loss in AGI: +$45,020 (reported on 30.9% of returns)
Here:
+$45,020
State:
+$62,983
(% of AGI for various income ranges: 26.1% for AGIs below $25k, 80.5% for AGIs $25k-50k, 124.6% for AGIs $50k-75k, 331.7% for AGIs $75k-100k, 652.3% for AGIs $100k-200k, 22637.8% for AGIs over 200k)
Profit/loss from business: +$16,432 (reported on 19.5% of returns)
Here:
+$16,432
State:
+$9,719
(% of AGI for various income ranges: 168.0% for AGIs below $25k, 177.1% for AGIs $25k-50k, 232.7% for AGIs $50k-75k, 410.6% for AGIs $75k-100k, 594.3% for AGIs $100k-200k, 2680.0% for AGIs over 200k)
Taxable individual retirement arrangement distribution: $26,278 (reported on 10.7% of returns)
33556:
$26,278
Florida:
$24,823
(% of AGI for various income ranges: 67.8% for AGIs below $25k, 127.4% for AGIs $25k-50k, 263.8% for AGIs $50k-75k, 473.3% for AGIs $75k-100k, 781.7% for AGIs $100k-200k, 1763.7% for AGIs over 200k)
Self-employed (Keogh) retirement plans: $25,477 (reported on 0.8% of returns)
33556:
$25,477
Florida:
$29,694
(% of AGI for various income ranges: 39.4% for AGIs $100k-200k, 269.0% for AGIs over 200k)
Total itemized deductions: $40,409 (reported on 15.5% of returns)
Here:
$40,409
State:
$45,393
(% of AGI for various income ranges: 80.0% for AGIs below $25k, 181.3% for AGIs $25k-50k, 445.3% for AGIs $50k-75k, 571.7% for AGIs $75k-100k, 1121.5% for AGIs $100k-200k, 6582.7% for AGIs over 200k)
Charity contributions: $14,849 (reported on 12.6% of returns)
Here:
$14,849
State:
$20,178
(% of AGI for various income ranges: 4.2% for AGIs below $25k, 20.5% for AGIs $25k-50k, 60.5% for AGIs $50k-75k, 68.0% for AGIs $75k-100k, 210.4% for AGIs $100k-200k, 2620.7% for AGIs over 200k)
Taxes paid: $8,054 (reported on 15.3% of returns)
33556:
$8,054
State:
$6,967
(% of AGI for various income ranges: 13.1% for AGIs below $25k, 34.3% for AGIs $25k-50k, 96.2% for AGIs $50k-75k, 124.4% for AGIs $75k-100k, 285.7% for AGIs $100k-200k, 1127.4% for AGIs over 200k)
Earned income credit: $1,995 (reported on 7.5% of returns)
Here:
$1,995
State:
$2,306
(% of AGI for various income ranges: 60.0% for AGIs below $25k, 49.8% for AGIs $25k-50k, 0.7% for AGIs $50k-75k)
Percentage of individuals using paid preparers for their 2020 taxes: 92.4%
Here:
92%
State:
92%
(% for various income ranges: 90.6% for AGIs below $25k, 92.0% for AGIs $25k-50k, 92.4% for AGIs $50k-75k, 92.8% for AGIs $75k-100k, 93.1% for AGIs $100k-200k, 94.0% for AGIs over 200k)
Averages for the 2012 tax year for zip code 33556, filed in 2013:
Average Adjusted Gross Income (AGI) in 2012: $116,459 (Individual Income Tax Returns)
Here:
$116,459
State:
$60,316
Salary/wage: $87,430 (reported on 83.8% of returns)
Here:
$87,430
State:
$45,277
(% of AGI for various income ranges: 72.8% for AGIs below $25k, 76.2% for AGIs $25k-50k, 70.8% for AGIs $50k-75k, 73.7% for AGIs $75k-100k, 77.2% for AGIs $100k-200k, 51.4% for AGIs over 200k)
Taxable interest for individuals: $3,020 (reported on 44.6% of returns)
This zip code:
$3,020
Florida:
$3,587
(% of AGI for various income ranges: 2.8% for AGIs below $25k, 1.5% for AGIs $25k-50k, 1.3% for AGIs $50k-75k, 0.8% for AGIs $75k-100k, 1.0% for AGIs $100k-200k, 1.1% for AGIs over 200k)
Ordinary dividends: $10,968 (reported on 31.9% of returns)
Here:
$10,968
State:
$12,831
(% of AGI for various income ranges: 4.3% for AGIs below $25k, 2.0% for AGIs $25k-50k, 2.5% for AGIs $50k-75k, 1.7% for AGIs $75k-100k, 1.5% for AGIs $100k-200k, 4.1% for AGIs over 200k)
Net capital gain/loss in AGI: +$16,685 (reported on 27.6% of returns)
Here:
+$16,685
State:
+$33,493
(% of AGI for various income ranges: 0.2% for AGIs $50k-75k, 1.1% for AGIs $75k-100k, 1.2% for AGIs $100k-200k, 6.8% for AGIs over 200k)
Profit/loss from business: +$17,797 (reported on 17.3% of returns)
Here:
+$17,797
State:
+$10,012
(% of AGI for various income ranges: 7.9% for AGIs below $25k, 3.7% for AGIs $25k-50k, 3.8% for AGIs $50k-75k, 2.4% for AGIs $75k-100k, 2.4% for AGIs $100k-200k, 2.3% for AGIs over 200k)
Taxable individual retirement arrangement distribution: $21,612 (reported on 12.1% of returns)
33556:
$21,612
Florida:
$21,544
(% of AGI for various income ranges: 4.9% for AGIs below $25k, 3.5% for AGIs $25k-50k, 4.4% for AGIs $50k-75k, 3.2% for AGIs $75k-100k, 3.1% for AGIs $100k-200k, 1.2% for AGIs over 200k)
Self-employment retirement plans: $24,860 (reported on 1.0% of returns)
33556:
$24,860
Florida:
$20,611
(% of AGI for various income ranges: 0.2% for AGIs $100k-200k, 0.3% for AGIs over 200k)
Total itemized deductions: $27,468 (14% of AGI, reported on 45.7% of returns)
Here:
$27,468
State:
$25,533
Here:
13.7% of AGI
State:
18.0% of AGI
(% of AGI for various income ranges: 15.4% for AGIs below $25k, 13.4% for AGIs $25k-50k, 15.7% for AGIs $50k-75k, 14.6% for AGIs $75k-100k, 13.5% for AGIs $100k-200k, 7.8% for AGIs over 200k)
Charity contributions: $5,748 (reported on 39.1% of returns)
Here:
$5,748
State:
$5,698
(% of AGI for various income ranges: 0.9% for AGIs below $25k, 1.1% for AGIs $25k-50k, 1.8% for AGIs $50k-75k, 1.9% for AGIs $75k-100k, 1.9% for AGIs $100k-200k, 2.1% for AGIs over 200k)
Taxes paid: $7,513 (reported on 45.2% of returns)
33556:
$7,513
State:
$6,203
(% of AGI for various income ranges: 3.1% for AGIs below $25k, 2.9% for AGIs $25k-50k, 3.7% for AGIs $50k-75k, 4.2% for AGIs $75k-100k, 3.6% for AGIs $100k-200k, 2.3% for AGIs over 200k)
Earned income credit: $1,952 (reported on 9.4% of returns)
Here:
$1,952
State:
$2,372
(% of AGI for various income ranges: 4.1% for AGIs below $25k, 0.7% for AGIs $25k-50k)
Percentage of individuals using paid preparers for their 2012 taxes: 52.9%
Here:
53%
State:
54%
(% for various income ranges: 44.9% for AGIs below $25k, 46.5% for AGIs $25k-50k, 55.6% for AGIs $50k-75k, 55.2% for AGIs $75k-100k, 55.7% for AGIs $100k-200k, 74.3% for AGIs over 200k)
Averages for the 2004 tax year for zip code 33556, filed in 2005:
Average Adjusted Gross Income (AGI) in 2004: $95,468 (Individual Income Tax Returns)
Here:
$95,468
State:
$50,523
Salary/wage: $75,847 (reported on 85.4% of returns)
Here:
$75,847
State:
$39,563
(% of AGI for various income ranges: 72.9% for AGIs $10k-25k, 76.5% for AGIs $25k-50k, 79.9% for AGIs $50k-75k, 79.5% for AGIs $75k-100k, 62.4% for AGIs over 100k)
Taxable interest for individuals: $3,257 (reported on 60.1% of returns)
This zip code:
$3,257
Florida:
$3,211
(% of AGI for various income ranges: 3.7% for AGIs $10k-25k, 2.1% for AGIs $25k-50k, 1.2% for AGIs $50k-75k, 1.3% for AGIs $75k-100k, 2.1% for AGIs over 100k)
Taxable dividends: $3,747 (reported on 38.0% of returns)
Here:
$3,747
State:
$6,129
(% of AGI for various income ranges: 1.9% for AGIs $10k-25k, 1.7% for AGIs $25k-50k, 1.6% for AGIs $50k-75k, 1.0% for AGIs $75k-100k, 1.5% for AGIs over 100k)
Net capital gain/loss: +$17,976 (reported on 34.0% of returns)
Here:
+$17,976
State:
+$27,205
(% of AGI for various income ranges: 1.1% for AGIs $10k-25k, 1.2% for AGIs $25k-50k, 2.1% for AGIs $50k-75k, 2.6% for AGIs $75k-100k, 8.2% for AGIs over 100k)
Profit/loss from business: +$16,886 (reported on 17.7% of returns)
Here:
+$16,886
State:
+$10,634
(% of AGI for various income ranges: 6.3% for AGIs $10k-25k, 4.9% for AGIs $25k-50k, 2.8% for AGIs $50k-75k, 3.3% for AGIs $75k-100k, 2.9% for AGIs over 100k)
IRA payment deduction: $3,651 (reported on 4.1% of returns)
33556:
$3,651
Florida:
$3,082
(% of AGI for various income ranges: 0.4% for AGIs $10k-25k, 0.3% for AGIs $25k-50k, 0.3% for AGIs $50k-75k, 0.2% for AGIs $75k-100k, 0.1% for AGIs over 100k)
Self-employed pension: $13,567 (reported on 1.2% of returns)
Here:
$13,567
Florida:
$15,857
(% of AGI for various income ranges: 0.4% for AGIs $10k-25k, 0.2% for AGIs $75k-100k, 0.2% for AGIs over 100k)
Total itemized deductions: $24,159 (17% of AGI, reported on 54.6% of returns)
Here:
$24,159
State:
$20,370
Here:
17.3% of AGI
State:
20.7% of AGI
(% of AGI for various income ranges: 17.4% for AGIs $10k-25k, 19.2% for AGIs $25k-50k, 23.1% for AGIs $50k-75k, 18.5% for AGIs $75k-100k, 11.1% for AGIs over 100k)
Charity contributions deductions: $4,748 (3% of AGI, reported on 48.4% of returns)
Here:
$4,748
State:
$4,064
Here:
3.2% of AGI
State:
3.8% of AGI
(% of AGI for various income ranges: 1.2% for AGIs $10k-25k, 2.0% for AGIs $25k-50k, 2.3% for AGIs $50k-75k, 2.2% for AGIs $75k-100k, 2.5% for AGIs over 100k)
Total tax: $20,093 (reported on 83.2% of returns)
33556:
$20,093
State:
$9,431
(% of AGI for various income ranges: 4.7% for AGIs $10k-25k, 7.2% for AGIs $25k-50k, 8.4% for AGIs $50k-75k, 10.0% for AGIs $75k-100k, 21.2% for AGIs over 100k)
Earned income credit: $1,539 (reported on 6.0% of returns)
Here:
$1,539
State:
$1,808
Percentage of individuals using paid preparers for their 2004 taxes: 56.4%
Here:
56%
State:
60%
(% for various income ranges: 48.7% for AGIs below $10k, 50.9% for AGIs $10k-25k, 56.8% for AGIs $25k-50k, 56.7% for AGIs $50k-75k, 54.2% for AGIs $75k-100k, 64.3% for AGIs over 100k)
Likely homosexual households (counted as self-reported same-sex unmarried-partner households)
Lesbian couples: 0.1% of all households
Gay men: 0.0% of all households
Household received Food Stamps/SNAP in the past 12 months: 174 Household did not receive Food Stamps/SNAP in the past 12 months: 11,048
Women who had a birth in the past 12 months: 378 (334 now married, 56 unmarried) Women who did not have a birth in the past 12 months: 6,317 (3,629 now married, 2,692 unmarried)
Housing units in zip code 33556 with a mortgage: 6,960 (577 second mortgage, 9 home equity loan, 486 both second mortgage and home equity loan) Houses without a mortgage: 170
Median monthly owner costs for units with a mortgage: $2,658 Median monthly owner costs for units without a mortgage: $788
Residents with income below the poverty level in 2022:
This zip code:
4.5%
Whole state:
12.7%
Residents with income below 50% of the poverty level in 2022:
This zip code:
2.1%
Whole state:
6.6%
Median number of rooms in houses and condos:
Here:
7.6
State:
5.9
Median number of rooms in apartments:
Here:
4.4
State:
4.2
Notable locations in this zip code not listed on our city pages
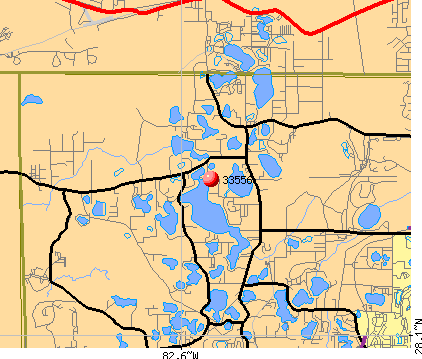
Notable locations in zip code 33556: Camp Brorein (A), Camp Keystone (B), Camp Singing Pines (C), Pasco Plaza (D), Camp Mawain (E), Pasco County Fire Rescue Station 15 (F), Austin Davis Public Library (G). Display/hide their locations on the map
Lakes: Cypress Lake (A), Lake Alice (B), Lake Minniola (C), Lake Ann (D), Lake Armistead (E), Lake Artillery (F), Black Lake (G), Mound Lake (H). Display/hide their locations on the map
6,742 married couples with children.
829 single-parent households (424 men, 405 women).
81.2% of residents of 33556 zip code speak English at home.
9.8% of residents speak Spanish at home (71% very well, 10% well, 18% not well, 1% not at all).
6.4% of residents speak other Indo-European language at home (74% very well, 24% well, 2% not well).
1.6% of residents speak Asian or Pacific Island language at home (60% very well, 17% well, 4% not well, 19% not at all).
0.7% of residents speak other language at home (77% very well, 23% well).
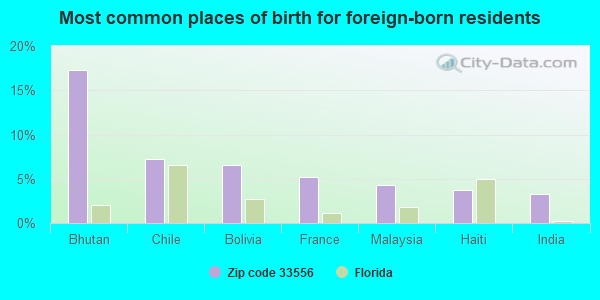
Foreign born population: 3,832 (12.3%) (59.5% of them are naturalized citizens)
This zip code:
12.3%
Whole state:
21.7%
17%Bhutan
7%Chile
7%Bolivia
5%France
4%Malaysia
4%Haiti
3%India
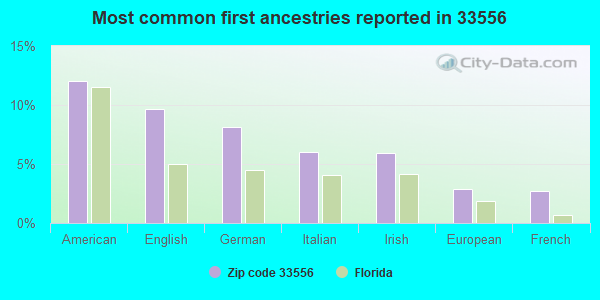
12%American
10%English
8%German
6%Italian
6%Irish
3%European
3%French
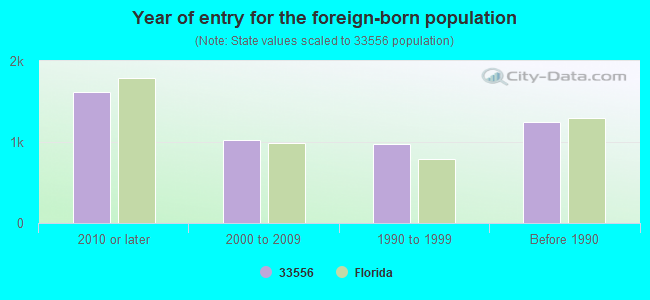
Year of entry for the foreign-born population
1,6132010 or later
1,0252000 to 2009
9761990 to 1999
1,242Before 1990
Major facilities with environmental interests located in this zip code:
INCRETE SYSTEM (1725 GUNN HIGHWAY in ODESSA, FL)
AIR MINOR (AIRS/AFS) (Integrated Compliance Information System) - ICIS-04-2001-0107, FORMAL ENFORCEMENT ACTION CRITERIA AND HAZARDOUS AIR POLLUTANT INVENTORY (Inventory of air pollution sources) (Resource Conservation and Recovery Act (tracking hazardous waste)) TRI REPORTER (Tracking of toxic chemicals releasing facilities) Business SIC classification: PAINTS, VARNISHES, LACQUERS, ENAMELS, AND ALLIED PRODUCTS; ADHESIVES AND SEALANTS; NONCLASSIFIABLE ESTABLISHMENTS Business NAICS classification: ADHESIVE MANUFACTURING. Organizations: ALEX MAURITZ, PLT MGR (CONTACT/OWNER)
Alternative names: INCO CHEMICAL SUPPLY CO. INC.
APAC-FLORIDA INCORPORATED (2315 MARATHON ROAD in ODESSA, FL)
AIR SYNTHETIC MINOR (AIRS/AFS) CRITERIA AND HAZARDOUS AIR POLLUTANT INVENTORY (Inventory of air pollution sources) National Pollutant Discharge Elimination System NON-MAJOR (Tracking pollutant discharge elimination systems) - permit Small Quantity Generators, between 100 kg and 1000 kg of hazardous waste/month (Resource Conservation and Recovery Act (tracking hazardous waste)) - notification TRI REPORTER (Tracking of toxic chemicals releasing facilities) Business SIC classification: PULP MILLS; ASPHALT PAVING MIXTURES AND BLOCKS Organizations: L. ROLLINS (CONTACT/OWNER)
, DILWORTH HAL SUPT (CONTACT/OWNER)
Alternative names: APAC FLORIDA INC. PASCO PLANT TAMPA DIV., APAC-FLORIDA INC - PLANT 414, APAC FLORIDA INC. TAMPA DIV., COUCH CONSTRUCTION CO
SEVEN EAGLES INC (11422 SR 54 in ODESSA, FL)
National Pollutant Discharge Elimination System NON-MAJOR (Tracking pollutant discharge elimination systems) - permit (Resource Conservation and Recovery Act (tracking hazardous waste)) Business SIC classification: AIRPORTS, FLYING FIELDS, AND AIRPORT TERMINAL SERVICES Organizations: ANITA BRINKS (CONTACT/OWNER)
, WILLIAM HOOVER (CONTACT/OWNER)
Alternative names: TAMPA BAY EXECUTIVE AIRPORT
REMA RICHIE INC (11543 PERPETUAL DR in ODESSA, FL)
AIR MINOR (AIRS/AFS) (Resource Conservation and Recovery Act (tracking hazardous waste)) Business SIC classification: DRYCLEANING PLANTS, EXCEPT RUG CLEANING Organizations: REMA RICHIE PROPERTIE LLP (CONTACT/OWNER)
Alternative names: MAJIK TOUCH CLEANERS
ODESSA 24" FINISHED WATER MAIN (INTERSECTION/SR 54 & GUNN HWY in ODESSA, FL)
National Pollutant Discharge Elimination System NON-MAJOR (Tracking pollutant discharge elimination systems) - permit National Pollutant Discharge Elimination System NON-MAJOR (Tracking pollutant discharge elimination systems) - permit Alternative names: LESTER'S CONSTRUCTION CO INC, PASCO COUNTY
MID COAST CONCRETE CO., INC. - (12025 S.R. 54 in ODESSA, FL)
National Pollutant Discharge Elimination System NON-MAJOR (Tracking pollutant discharge elimination systems) - permit Business SIC classification: READY-MIXED CONCRETE Organizations: ALBERT ROMANCKY (CONTACT/OWNER)
A 1 SUPERIOR INCORPORATED (2426 SUCCESS DR. in ODESSA, FL)
CRITERIA AND HAZARDOUS AIR POLLUTANT INVENTORY (Inventory of air pollution sources) (Resource Conservation and Recovery Act (tracking hazardous waste)) TRI REPORTER (Tracking of toxic chemicals releasing facilities) Business SIC classification: MANUFACTURING INDUSTRIES Business NAICS classification: OTHER STRUCTURAL CLAY PRODUCT MANUFACTURING.
NORTHWEST REGIONAL RESIDUALS R (10888 SOUTH MOBLEY ROAD in ODESSA, FL)
National Pollutant Discharge Elimination System NON-MAJOR (Tracking pollutant discharge elimination systems) - permit Organizations: MICHAEL MCWEENY (CONTACT/OWNER)
K.M.L. CLEANERS INC (8544 GUNN HIGHWAY in ODESSA, FL)
AIR MINOR (AIRS/AFS) Small Quantity Generators, between 100 kg and 1000 kg of hazardous waste/month (Resource Conservation and Recovery Act (tracking hazardous waste)) - notification Business SIC classification: DRYCLEANING PLANTS, EXCEPT RUG CLEANING Organizations: JOSE ALOMAR, OWNER (CONTACT/OWNER)
Alternative names: KML CLEANERS
GREY HAEK AT LAKE POLO - PHASE (STATE ROAD 54, JUST W OF ALTAM in ODESSA, FL)
National Pollutant Discharge Elimination System NON-MAJOR (Tracking pollutant discharge elimination systems) - permit Organizations: DOUGLAS WEILAND (CONTACT/OWNER)
GREY HAWK AT LAKE POLO - PHASE (SOUTHWEST CORNER OF INTERSECTI in ODESSA, FL)
National Pollutant Discharge Elimination System NON-MAJOR (Tracking pollutant discharge elimination systems) - permit Organizations: DOUGLAS WEILAND (CONTACT/OWNER)
GREY HAWK AT LAKE POLO--RECREA (STATE ROAD 54, JUST WEST OF AL in ODESSA, FL)
National Pollutant Discharge Elimination System NON-MAJOR (Tracking pollutant discharge elimination systems) - permit Organizations: DOUGLAS WEILAND (CONTACT/OWNER)
2121 GUNN BUSINESS PARK (2017 GUNN HIGHWAY in ODESSA, FL)
National Pollutant Discharge Elimination System NON-MAJOR (Tracking pollutant discharge elimination systems) - permit Organizations: CLIFF ECK (CONTACT/OWNER)
Housing units lacking complete plumbing facilities: 0.9% Housing units lacking complete kitchen facilities: 0.4%
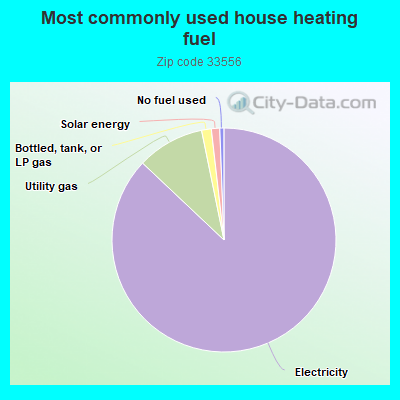
86.8%Electricity
9.7%Utility gas
1.4%Bottled, tank, or LP gas
1.2%Solar energy
0.6%No fuel used
Population in 1990: 7,046. Population change in the 1990s: +6,949 (+98.6%).
Place of birth for U.S.-born residents:
This state: 10,922
Northeast: 5,768
Midwest: 4,414
South: 3,613
West: 1,588
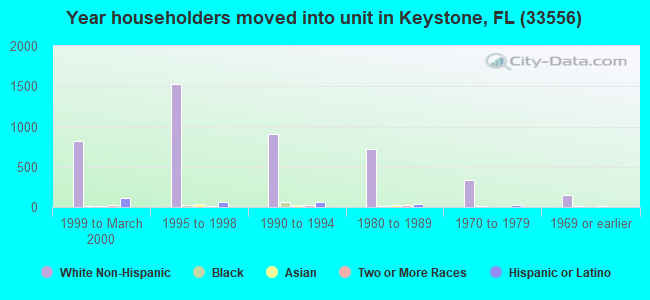
51% of the 33556 zip code residents lived in the same house 5 years ago. Out of people who lived in different houses, 49% lived in this county. Out of people who lived in different counties, 50% lived in Florida.
85% of the 33556 zip code residents lived in the same house 1 year ago. Out of people who lived in different houses, 28% moved from this county. Out of people who lived in different houses, 36% moved from different county within same state. Out of people who lived in different houses, 31% moved from different state. Out of people who lived in different houses, 7% moved from abroad.
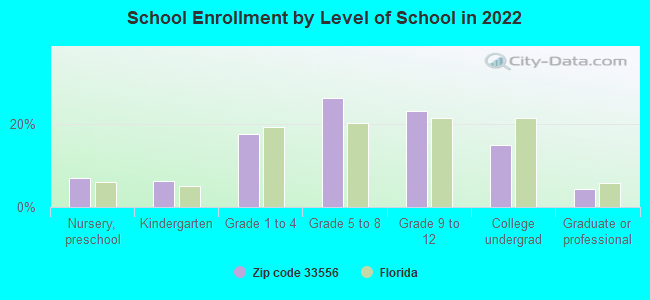
Private vs. public school enrollment:
Students in private schools in grades 1 to 8 (elementary and middle school): 592
Here:
17.0%
Florida:
15.8%
Students in private schools in grades 9 to 12 (high school): 409
Here:
22.3%
Florida:
12.9%
Students in private undergraduate colleges: 337
Here:
28.4%
Florida:
23.6%
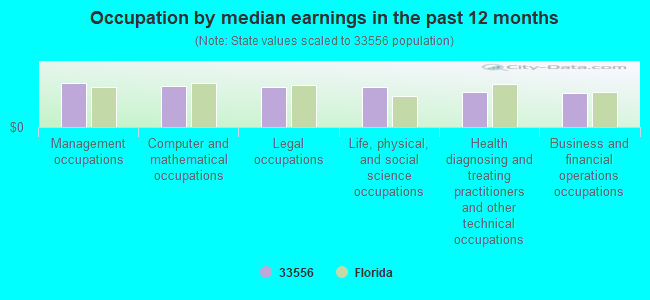
Occupation by median earnings in the past 12 months ($)
127,610Management occupations
118,301Computer and mathematical occupations
116,115Legal occupations
115,735Life, physical, and social science occupations
102,124Health diagnosing and treating practitioners and other technical occupations
97,491Business and financial operations occupations
Companies with federal contracts located in this zip code (ODESSA, FL):
SAND CASTLE DESIGN CORPORATION (16107 TURNBURY OAK DR; small business) : $736,241 in 15 contractsfrom 2000 to 2001
Contracts for Motorcycles, Motor Scooters, and Bicycles, Fire Fighting Equipment, Compressors and Vacuum Pumps, Air Conditioning Equipment, and moreby Army, Federal Law Enforcement Training Center (disused code, now 7015), Air Force, Navy, and others Signed by year:2000: $313,680; 2001: $422,561; 2002: $0; 2003: $0; 2004: $0; 2005: $0; 2006: $0.
Biggest contracts:
$254,507 with Army for Motorcycles, Motor Scooters, and Bicycles. Taking place in CO. Signed on 2000-09-30. Completion date: 2000-12-01.
$61,000 with Federal Law Enforcement Training Center (disused code, now 7015) for Fire Fighting Equipment. Taking place in IL. Signed on 2001-03-15. Completion date: 2001-03-15.
$56,453 with Air Force for Compressors and Vacuum Pumps. Signed on 2001-09-30. Completion date: 2001-12-21.
$46,977 with Air Force for Air Conditioning Equipment. Signed on 2001-09-30. Completion date: 2001-11-09.
OPINICUS CORPORATION (11418 SR 54; small business) : $131,760 in 4 contractsfrom 2003 to 2006
$36,854 with Navy for ADP Central Processing Unit (CPU, Computer), Analog. Signed on 2003-09-25. Completion date: 2004-01-06.
$34,306 with Navy for ADP Central Processing Unit (CPU, Computer), Analog. Taking place in WA. Signed on 2004-06-01. Completion date: 2004-09-30.
$30,446 with Navy for Miscellaneous Electrical and Electronic Components. Signed on 2006-05-18. Completion date: 2006-09-04.
$30,154 with Navy for Operation Training Devices. Signed on 2004-11-10. Completion date: 2005-02-25.
BEX VOICE & DATA SERVICE INC (19119 ROGERS RD; small business) 50 employees, $0 revenue: $87,066 in 3 contractsin 2005
$66,462 with Navy for Communications Security Equipment and Components. Taking place in TX. Signed on 2005-09-30. Completion date: 2006-09-16.
$20,148 with U.S. Fish and Wildlife Service for Telephone and Telegraph Equipment. Taking place in LA. Signed on 2005-09-12. Completion date: 2005-09-12.
$456, same as above.Signed on 2005-09-28. Completion date: 2005-09-28.
MATRIX MATERIAL HANDLING CORPO (11505 BELMACK BLVD S; small business)
$71,000 with Air Force for Warehousing and Storage Services. Signed on 2005-09-28. Completion date: 2005-12-15.
FEDCO SYSTEMS CO (1920 GUNN HWY) : $35,262 in 2 contractsin 2002
$35,262 with Navy for Kitchen Equipment and Appliances. Taking place in MD. Signed on 2002-06-27. Completion date: 2002-08-16.
$0, same as above.Signed on 2002-06-27. Completion date: 2002-08-16.
SOUTHERN BIOMEDICAL INC (18214 KEYSTONE GROVE BLVD; small business) : $9,700 in 3 contractsfrom 2003 to 2004
$4,950 with Navy for Maintenance, Repair and Rebuilding of Equipment -- Instruments and Laboratory Equipment. Signed on 2004-10-01. Completion date: 2003-09-30.
$4,750, same as above.Signed on 2003-10-01. Completion date: 2003-09-30.
$0, same as above.Signed on 2003-10-01. Completion date: 2003-09-30.
DAIS-ANALYTIC CORP (11552 PROSPEROUS DRIVE; small business) : -$30,458 in 2 contractsin 2002
$0 with Air Force for Rural Community Services and Development -- Advanced Development (R&D). Taking place in MA. Signed on 2002-06-10. Completion date: 2002-06-10.
-$30,458, same as above.Signed on 2002-06-10. Completion date: 2002-06-10.
Top industries in this zip code by the number of employees in 2005:
2002 - 2018 National Fire Incident Reporting System (NFIRS) incidents
Based on the data from the years 2002 - 2018 the average number of fire incidents per year is 24. The highest number of fires - 42 took place in 2010, and the least - 10 in 2003. The data has a growing trend.
When looking into fire subcategories, the most incidents belonged to: Outside Fires (44.3%), and Structure Fires (25.1%).
Fire incident types reported to NFIRS in Zip Code 33556


 Nearest zip codes: 33626, 33625, 34655, 33624, 33558, 34688.


 Based on the data from the years 2002 - 2018 the average number of fire incidents per year is 24. The highest number of fires - 42 took place in 2010, and the least - 10 in 2003. The data has a growing trend.
 When looking into fire subcategories, the most incidents belonged to: Outside Fires (44.3%), and Structure Fires (25.1%).